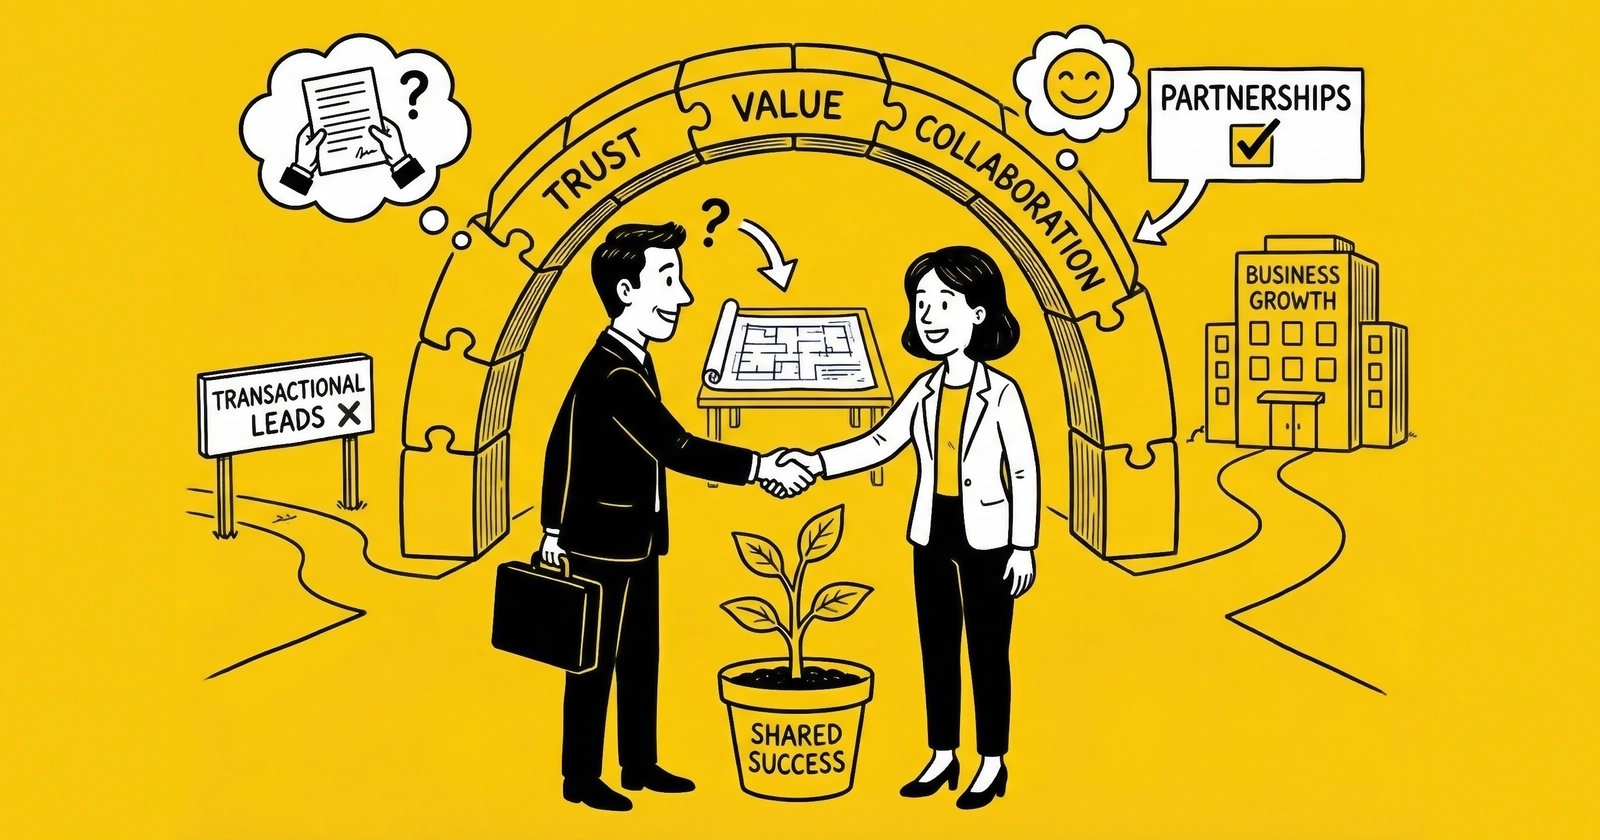
Your existing buyers are not just current revenue sources. They are the foundation of sustainable business value. This guide reveals the frameworks, metrics, and relationship strategies that separate lead businesses generating consistent returns from those running on a perpetual acquisition treadmill.
The Real Economics of Buyer Relationships
The math on new buyer acquisition is brutal. Industry data consistently shows that acquiring a new B2B customer costs five to seven times more than retaining an existing one. In lead generation specifically, where buyer acquisition involves technical integrations, compliance verification, and relationship building that can span weeks or months, the ratio skews even higher.
Yet most lead generation operators spend disproportionate energy chasing new buyers while their existing accounts quietly erode. They celebrate new contracts while ignoring the warning signs from established relationships. Then they wonder why revenue growth stalls despite constant buyer acquisition activity.
Here is the uncomfortable truth: a 5% improvement in buyer retention can boost revenue by 25% to 95% over time. Those who understand this reality build businesses that compound value. Those who chase new logos while neglecting existing relationships discover that growth without retention is an expensive illusion.
This guide provides the complete framework for building, maintaining, and expanding buyer relationships that generate sustainable returns. You will learn to calculate the true lifetime value of your buyers, recognize the patterns of relationship degradation before they become terminal, and implement the retention and expansion strategies that transform transactional vendors into indispensable partners. For foundational lead economics, see our guide on understanding lead quality scores.
Understanding Buyer Lifetime Value in Lead Generation
Customer lifetime value (LTV) in lead generation differs fundamentally from consumer CLV calculations. You are not measuring individual purchase frequency and basket size. You are measuring ongoing commercial relationships with variable volume, evolving pricing, and complex quality dynamics that can shift dramatically over time.
The Core LTV Formula
At its simplest, buyer LTV equals the total gross profit you will generate from a buyer over the entire duration of your relationship. The calculation requires four components:
Average Monthly Revenue represents the typical revenue generated from the buyer across all products and campaigns. This is not a simple average. You need to account for seasonality, market cycles, and the natural evolution of volume as relationships mature.
Gross Margin per Lead captures your profit after direct costs. For a broker, this means sell price minus acquisition cost. For a publisher, it is CPL received minus traffic acquisition cost. Include validation fees, platform costs, and any variable expenses tied to lead delivery.
Retention Rate measures the probability that a buyer remains active from one period to the next. In B2B services, average annual retention runs around 73% to 83%, though lead generation specifically shows significant variance based on vertical and quality consistency.
Relationship Duration can be calculated directly from your retention rate. If you retain 80% of buyers annually (20% churn), your average relationship duration is five years using the formula: Duration = 1 / Churn Rate.
The simplified LTV formula becomes:
LTV = (Average Monthly Revenue x Gross Margin %) x (1 / Monthly Churn Rate)
For a buyer generating $15,000 monthly at 25% gross margin with 5% monthly churn:
LTV = ($15,000 x 0.25) x (1 / 0.05) = $3,750 x 20 = $75,000
That single buyer relationship is worth $75,000 in lifetime value. Suddenly, the economics of relationship investment become clear.
Why Retention Rates Determine Everything
The compounding impact of retention improvement is dramatic. Moving from 80% to 90% annual retention doubles your average relationship duration and roughly doubles your LTV without acquiring a single new buyer.
| Annual Retention | Annual Churn | Average Duration |
|---|---|---|
| 70% | 30% | 3.3 years |
| 80% | 20% | 5.0 years |
| 85% | 15% | 6.7 years |
| 90% | 10% | 10.0 years |
The math reveals why the best operators obsess over retention metrics. A business with 70% retention must acquire new buyers three times faster than one with 90% retention just to maintain the same customer base. That acquisition cost difference compounds dramatically over time, consuming resources that could otherwise fuel growth.
The Revenue Ramp Reality
Revenue from buyer relationships follows predictable patterns that differ from consumer behavior. New buyers typically start with limited volume as they test quality and validate operational fit. Month one might represent 20% to 30% of eventual steady-state volume.
Ramp periods vary by buyer sophistication. A call center with established quality benchmarks might scale to full volume within 30 days once quality validates. An individual agent purchasing their first leads might take six months to develop confidence and optimize their sales process.
| Phase | Timeline | % of Steady-State Volume | Characteristics |
|---|---|---|---|
| Testing | Month 1 | 20-30% | Quality validation, integration testing |
| Ramping | Months 2-3 | 50-70% | Building confidence, process optimization |
| Steady State | Months 4-12 | 100% | Full contracted volume |
| Expansion | Year 2+ | 100-150%+ | Additional products, increased volume |
Failed relationships often terminate during the testing or ramping phases before reaching full value. This means your LTV calculation should weight survival probabilities by phase. Not every new buyer reaches steady state.
Expansion Revenue: The Hidden Multiplier
The most valuable buyer relationships do not just maintain volume. They expand. Expansion revenue represents the additional value captured through volume increases, new products, and pricing optimization within existing accounts.
Net Revenue Retention (NRR) captures this dynamic. NRR above 100% means expansion revenue exceeds lost revenue from churn and downgrades. Among B2B services companies with higher average contract values, roughly 41% report NRR exceeding 100%.
Lead generation operators should track the same metric. A buyer who starts at $10,000 monthly and grows to $15,000 monthly generates 50% more value than your initial projection. A buyer who starts at $10,000 and contracts to $6,000 destroys your unit economics even if they technically remain active.
The Trust Degradation Timeline: Recognizing Warning Signs
Every buyer relationship follows a predictable lifecycle. Understanding this rhythm helps you anticipate challenges before they threaten the account. Those who recognize these patterns early can intervene while relationships remain salvageable. Those who miss the signals discover problems only when termination notices arrive.
The Honeymoon Phase (Month 1)
New buyers arrive with optimism and patience. They are testing your quality, learning your systems, and building internal processes around your leads. Minor issues get overlooked. Response times are forgiving. The buyer wants the relationship to work.
This is exactly when sloppy operators create future problems. They over-deliver during trials, set unrealistic quality expectations, or make verbal commitments that become disputed later. The honeymoon ends, but the expectations persist.
Use this phase to establish clear operational norms: documented quality standards, explicit return policies, defined communication channels, and mutual understanding of what constitutes acceptable performance.
First Friction (Months 2-3)
Reality intrudes. The buyer encounters their first quality issues. Leads that do not convert. Returns that feel excessive. Volume fluctuations that disrupt their operation. First disputes arise.
How you handle these early friction points determines relationship trajectory. Responsive problem resolution builds trust. Defensive posturing erodes it. Buyers form lasting impressions during this phase about whether you are a partner they can work with or a vendor they need to manage.
The contact rate benchmarks matter here. Industry research shows leads contacted within one minute have 391% higher conversion rates than those contacted after 30 minutes. If your leads consistently underperform on contact rates, buyers will notice during this phase even if they do not immediately articulate the concern.
The Drift Zone (Months 4-6)
Financial pressures emerge. Buyers who were paying Net-15 slip to Net-30, then Net-45. Disputes become leverage for payment delays. Communication frequency decreases. The relationship either stabilizes into productive partnership or begins sliding toward termination.
This is the critical intervention window. Proactive attention during months four through six often determines whether buyers reach the stable partnership phase where LTV compounds.
Warning signs to monitor:
- Payment delays exceeding 15 days beyond terms
- Decreased response time to your communications
- Increased return rate claims
- Reduction in volume orders without explanation
- New contacts entering the conversation without introduction
Decision Time (Months 7-12)
The relationship either stabilizes into a productive partnership or deteriorates toward termination. Buyers have formed their assessment. They are either committed or actively evaluating alternatives.
By this point, you should have clear visibility into:
- The buyer’s satisfaction level based on direct feedback
- Their volume trajectory compared to initial commitments
- Payment behavior patterns
- Quality feedback and return rate trends
- The strength of personal relationships with key contacts
Relationships that survive the first year typically stabilize. Mutual understanding develops. Communication patterns mature. The relationship either deepens into genuine partnership or terminates as accumulated friction exceeds tolerance.
The Quality Incident Cascade
Quality incidents are inevitable. Leads include bad data. Consumer complaints generate buyer frustration. Traffic sources underperform. The question is not whether incidents occur. It is how they compound.
Each unresolved quality incident degrades trust incrementally. A single bad week might generate a concerned email. A pattern of bad weeks triggers escalation to leadership. Sustained quality problems activate churn consideration.
The trust degradation pattern follows a predictable sequence:
| Incident Count | Buyer Response | Trust Level |
|---|---|---|
| 1st incident | Inquiry, patience | 90% |
| 2nd incident | Concern, documentation | 75% |
| 3rd incident | Escalation, demands | 50% |
| 4th incident | Active alternatives search | 25% |
| 5th incident | Termination decision | Terminal |
Notice the non-linear decay. Early incidents erode trust slowly. Later incidents accelerate collapse. By the time a buyer is actively searching alternatives, the relationship is in crisis mode.
The Seven Pillars of Buyer Relationship Excellence
Building lasting buyer relationships requires systematic attention across seven interconnected dimensions. Excellence in one area cannot compensate for failure in another. Those who build sustainable partnerships master all seven.
Pillar 1: Quality Consistency
Quality inconsistency kills buyer relationships faster than consistently mediocre quality. A buyer who receives 70% contact rate every week can optimize around that expectation. A buyer whose contact rate swings between 85% and 55% weekly cannot build a reliable business.
Consistency requires deliberate operational discipline:
Source Diversification. Concentration risk manifests as quality volatility. If 60% of a buyer’s leads come from a single traffic source, that source’s bad week becomes the buyer’s crisis. Blend sources to smooth quality variance.
Quality Monitoring with Thresholds. Establish quality floors by buyer and source. When metrics approach thresholds, intervene before breaching them. Reactive quality management means buyers experience the problem before you address it.
Proactive Communication. When quality metrics decline, tell buyers before they tell you. “I noticed contact rates dropped this week. Here is what happened and how we are fixing it.” This transforms quality problems from trust erosion events into demonstrations of operational competence.
SLA Commitments. Formalize quality expectations in agreements. Specific commitments create accountability and give buyers confidence that quality matters to you operationally, not just rhetorically.
Pillar 2: Communication Excellence
Research consistently shows that poor communication drives more buyer churn than pricing or even quality issues. Buyers who feel informed and heard tolerate significantly more operational friction than buyers who feel ignored.
Effective communication operates at multiple frequencies:
Daily/Weekly Operational Updates. Volume delivery confirmation, quality metrics summaries, any issues requiring attention. Automated dashboards reduce manual effort while maintaining visibility.
Monthly Business Reviews. Scheduled conversations reviewing performance trends, upcoming changes, and strategic alignment. These catch drift before it becomes divergence.
Quarterly Strategic Discussions. Broader conversations about market conditions, buyer business evolution, and partnership opportunities. Decision-makers need context beyond operational metrics.
Real-Time Issue Escalation. When problems occur, immediate notification demonstrates responsiveness. Silence during quality incidents amplifies buyer frustration.
The communication principle: over-communicate during problems, maintain steady cadence during stability.
Pillar 3: Speed and Responsiveness
The data on speed-to-lead applies to your buyer relationships as well. Response time to buyer inquiries, issue resolution speed, and turnaround on requests all signal how much you value the relationship.
Industry benchmarks for acceptable response times:
| Request Type | Acceptable | Good | Excellent |
|---|---|---|---|
| Urgent quality issue | 4 hours | 1 hour | 30 minutes |
| Billing question | 24 hours | 8 hours | 4 hours |
| Volume adjustment request | 48 hours | 24 hours | Same day |
| New product inquiry | 48 hours | 24 hours | Same day |
| Contract question | 72 hours | 48 hours | 24 hours |
Every interaction delay signals your priorities. Buyers notice when responses take days instead of hours. They draw conclusions about your commitment level.
Pillar 4: Problem Resolution
Every relationship experiences problems. Resolution speed and quality determine whether problems strengthen or weaken the relationship.
Effective problem resolution requires:
Clear Escalation Paths. Buyers should know exactly who to contact when issues arise and what response time to expect. Ambiguous escalation paths extend resolution time and buyer frustration.
Authority to Resolve. Front-line contacts need decision authority. If every credit or adjustment requires management approval, resolution slows and buyer confidence drops.
Root Cause Analysis. Resolving symptoms without addressing causes creates recurring problems. Document issues, identify patterns, implement preventive measures, and communicate those measures to affected buyers.
Follow-Through Confirmation. After resolution, verify the buyer considers the issue closed. Unconfirmed resolution often means unresolved buyer frustration.
Post-Incident Relationship Repair. Major incidents require explicit relationship repair beyond operational resolution. Acknowledge impact, demonstrate learning, and reinforce commitment.
Pillar 5: Value-Added Services
Beyond lead delivery, what else do you offer that creates switching cost and differentiation? Value-added services transform vendor relationships into partnerships.
Consider adding:
Analytics and Insights. Market trends, competitive intelligence, conversion benchmarks. Information buyers cannot easily get elsewhere. Make yourself indispensable as an information source, not just a lead source.
Integration Support. Help buyers optimize their CRM configuration, lead routing, and follow-up workflows. The more embedded you become in their operation, the higher the switching cost.
Training and Best Practices. Buyers who convert leads better stay longer because their ROI improves. Invest in their success, and they invest in the relationship.
Flexible Commercial Terms. Seasonal adjustments, volume commitments with price advantages, pilot programs for new products. Demonstrate willingness to structure arrangements that serve buyer interests.
Compliance Documentation. Proactive consent evidence, regulatory updates, audit support. In an environment of increasing compliance scrutiny, making your buyer’s compliance burden lighter creates real value.
Pillar 6: Relationship Depth
Business happens between people. The strength of personal connections between your team and buyer contacts directly affects relationship durability.
Build relationship depth through:
Multiple Contact Points. Relationships that depend on single contacts fail when those contacts leave. Build connections across buyer organizations at operational, management, and executive levels.
Face-to-Face Meetings. Video calls and emails cannot replicate the relationship building that happens in person. Prioritize meeting key buyers at industry events or through dedicated visits.
Personal Attention. Remember birthdays, acknowledge promotions, celebrate their wins. Small gestures signal that you see them as people, not just purchase orders.
Transparency. Share your challenges as well as your successes. Vulnerability builds trust. Buyers who understand your constraints become more reasonable partners.
Pillar 7: Continuous Improvement
The best relationships evolve. Static relationships stagnate. Demonstrate ongoing investment in improvement:
Solicit Feedback Regularly. Formal surveys, informal conversations, and structured business reviews all provide feedback channels. Ask what you could do better and then act on the answers.
Invest in Capability. Upgrade your technology, expand your product offerings, and improve your operations. Buyers notice when you are investing in becoming a better partner.
Share Your Roadmap. Let buyers know what improvements are coming. Roadmap transparency gives them confidence in your trajectory and reasons to stay for what is coming.
Celebrate Milestones. Acknowledge relationship anniversaries, volume achievements, and successful expansions. Recognition reinforces the partnership.
Pricing and Value Alignment
Pricing strategy directly affects buyer relationships. Price too high, and buyers feel exploited. Price too low, and you cannot invest in quality. The goal is value alignment: pricing that reflects the genuine value you deliver while supporting sustainable operations on both sides.
Value-Based Pricing Fundamentals
Value-based pricing inverts the traditional cost-plus approach. Instead of starting with your costs, you start with the buyer’s economics and work backward.
Consider an auto insurance lead. If the buyer’s average customer lifetime value is $1,200, their close rate on your leads is 8%, and their fully-loaded cost to work a lead is $12, then:
- Expected revenue per lead: $1,200 x 8% = $96
- Less contact costs: $96 - $12 = $84 available value
- At 50% value capture: Achievable price = $42
This buyer can pay $42 for your lead and still make $42 per lead profit. That is sustainable economics for them and potentially better than cost-plus pricing that ignores their value.
Buyer Economics by Vertical
Understanding typical buyer economics helps you price intelligently even before building deep individual relationships:
| Vertical | Avg Customer LTV | Typical Close Rate | Max Viable CPL |
|---|---|---|---|
| Auto Insurance | $800-1,200 | 6-10% | $55-85 |
| Medicare | $1,500-2,500 | 8-15% | $80-150 |
| Term Life | $2,000-4,000 | 3-6% | $45-95 |
| Mortgage Refinance | $3,000-6,000 | 2-5% | $60-150 |
| Solar Installation | $4,000-8,000 | 4-8% | $120-250 |
| Personal Injury Legal | $8,000-25,000 | 1-3% | $150-400 |
These ranges vary significantly by buyer sophistication, geographic market, and lead quality. Use them as starting points for pricing conversations, not as fixed ceilings.
Return Policies and Relationship Trust
Returns and chargebacks erode both margins and trust. A $60 lead with 15% return rate is really a $51 lead. Clear return policies reduce disputes and protect both parties.
Typical acceptable return reasons:
- Invalid contact information (phone disconnected, email bounces)
- Duplicate leads within specified windows
- Filter criteria mismatch
- Geographic errors
Return reasons that should be rejected:
- No contact after reasonable attempts
- Consumer did not convert
- Consumer misrepresented themselves
- Changed circumstances after submission
Document your return policy clearly in buyer agreements. Specify acceptable reasons, required evidence, time windows, and dispute resolution procedures. Ambiguity invites conflict.
Buyer Concentration Risk: The Silent Killer
Concentration risk kills lead generation businesses quietly. An operator with 50% or more of revenue from a single buyer is not running a lead generation business. They are running an outsourced marketing department with no employment contract.
The statistics from industry analysis are stark: 20% of buyers generate 80% of revenue for most lead operations. This Pareto distribution is not problematic by itself. It is how you manage around it that determines survival.
The Three Vulnerabilities of Concentration
Terms Erosion. A buyer who represents 50% of your revenue knows it. They can demand price reductions, longer return windows, faster delivery requirements, and more generous dispute resolution. You will accept these terms because you cannot afford to lose the volume. Each concession reduces your margin and increases your operational burden.
Payment Risk. If your largest buyer delays payment or fails entirely, the cash flow impact cascades through your entire operation. You cannot pay suppliers, cannot fund traffic, cannot maintain operations. One buyer’s treasury decision becomes your business crisis.
Strategic Dependency. Your product development, operational processes, and team structure optimize around your largest buyer’s requirements. When that buyer changes strategy, churns, or gets acquired, you discover that your entire operation was built around assumptions that no longer apply.
The 25% Rule
No single buyer should represent more than 25% of your revenue. For more conservative practitioners, 20% is a safer ceiling. This is not a target. It is a hard limit that shapes your sales strategy and buyer acceptance decisions.
Building buyer diversification into your business model from launch is essential. Before scaling volume with your first buyer, identify and onboard backup buyers who can absorb that volume if the primary relationship fails. The time to build these relationships is when you have capacity constraints, not when you are desperate for demand.
Price diversification into your economics. If diversification means accepting lower prices from smaller buyers or higher operational costs from managing multiple integrations, build those costs into your business model. The premium you pay for diversification is insurance against catastrophic failure.
Expansion Strategies: Multiplying Buyer Value
Retaining buyers preserves existing value. Expanding buyers multiplies it. Top-performing accounts should receive proportional attention to growth opportunities.
Volume Growth Pathways
Existing buyers with conversion success represent the lowest-risk expansion opportunity. They have validated quality, established operational integration, and demonstrated ability to monetize your leads.
Capacity Assessment. Understand buyer capacity constraints. How many leads can they realistically process? What would it take to increase that capacity? Sometimes growth is blocked by buyer-side limitations you can help address.
Gradual Scaling. Propose incremental volume increases with defined quality thresholds. “Let us add 20% volume for 30 days. If contact rates hold above 70%, we continue scaling.”
Seasonal Optimization. Buyers often have peak periods where additional volume delivers outsized value. Proactive capacity planning for these periods captures expansion opportunity.
Exclusive Upgrade Paths. Buyers purchasing shared leads who succeed can often justify exclusive lead economics. The pricing premium creates expansion revenue while the exclusive arrangement deepens the relationship.
Cross-Selling Additional Products
Cross-selling additional products to existing buyers generates expansion revenue without acquisition cost. The relationship foundation already exists.
Cross-sell identification requires understanding buyer business scope:
- Vertical Adjacencies. An auto insurance buyer might need home insurance leads. A mortgage lender might need personal loan leads.
- Geographic Expansion. Buyers with regional operations expanding nationally need lead coverage to match.
- Product Line Extensions. A buyer purchasing web leads might benefit from call transfers.
- New Use Cases. Your leads might serve buyer needs you have not explicitly marketed.
Approach cross-selling as problem identification, not product pushing. “I noticed you are only buying in three states but your license shows twelve. What is happening in the other nine?” opens conversation without pressure.
Partnership Deepening
The ultimate expansion is transformation from vendor to partner. Partners receive preferential treatment, provide referrals, and survive market disruptions that terminate vendor relationships.
Partnership signals include:
- Strategic planning inclusion (you are consulted on business decisions)
- Joint problem-solving (challenges addressed together)
- Mutual investment (both parties invest beyond contract requirements)
- Executive relationships (decision-makers have direct channels)
- Referral behavior (partners recommend you to peers)
Deepening partnerships requires moving beyond transactional interactions to genuine business alignment. Understand buyer goals beyond lead volume. Align your success metrics with their outcomes. Demonstrate commitment through actions that exceed contractual requirements.
Churn Prediction and Prevention
The most effective retention happens before churn consideration begins. Predictive identification of at-risk buyers enables proactive intervention while relationships remain salvageable.
Warning Signs to Monitor
Buyer churn rarely surprises operators who pay attention. Warning signs typically precede termination by 30 to 90 days. That is ample time for intervention if recognized.
Volume Reduction Patterns. Gradual volume decreases often precede complete termination. A buyer cutting from 500 to 400 to 300 monthly leads is telegraphing departure. Abrupt cuts suggest acute problems. Gradual declines suggest strategic withdrawal.
Payment Behavior Changes. Buyers preparing to exit often slow payments. If a reliable Net-15 payer slips to Net-30, investigate. Payment delays create buffer for disputes and reduce financial exposure in case of termination.
Communication Reduction. Engaged buyers ask questions, provide feedback, and respond promptly. Silent buyers are often disengaged buyers. Declining response rates to your outreach signal relationship weakening.
Complaint Escalation. Increasing complaint frequency or escalation to higher management suggests accumulating frustration. Track complaint trends by buyer to identify deteriorating relationships.
Competitive Mentions. When buyers mention competitor offerings, test alternative pricing, or request capability comparisons, they are actively evaluating alternatives.
Contact Turnover. If your primary buyer contact leaves and no relationship exists with successors, churn probability increases significantly. New contacts lack historical relationship investment.
Intervention Strategies
Once warning signs appear, intervention must be swift and appropriate to severity.
Proactive Outreach. Do not wait for buyers to raise concerns. If metrics suggest problems, initiate contact. “I noticed volume dropped 25% last month. What is happening on your end?” demonstrates attention and opens conversation.
Executive Engagement. For significant accounts showing warning signs, elevate the conversation. Executive attention signals relationship importance and often surfaces issues that operational contacts will not raise.
Root Cause Discovery. Understanding why a buyer is disengaging enables targeted response. Quality problems require operational fixes. Pricing concerns require commercial negotiation. Competitor pressure requires differentiation reinforcement.
Retention Offers. For buyers with churn indicators, consider retention-specific offers: short-term pricing adjustments, enhanced service terms, or pilot programs for new products. The cost of retention offers typically runs far below new buyer acquisition cost.
Operational Excellence in Relationship Management
Building lasting relationships requires systematic operational discipline. The daily rhythms and processes that maintain buyer relationships determine whether your business generates consistent returns or lurches from crisis to crisis.
The Daily Communication Rhythm
Professional operators follow a predictable daily cadence that keeps them ahead of problems:
Morning Performance Review (6:00-8:00 AM). Review overnight delivery reports. Check quality metrics. Identify any issues requiring immediate attention. The first two hours of your day establish whether you are operating proactively or reactively.
Buyer Communication Window (9:00 AM-12:00 PM). Regular contact with buyer partners. Address flagged issues. Gather feedback about lead quality. Strengthen relationships through consistent attention.
Afternoon Optimization (2:00-4:00 PM). Development work on relationship improvements. New buyer integrations. Process improvements. Documentation updates.
End-of-Day Reporting (5:00-6:00 PM). Compile performance reports. Synthesize what happened and why. Set up tomorrow’s success by clearing issues and preparing for scheduled activities.
Quality Monitoring Systems
Real-time quality dashboards should answer one question instantly: “Is anything wrong right now?”
Essential real-time quality metrics include:
- Lead validity rates (passing basic format and data checks)
- Duplicate rates against both internal database and recent submissions
- Contact rates for leads already attempted by buyers
- Return rates from buyer feedback
Design dashboards that show key metrics against their expected ranges, with visual indicators when values exceed thresholds. A conversion rate within normal bounds should be visually neutral. A rate outside normal bounds should demand attention.
Account Health Scoring
Develop an account health score that combines multiple indicators into a single metric. Update the score weekly and use it to prioritize relationship management effort.
Health score components might include:
- Volume trend (growing, stable, declining)
- Payment behavior (early, on-time, late)
- Return rate trend (improving, stable, deteriorating)
- Communication engagement (responsive, moderate, distant)
- NPS or satisfaction score (if measured)
- Expansion activity (cross-selling, upselling)
Weight components based on their predictive value for churn. In most businesses, payment behavior and volume trends carry the highest predictive weight.
Key Takeaways
Building lasting buyer relationships is the foundation of sustainable lead business value. Those who master relationship management build businesses that compound returns over time. Those who neglect it find themselves on a perpetual acquisition treadmill that consumes resources without generating sustainable growth.
The essential principles:
Calculate and optimize for lifetime value, not transaction value. A single buyer relationship can represent $75,000 or more in lifetime value. Investment in retention and expansion pays returns that far exceed acquisition spending.
Retention improvement has exponential returns. Moving from 80% to 90% annual retention doubles your average relationship duration. The math makes retention investment obvious once you understand it.
Recognize the trust degradation timeline. Buyer relationships follow predictable patterns. Early friction in months two and three determines trajectory. Months seven through twelve are decision time. Intervention must happen while relationships are still salvageable.
Master all seven pillars of relationship excellence. Quality consistency, communication excellence, speed and responsiveness, problem resolution, value-added services, relationship depth, and continuous improvement. Excellence in one area cannot compensate for failure in another.
Diversify to survive. No single buyer should represent more than 25% of revenue. Concentration risk kills lead businesses quietly through terms erosion, payment risk, and strategic dependency.
Expand existing relationships before acquiring new ones. Cross-selling, volume growth, and partnership deepening generate higher returns than new buyer acquisition. Invest proportionally in your best accounts.
Build systems for early warning and intervention. Monitor volume trends, payment behavior, communication patterns, and complaint escalation. Intervene at the first signs of relationship degradation, not when termination notices arrive.
Frequently Asked Questions
What is customer lifetime value (LTV) in lead generation and how do I calculate it?
Customer lifetime value in lead generation represents the total gross profit you will generate from a buyer over the entire duration of your relationship. Calculate it using this formula: LTV = (Average Monthly Revenue x Gross Margin %) x (1 / Monthly Churn Rate). For example, a buyer generating $15,000 monthly at 25% gross margin with 5% monthly churn has an LTV of $75,000. This metric helps you understand how much you can invest in acquiring and retaining buyers while remaining profitable.
How much does it cost to acquire a new buyer compared to retaining an existing one?
Industry data consistently shows that acquiring a new B2B customer costs five to seven times more than retaining an existing one. In lead generation specifically, where buyer acquisition involves technical integrations, compliance verification, and relationship building that can span weeks or months, the ratio often skews even higher. A 5% improvement in buyer retention can boost revenue by 25% to 95% over time, making retention investment significantly more efficient than pure acquisition focus.
What are the warning signs that a buyer relationship is deteriorating?
Key warning signs typically appear 30 to 90 days before termination and include: gradual volume reductions (cutting from 500 to 400 to 300 monthly leads), payment behavior changes (reliable Net-15 payers slipping to Net-30), decreased communication responsiveness, increased complaint frequency or escalation to higher management, mentions of competitor offerings, and contact turnover without proper relationship handoff. Monitor these indicators systematically to enable intervention while relationships remain salvageable.
What percentage of revenue should any single buyer represent?
No single buyer should represent more than 25% of your revenue. For more conservative practitioners, 20% is a safer ceiling. Concentration risk creates three fatal vulnerabilities: terms erosion (buyers who know their leverage demand concessions), payment risk (one buyer’s treasury decision becomes your business crisis), and strategic dependency (your operations optimize around assumptions that may suddenly change). Build buyer diversification into your business model from launch.
How do I calculate the appropriate price for leads based on buyer economics?
Value-based pricing starts with the buyer’s economics, not your costs. Consider their customer lifetime value, close rate, and cost to work a lead. For example, if a buyer’s customer LTV is $1,200, their close rate is 8%, and their contact costs are $12, the expected revenue per lead is $96 minus $12, leaving $84 in available value. At 50% value capture, the achievable price is $42. This approach ensures sustainable economics for both parties rather than arbitrary cost-plus margins.
What return policy terms are reasonable for lead generation agreements?
Reasonable return policies should clearly specify acceptable reasons (invalid contact information, duplicate leads within defined windows, filter criteria mismatch, geographic errors), time windows (typically 7 to 14 days for insurance, 5 to 10 days for mortgage, 3 to 7 days for legal), required evidence, and dispute resolution procedures. Reject returns for no contact after reasonable attempts, failure to convert, consumer misrepresentation, or changed circumstances after submission. Document everything clearly to prevent disputes.
How often should I communicate with buyers to maintain healthy relationships?
Effective communication operates at multiple frequencies: daily or weekly operational updates (delivery confirmation, quality metrics, issue flags), monthly business reviews (performance trends, upcoming changes, strategic alignment), quarterly strategic discussions (market conditions, business evolution, partnership opportunities), and real-time issue escalation when problems occur. The principle is to over-communicate during problems and maintain steady cadence during stability. Buyers who feel informed tolerate more operational friction than those who feel ignored.
What metrics should I track to monitor buyer relationship health?
Develop an account health score combining: volume trend (growing, stable, or declining), payment behavior (early, on-time, or late), return rate trend (improving, stable, or deteriorating), communication engagement (responsive, moderate, or distant), satisfaction scores if measured, and expansion activity (cross-selling, upselling). Weight components based on predictive value for churn. In most businesses, payment behavior and volume trends carry the highest predictive weight. Update scores weekly and prioritize relationship management effort accordingly.
How do I expand revenue from existing buyer relationships?
Expansion strategies include volume growth (gradual scaling with quality thresholds), geographic expansion (supporting buyers as they enter new territories), product cross-selling (additional lead types, call transfers, exclusive upgrades), and partnership deepening (becoming involved in strategic planning, joint problem-solving, and executive relationships). Approach cross-selling as problem identification rather than product pushing. Buyers who succeed with your current products are the lowest-risk expansion opportunity.
What should I do when I detect early warning signs of buyer churn?
Immediate intervention is essential. Initiate proactive outreach rather than waiting for buyers to raise concerns. For significant accounts, elevate the conversation to executive level to signal relationship importance. Conduct root cause discovery to understand whether the issue is quality (requiring operational fixes), pricing (requiring commercial negotiation), or competitor pressure (requiring differentiation reinforcement). Consider retention-specific offers such as short-term pricing adjustments, enhanced service terms, or pilot programs. The cost of retention offers typically runs far below new buyer acquisition cost.
Sources
- Harvard Business Review: The Value of Keeping the Right Customers - Research on customer retention economics showing retention improvement drives 25-95% revenue increases
- Bain & Company: Retaining Customers Is the Real Challenge - Foundational research on customer retention ROI and the 5x-7x cost differential between acquisition and retention
- Salesforce State of the Connected Customer - Research on B2B customer experience expectations and communication preferences
- Investopedia: Churn Rate - Definition and calculation methodology for customer churn rate metrics
Statistics and regulatory information current as of late 2025. Buyer economics, retention benchmarks, and relationship management best practices evolve continuously. Validate current conditions before making significant business decisions.