Master the financial discipline that separates surviving lead generation operations from failed ones. Learn working capital requirements, forecasting frameworks, and funding strategies that keep your business solvent while scaling.
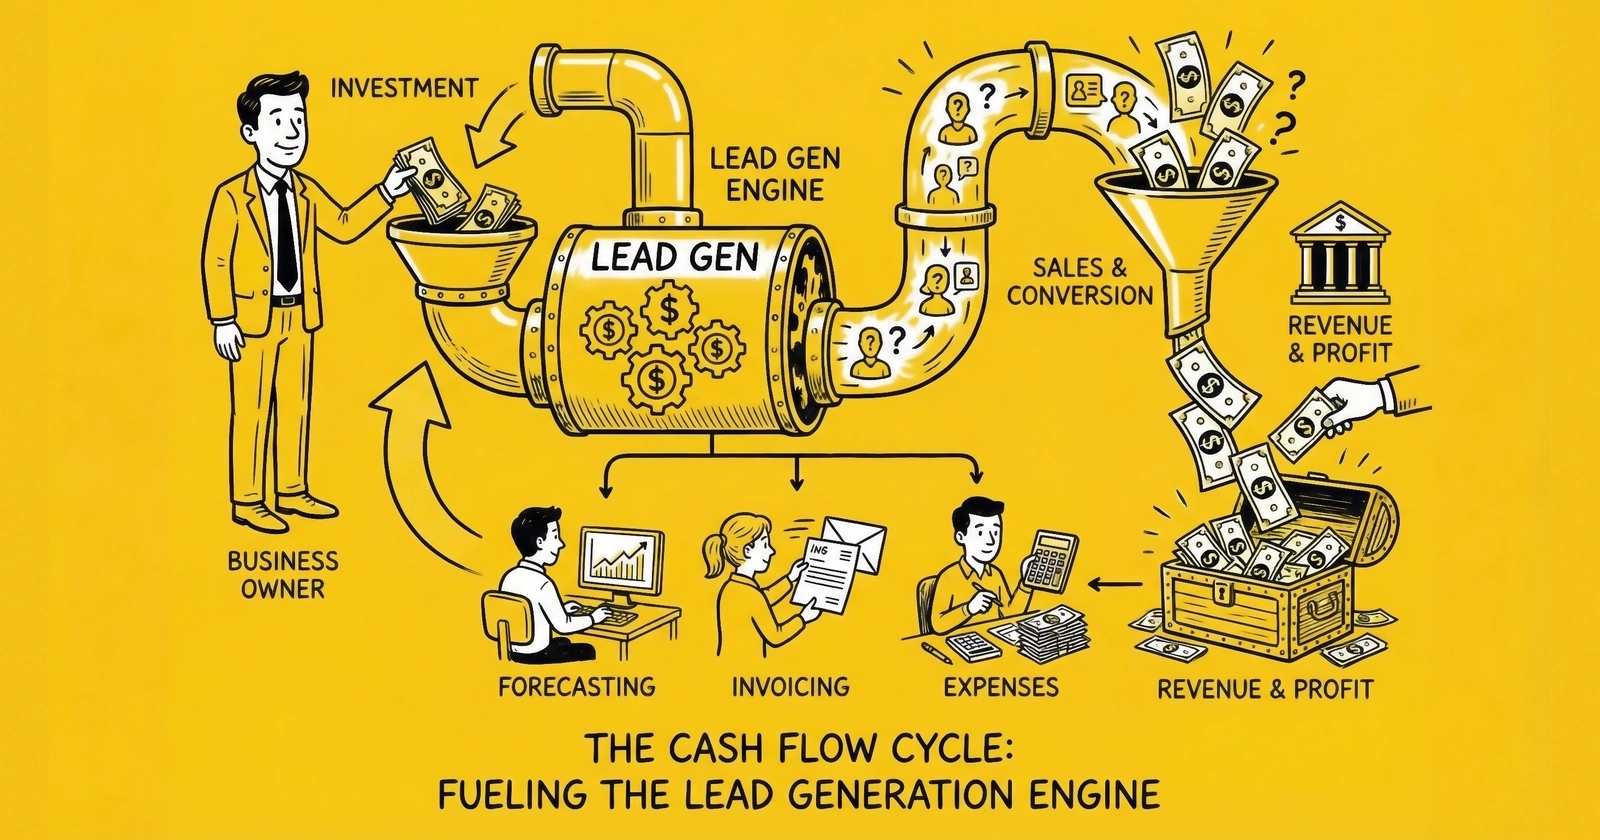
Cash is the oxygen of a lead generation business. Not revenue. Not profit. Cash.
This distinction kills operators every year. They show profitable P&Ls while their bank accounts hemorrhage toward zero. They sign bigger buyer contracts while making increasingly desperate calls to factoring companies. They celebrate record months while quietly missing payroll.
The problem is structural. The lead generation industry operates on a fundamental timing mismatch – what veterans call the 60-day float rule – that makes cash flow management more critical here than in almost any other business model. You pay for traffic today. You collect from buyers in thirty, forty-five, or sixty days. Every dollar of growth widens that gap. Scale becomes a cash trap for the underprepared.
According to industry research, approximately 82% of small business failures stem from cash flow problems. In lead generation, with its structural payment timing mismatches and capital intensity, the risks are amplified. The businesses that survive understand one truth: profitable operations can still fail if they run out of cash before collections arrive.
This guide gives you the frameworks to survive and thrive. The math is unforgiving, but the solutions are knowable.
Understanding the Cash Flow Challenge in Lead Generation
The lead generation business model creates unique cash flow dynamics that differ fundamentally from most service or product businesses. Understanding these dynamics is the first step toward managing them effectively.
The Structural Timing Mismatch
Lead generation operates on what industry veterans call “the float challenge.” The term refers to the money you must keep floating between when you spend it and when you collect it back.
The fundamental problem is structural. Traffic platforms demand immediate payment. Google charges your credit card daily. Meta bills weekly or as you hit spending thresholds. Native advertising platforms often require prepayment. There is no net-30 from any major advertising platform. You pay before you see a single conversion.
Meanwhile, lead buyers operate on standard accounts payable cycles. Insurance carriers have corporate finance departments that process invoices monthly. Mortgage lenders have established AP systems that don’t bend for lead vendors. Understanding credit and payment terms in lead transactions helps you negotiate better positions. Even buyers who want to pay faster often cannot – their systems are not built for it.
This creates an unavoidable gap: your money goes out immediately, but your revenue comes back in 30 to 60 days.
The Cash Conversion Cycle Timeline
Here is how the typical cash cycle unfolds in a lead generation business:
Day 1: You run a paid search campaign and your credit card gets charged.
Days 3-7: Those clicks convert into leads on your landing pages.
Days 7-14: You deliver those leads to buyers through your distribution system.
Days 30-45: Those buyers process your invoices and issue payment.
Days 45-60: That payment clears into your operating account.
Throughout this entire cycle, you continue to spend on media. Day two’s traffic costs hit your card while day one’s leads have not even been invoiced yet. Day fifteen’s campaigns are running while day one’s payments are still thirty days away from collection.
The result is a 45 to 60-day gap between outflow and inflow. Add time for payment processing, returns, and disputes, and you are looking at a full 60-day float requirement at minimum.
Why This Matters More Than Margin
Consider a concrete scenario. You generate 1,000 leads at $25 cost and sell them at $50, yielding $25,000 gross profit on $50,000 revenue. Your cost structure looks healthy: 50% gross margin, solid contribution to overhead.
But your cash flow tells a different story.
Week 1: You spend $25,000 on traffic. Cash position: negative $25,000.
Weeks 2-3: Leads delivered and invoiced. Cash position: negative $25,000 (no change – invoices are not cash).
Weeks 4-5: Buyer processes invoice. Cash position: negative $25,000 (still waiting).
Week 6: Payment received for $48,000 (after 4% returns). Cash position: positive $23,000.
You made $23,000 in profit, but you needed $25,000 available for six weeks to make it happen. Now multiply this by fifty-two weeks and continuous scaling. The capital requirement becomes enormous.
The 60-Day Float Rule: Calculating Your Working Capital Requirement
The 60-day float rule states: maintain a cash reserve equal to sixty days of operating expenses plus media spend before scaling traffic. This number is not arbitrary – it is derived from the actual cash conversion cycle in lead generation.
The Float Calculation Formula
Calculate your specific float requirement using this formula:
Float Requirement = (Average Daily Spend x Days to Collection) + Return Reserve
Where:
- Average Daily Spend = Total monthly costs divided by 30
- Days to Collection = Weighted average of buyer payment terms plus processing time
- Return Reserve = 10-20% buffer for disputed leads and returns
Example Calculation:
Monthly media spend: $100,000 Monthly operating costs: $30,000 Total monthly spend: $130,000 Daily spend: $4,333
Weighted average collection: 45 days Basic float: $4,333 x 45 = $195,000
Return reserve (15%): $29,250
Total Float Required: $224,250
This represents the minimum cash you need available at all times to maintain operations – before accounting for growth, seasonal variation, or unexpected disruptions.
Working Capital Requirements by Scale
Working capital requirements vary dramatically based on operational scale. Understanding these thresholds helps you plan financing before you hit crisis points.
| Monthly Media Spend | Monthly Lead Volume | Working Capital Needed | Typical Funding Source |
|---|---|---|---|
| Under $50K | 5,000-15,000 leads | $100K-$150K | Personal savings, credit cards |
| $50K-$100K | 15,000-30,000 leads | $150K-$300K | Personal capital plus factoring |
| $100K-$200K | 30,000-60,000 leads | $300K-$600K | Lines of credit, revenue-based financing |
| $200K-$500K | 60,000-150,000 leads | $600K-$1.5M | Bank credit facilities |
| $500K+ | 150,000+ leads | $1.5M-$10M+ | Institutional credit, private equity |
At the micro scale (under $50,000 monthly media spend), you can often self-fund through credit cards with 30-day billing cycles and personal savings. This phase is typically covered in guides on building your first lead generation business. The float requirement is manageable: $100,000 to $150,000 covers most scenarios. Many practitioners bootstrap through this phase. The key constraint is credit card limits rather than cash availability. A solid personal credit profile with $50,000 to $75,000 in available credit across multiple cards can float operations while you establish cash reserves from profits.
At the small scale ($50,000 to $200,000 monthly media spend), personal capital becomes insufficient. You need $300,000 to $600,000 available. This is where operators either find external capital or cap their growth. Most stuck businesses are stuck at this scale – profitable but cash-constrained.
At the medium scale ($200,000 to $500,000 monthly media spend), you need $600,000 to $1.5 million in working capital. Lines of credit become essential. Relationships with factors or banks matter. Your financial infrastructure needs to match your operational sophistication.
At the large scale (over $500,000 monthly media spend), working capital requirements exceed $1.5 million and can reach $10 million or more. Private equity backing, institutional credit facilities, or long-term patient capital become necessary.
Scale Transitions: The Dangerous Moments
The transitions between scales create the most dangerous moments for lead generation businesses. Operations often grow from micro to small organically, then hit a wall.
The capital that worked at $40,000 monthly spend suddenly becomes insufficient at $60,000. Revenue grew 50%, but working capital requirements may have grown 100%. Planning for scale transitions before you hit them is essential.
| Current Scale | Target Scale | Float Increase Needed | Danger Zone Duration |
|---|---|---|---|
| $50K spend | $100K spend | +$150K-$200K | 60-90 days of scaling |
| $100K spend | $200K spend | +$200K-$400K | 90-120 days of scaling |
| $200K spend | $500K spend | +$600K-$1M | 120-180 days of scaling |
A business growing 20% month-over-month – not unusual for a successful lead operation – needs to fund that incremental growth for sixty days before seeing any return. Twenty percent growth on $100,000 monthly media spend means an additional $20,000 in month one that will not return until month three. Then another $24,000 in month two (20% of $120,000), also on sixty-day delay.
By month six, you have invested hundreds of thousands in growth capital that has not cycled back yet. The math creates a paradox: the faster you grow, the more cash you need, even as profitability improves. Success can bankrupt you if you do not plan for it.
Cash Flow Forecasting: Building Your Financial Radar
You cannot manage what you cannot see. Cash flow forecasting transforms reactive panic into proactive planning. The right model reveals problems weeks before they become crises and opportunities before competitors can capture them.
The 13-Week Cash Flow Model
The gold standard for operational cash management is the 13-week cash flow forecast (often called the TWCF – Thirteen-Week Cash Forecast). This model provides weekly granularity over a full quarter – enough detail to catch timing issues, enough duration to see patterns and plan interventions.
The 13-week model has become the industry standard for three reasons. First, it aligns with quarterly business cycles and payment patterns. Second, weekly granularity catches intra-month timing issues that monthly forecasts miss entirely. Third, the rolling nature forces continuous updating rather than annual budgeting theater.
Building your 13-week model requires three components:
- Beginning cash: What is in your accounts today
- Cash inflows: Everything coming in, categorized by timing certainty
- Cash outflows: Everything going out, by category and timing
The output is your projected ending cash position for each of the next thirteen weeks, revealing when you will have surplus and when you will face shortage.
For lead generation businesses, structure your model around these categories:
Cash Inflows:
- Regular buyer payments (by client and payment term)
- Return credits received (your returns to buyers mean their cash comes back to you)
- Prepayments from new buyers
- Other income (interest, refunds, affiliate commissions)
Cash Outflows:
- Media spend (by platform and billing cycle)
- Publisher/affiliate payments
- Payroll and contractor costs
- Technology subscriptions and platforms
- Rent and overhead
- Professional services (legal, accounting)
- Loan payments and credit card obligations
- Tax obligations
The key insight is categorizing by timing certainty. Payroll hits on predictable dates. Media charges follow platform schedules. But buyer payments can vary – categorize them by likelihood based on historical payment behavior for each client.
A well-constructed 13-week model updates weekly. Each Monday, you shift the window forward, add a new week thirteen, and update actuals for the previous week. Over time, this creates variance data that improves your forecasting accuracy.
Scenario Planning: Beyond Single-Point Forecasts
Single-point forecasts create false confidence. Reality contains variance. Effective cash management requires scenario planning across multiple potential futures.
Build three scenarios as your baseline framework.
Base Case: Your expected outcome – normal payment timing, typical returns, planned media spend. This is your operating assumption, built from historical patterns and current commitments.
Stress Case: Negative variance across key inputs. Buyers pay five to ten days slower than normal. Returns run higher than average. A media platform increases CPCs unexpectedly. Model what happens when multiple things go slightly wrong simultaneously.
Crisis Case: Severe disruption. A major buyer delays payment significantly or becomes unable to pay. A traffic source gets shut down, forcing expensive pivots. Returns spike above normal ranges. This scenario identifies your true “floor” and reveals how quickly you would burn through reserves.
The discipline is not just building these scenarios – it is monitoring which one reality is tracking toward. Weekly variance analysis tells you whether you are trending toward base, stress, or crisis, giving you time to adjust before problems compound.
Early Warning Indicators
The best cash management is preventive. Establish early warning indicators that trigger action before problems manifest fully. These metrics serve as your financial radar – detecting storms before they arrive.
| Indicator | Yellow Warning | Red Alert |
|---|---|---|
| DSO Trend | +3 days vs. baseline | +7 days vs. baseline |
| Buyer Payment Stretch | 1-2 buyers past terms | 3+ buyers past terms |
| Credit Utilization | Above 75% | Above 90% |
| Return Rate | +2% vs. baseline | +5% vs. baseline |
| Cash Reserve | Below 45-day cover | Below 30-day cover |
Monitor Days Sales Outstanding (DSO) weekly, not monthly. If your trailing DSO creeps up even slightly – from 42 days to 45 days over several weeks – you are seeing the leading edge of a collection problem. Investigate before it compounds. Calculate DSO using a 13-week rolling average for stability: (Average Accounts Receivable / Revenue) x 91 days. Plot this weekly on a trend chart. Any consistent upward movement over four or more weeks warrants investigation.
Track buyer payment behavior individually. A single buyer stretching from net-30 to net-40 matters. A pattern of multiple buyers stretching simultaneously signals either your collection process or broader market conditions need attention. Create a simple tracking system that flags any payment more than seven days past terms. Review flagged accounts weekly and initiate collection calls at day eight, not day forty-five.
Watch media platform credit utilization. If you are consistently pushing against credit limits, you have less buffer than you think. Unexpected charges or billing cycle changes can create problems faster than you can solve them. Target utilizing no more than 75% of available credit under normal operations, leaving 25% as emergency buffer.
Monitor return rates by buyer and by source. Rising returns indicate quality problems that will affect both revenue and cash. Early detection allows source adjustment before cash impact compounds. Establish baseline return rates by buyer and traffic source. Any source exceeding its baseline by more than two percentage points for two consecutive weeks needs immediate attention.
When any indicator hits yellow, investigate immediately but do not panic. When any indicator hits red, convene your financial team (even if that is just you and your accountant) to develop an action plan. When two or more indicators hit yellow simultaneously, treat it as a red alert – correlated problems compound faster than isolated ones.
Working Capital Optimization Strategies
Understanding the float challenge and forecasting cash needs are necessary but insufficient. You need active strategies to optimize working capital – reducing the cash tied up in operations while maintaining business capability.
Accelerating Buyer Payments
The most direct lever for improving cash position is getting paid faster by your buyers.
Offer early payment discounts. A 2% discount for payment in fifteen days rather than forty-five might seem expensive, but calculate the effective annual percentage rate. If you are paying 12% to 24% annually for working capital, 2% for thirty days of acceleration is economically superior. Many corporate buyers have treasury functions seeking early payment discount opportunities to deploy excess cash.
Net-15 vs. Net-30 vs. Net-45 Impact:
| Payment Terms | Float Days Saved vs. Net-45 | Cash Freed per $100K Revenue |
|---|---|---|
| Net-15 | 30 days | $100,000 (full cycle faster) |
| Net-30 | 15 days | $50,000 |
| Net-45 | 0 days | $0 (baseline) |
Require deposits from new buyers. Until a buyer establishes payment history, require 25% to 50% prepayment. Position this as standard onboarding procedure rather than distrust. You are extending them credit – deposits are normal commercial practice.
Negotiate shorter standard terms with reliable buyers. If a buyer has paid on time for twelve months, propose moving from net-45 to net-30 in exchange for volume commitment or modest price discount. The working capital benefit often exceeds the price concession.
Create prepayment incentives. Offer buyers 3-5% discount for quarterly prepayment. You receive cash now; they lock in favorable pricing.
Implement deposit structures for premium products. For exclusive leads or premium verticals, require deposits that reduce float exposure.
Extending Supplier Payment Terms
On the vendor side, extending payment terms provides the opposite benefit – more cash available longer.
Negotiate extended terms with publishers and affiliates. Move from net-7 to net-15 or net-30 where possible. Every day of extension reduces your float requirement.
Use credit cards strategically. A business credit card with thirty-day billing plus twenty-five-day grace period gives you fifty-five days of float on purchases. This is interest-free float if you pay in full. Apply this to technology subscriptions, professional services, and any other expenses that accept card payment.
Negotiate quarterly payments for fixed expenses. Landlords, some technology platforms, and professional services may prefer predictable quarterly payments. Negotiate these terms where they improve your cash position.
Most technology platforms require prepayment or short terms, but professional services (accounting, legal, consulting) often accept net-30 or net-45. Negotiate these terms explicitly.
The goal is asymmetry: collect as fast as possible, pay as slow as reasonable. Every day you shift in your favor reduces working capital requirements.
Float Cost: The Hidden P&L Line Item
Float is not free. The capital tied up in your cash conversion cycle has a cost, whether you are using your own money (opportunity cost) or borrowed money (interest cost).
Calculating Your Float Cost:
Monthly Float Cost = Average Receivables x (Annual Cost of Capital / 12)
Example: Average receivables: $300,000 Annual cost of capital: 12% (line of credit rate) Monthly float cost: $300,000 x (0.12 / 12) = $3,000/month
That is $36,000 annually – pure cost of doing business that most practitioners never account for in their unit economics.
Float Cost by Financing Method:
| Financing Source | Approximate Annual Rate | Float Cost per $100K |
|---|---|---|
| Credit cards (carrying balance) | 18-26% | $18,000-$26,000 |
| Factoring | 15-36% (effective) | $15,000-$36,000 |
| Revenue-based financing | 25-45% (effective) | $25,000-$45,000 |
| Bank line of credit | 8-15% | $8,000-$15,000 |
| SBA-backed line | 10-13% | $10,000-$13,000 |
| Personal capital (opportunity cost) | 8-12% | $8,000-$12,000 |
most practitioners calculate unit economics as: Revenue per lead - Cost per lead = Gross margin. But true unit economics must include float cost.
For a business with $300,000 average receivables generating 10,000 leads monthly at 12% annual capital cost:
Float cost per lead: $3,000 monthly cost / 10,000 leads = $0.30 per lead
On a lead with $5 gross margin, that $0.30 represents 6% margin erosion. At higher capital costs or longer collection cycles, this erosion increases significantly.
Financing Options for Lead Generation Businesses
When self-funding proves insufficient, several external capital sources exist for lead generation businesses. Each has distinct advantages, costs, and qualification requirements.
Factoring: Converting Receivables to Cash
Invoice factoring converts accounts receivable into immediate cash by selling your invoices to a factoring company at a discount. For lead generation businesses with solid buyer creditworthiness, factoring can solve cash flow problems without traditional debt.
How Factoring Works: You generate leads and invoice buyers. Rather than waiting thirty to sixty days for payment, you sell that invoice to a factor for typically 85% to 93% of face value immediately. The factor collects from your buyer. When payment arrives, you receive the remaining balance minus the factor’s fee, usually 1% to 5% of invoice value depending on how quickly your buyer pays.
Advantages for Lead Generation:
- Factoring is not debt – it does not create leverage on your balance sheet
- Approval depends on your buyers’ creditworthiness, not yours, making it accessible for younger businesses with limited credit history
- Funding scales automatically with revenue; the more you sell, the more you can factor
- Speed of setup is typically faster than bank credit facilities
Disadvantages:
- Factoring is expensive compared to traditional credit. A 3% fee for forty-five-day acceleration equals roughly 24% annualized
- You cede some control over buyer relationships, as factors may contact buyers directly during collection
- Some buyers view factoring negatively, though this stigma has decreased substantially
When Factoring Makes Sense:
- Growth opportunity exceeds factoring cost
- Buyer creditworthiness is strong (reducing factor fees)
- Your own credit profile limits traditional financing options
- You need capital flexibility rather than fixed debt
When Factoring Makes Less Sense:
- Margins are thin (factoring fees consume too much profit)
- Buyers are smaller or less creditworthy (factors charge premium rates)
- You have access to cheaper capital through lines of credit or investors
If you pursue factoring, compare multiple factors on advance rate (percentage paid immediately), fee structure (monthly percentage or flat fee), recourse terms (whether you are liable if the buyer does not pay), and notification requirements (whether buyers are informed of factoring arrangement).
Lines of Credit
A business line of credit provides flexible access to capital without the lumpiness of term loans. You draw when needed, repay when collected, and pay interest only on outstanding balances. For managing cash flow timing in lead generation, lines of credit are often the optimal financing tool.
Current Rate Environment (Late 2025):
- Bank lines for well-qualified borrowers: Prime plus 1.75% to Prime plus 9.75% (roughly 9.25% to 17.25% with Prime at 7.5%)
- Online lenders offering more flexible qualification: 20% to 35% APR or higher
- SBA-backed lines: Starting around 10.5% to 13% for qualified borrowers
Qualification Requirements:
- At least two years in business (some lenders accept one year)
- Annual revenue above $100,000 to $250,000 depending on lender
- Credit scores above 650 (above 700 for best rates)
- Demonstrated positive cash flow or profitability
- Clean business and personal credit history
The right line of credit size depends on your float requirement. A line covering sixty to ninety days of operating expenses provides meaningful flexibility without unnecessary interest burden. Unused lines do not cost much (modest annual fees), but oversized lines may signal desperation to future lenders.
Using a Line of Credit Effectively:
- Draw to cover timing mismatches, not operating losses
- Maintain utilization below 50% if possible to preserve credit profile
- Repay aggressively when collections arrive rather than letting balances accumulate
- Monitor line covenants carefully – violating financial ratios can trigger default
A $250,000 line of credit at 12% APR costs $2,500 monthly if fully drawn – expensive if used continuously, but reasonable insurance against timing crunches. The key is using lines as bridges, not as permanent funding.
Revenue-Based Financing
Revenue-based financing (RBF) provides capital in exchange for a percentage of monthly revenue until a fixed multiple is repaid. For example, receive $200,000 and repay $260,000 over twelve to eighteen months via 10% of monthly revenue.
Advantages:
- No equity dilution
- Flexible payment that scales with revenue
- Faster approval than traditional lending
- No personal guarantee in some cases
Disadvantages:
- Effectively high APRs (30% to 60% when calculated)
- Revenue encumbrance reduces operating flexibility
- Automatic revenue deduction can strain tight months
RBF works best for businesses with strong, predictable revenue seeking bridge capital without dilution. The cost is high, but the flexibility and speed can be worth it for the right situation.
Reserve Management Strategy
Beyond active financing tools, maintaining cash reserves provides the ultimate buffer against uncertainty. Reserve management is about determining how much cash to hold in low-yield accounts rather than deploying for growth.
A tiered reserve approach provides structured protection:
Operating Reserve (Tier 1): One month of expenses including media – sits in your primary operating account for immediate access. This is your working cash for day-to-day operations. Never touch this for investments or non-critical expenses.
Contingency Reserve (Tier 2): One to two additional months – sits in a high-yield savings account, accessible within one to two days. This covers unexpected shortfalls, buyer payment delays, or temporary traffic cost spikes.
Strategic Reserve (Tier 3): One to three additional months – can sit in slightly less liquid instruments like money market funds or short-term CDs. This covers major disruptions: losing a significant buyer, platform bans requiring complete traffic pivots, or economic downturns affecting your verticals.
The total reserve target ranges from three months (stable business, diversified buyers, conservative growth) to six months (volatile traffic costs, concentrated buyers, aggressive scaling). Proper lead source diversification reduces the need for larger reserves. Calculate your target based on worst-case scenario planning: how long could you operate at zero new collections while meeting all obligations?
Growth Financing Decisions
Understanding working capital management keeps you alive. Growth financing determines how big you can become. The funding decisions you make shape your business’s trajectory for years.
Self-Funded Growth Limits
Every business has a natural growth rate supportable by internal cash generation. Exceeding this rate requires external capital. Understanding your self-funded ceiling helps you make intentional decisions about growth pace and financing.
Calculating Your Sustainable Growth Rate:
Start with your net profit margin (example: 15% after all costs). Multiply by your asset turnover – how many dollars of revenue you generate per dollar of working capital (example: 4x, meaning $4 revenue per $1 of working capital). Your sustainable growth rate equals roughly 60% (15% x 4). You can grow 60% annually while maintaining current debt and equity levels.
This calculation reveals why profitable lead generation businesses still need external capital for fast growth. Even at strong margins and efficient capital use, doubling annually exceeds self-funding capacity. The business generates cash, but not fast enough to fund 100% growth.
Self-Funded Growth Works When:
- You are content with moderate expansion (20% to 40% annually)
- You prioritize independence over speed
- Market conditions allow gradual share capture
- Your personal risk tolerance favors lower leverage
Self-Funded Growth Limits You When:
- Competitors are scaling faster with external capital
- Market windows are closing (regulatory changes, platform shifts)
- Operational leverage creates winner-take-most dynamics
- Your opportunity cost of slow growth exceeds financing costs
Growth Pacing Decisions
The most important financing decision is not how to fund growth but how fast to grow. Growth pacing balances opportunity capture against risk accumulation.
Conservative Pacing (20-30% Annual Growth) Maintains financial flexibility, reduces external capital dependency, allows gradual team and process scaling, and provides runway to recover from mistakes. Risk: competitive displacement by faster-moving operators.
Moderate Pacing (30-50% Annual Growth) Represents the most common successful path – fast enough to matter, slow enough to manage. Most lead generation businesses that achieve sustainable scale followed this trajectory.
Aggressive Pacing (50-100%+ Annual Growth) Captures market share before competitors, builds scale advantages in technology and buyer relationships, attracts talent excited by rapid expansion, and can create exit-enabling trajectory. Risk: operational breakdown, cash crisis, or quality collapse that destroys the business.
When choosing your pace, consider market dynamics, operational readiness, and risk tolerance. Can your team handle doubled volume? Can your technology scale? Can your quality control processes maintain standards at higher throughput?
One principle holds universally: underfunded aggressive growth destroys more lead generation businesses than conservative growth ever did. If you are going to scale fast, ensure your capital base supports it. Slow growth with solid financials beats fast growth that ends in failure.
The Cash Flow Mindset: Daily Discipline
Cash flow management is not a monthly task – it is a daily discipline. Those who build sustainable lead generation businesses obsess over cash the way pilots obsess over altitude. They know their numbers. They see problems coming. They act before crisis forces action.
The Weekly Cash Review
Implement a non-negotiable weekly cash review. Every Monday morning (or whichever day works for your business rhythm), spend thirty to sixty minutes reviewing:
- Current cash position across all accounts
- Aged receivables with special attention to anything past terms
- Upcoming obligations for the next two weeks
- 13-week forecast updates with variance from last week
- Early warning indicators against established thresholds
This discipline catches problems when they are small and solvable. A buyer who stretched payment by five days in week one becomes concerning. The same pattern in week three becomes urgent. By week six, you are in crisis. Weekly review ensures you see trends, not surprises.
Cash Flow Reality Check Questions
Ask yourself these questions weekly:
- Do I know my exact cash position right now, without checking?
- Can I name my three largest pending receivables and their expected collection dates?
- Do I know how many days of runway I have at current burn?
- Have I reviewed my 13-week forecast in the last seven days?
If you cannot answer all four with confidence, your cash management discipline needs work.
Building Cash Flow Infrastructure
Effective cash flow management requires infrastructure, not just intention:
Accounting and Reporting:
- Weekly cash reporting (not just monthly financial statements)
- Aged receivables report updated daily
- Payment term tracking by buyer
- Source-level profitability including timing impacts
Relationship Management:
- Designated contact at each major buyer for payment questions
- Established escalation procedures for late payments
- Documented credit limits for each buyer
- Regular credit review process
Financing Relationships:
- Established line of credit (even if unused)
- Relationship with at least one factoring company
- Understanding of emergency capital options
- Regular (quarterly) check-ins with financial partners
Frequently Asked Questions
What is float in lead generation and why does it matter?
Float is the working capital required to bridge the gap between when you pay for leads (or traffic to generate leads) and when buyers pay you for those leads. In lead generation, you typically pay traffic platforms immediately and publishers within 7-15 days, but buyers pay you in 30-60 days. This 45-60 day gap multiplied by your daily cash outflow equals your float requirement. Float matters because it determines how much capital you need to operate and whether your business can survive the timing mismatch inherent in the industry.
Why do profitable lead generation businesses still fail?
Profitable lead businesses fail because profit and cash are not the same thing. You can show positive margins on your P&L while your bank account drains to zero. The structural timing mismatch – paying for traffic immediately while collecting from buyers in 30-60 days – means every dollar of growth consumes cash before it returns profit. A business growing 20% monthly needs to fund two months of that incremental growth before seeing any return. Without adequate working capital, growth literally bankrupts profitable operations.
How much working capital do I need for my lead generation business?
Working capital requirements depend on your monthly media spend and payment terms. For under $50K monthly spend, expect to need $100K-$150K. For $100K-$200K monthly spend, you need $300K-$600K. For $200K-$500K monthly spend, plan for $600K-$1.5M. The formula is: (Average Daily Spend x Days to Collection) plus a 15% buffer for returns. At 45-day average collection on $100K monthly spend, basic float is approximately $150K, plus $22.5K return buffer equals $172.5K minimum.
What is a 13-week cash flow forecast and how do I build one?
A 13-week cash flow forecast is a rolling weekly projection of your cash position over the next quarter. Start with current cash position. Project inflows by client and payment timing certainty (categorize buyers as reliable, variable, or at-risk). Project outflows by category and billing date. Calculate ending cash for each of the next 13 weeks. Update weekly by adding a new week 13, recording actuals, and adjusting projections. Build three scenarios (base, stress, crisis) to understand your vulnerability range. The 13-week model catches timing issues that monthly forecasts miss entirely.
Should I use factoring or a line of credit for working capital?
The choice depends on your situation. Factoring converts invoices to immediate cash at 85-93% of value, with fees of 1-5% (effectively 15-36% annually). It is faster to establish, scales with revenue, and depends on buyer creditworthiness rather than yours. Lines of credit offer lower rates (8-15% for well-qualified borrowers) but require established business history, positive cash flow, and good credit. If you have strong credit and two or more years in business, a line of credit is cheaper. If you need capital quickly, lack credit history, or have very creditworthy buyers, factoring may be better despite higher cost.
How do I improve my Days Sales Outstanding (DSO)?
Improve DSO through aggressive collections and smart terms. Offer 2% discount for net-15 payment versus net-45 – this accelerates cash at lower cost than most financing. Require 25-50% deposits from new buyers until they establish payment history. Track buyer payment behavior individually and call at day 8 past terms, not day 45. Negotiate shorter standard terms with reliable long-term buyers. For buyers who consistently pay late, either enforce terms (including pausing service) or adjust pricing to compensate for the float cost they impose.
What are the warning signs of a cash flow crisis?
Warning signs include: DSO increasing more than 3 days versus baseline, multiple buyers paying late simultaneously, credit utilization above 75% of limits, return rates spiking above normal, cash reserves falling below 45 days of operating expenses, and accounts payable aging because you are stretching your own payments. Monitor these weekly. When any indicator hits warning levels, investigate immediately. When multiple indicators correlate, treat it as urgent – problems compound faster than isolated issues.
How does growth affect cash flow requirements?
Growth accelerates cash consumption faster than it accelerates profit. A business growing 20% month-over-month needs to fund that incremental growth for sixty days before seeing any return. If you grow from $100K to $120K monthly spend, you need $120K additional float immediately, but that $120K will not return for 60 days. By month six of continuous 20% growth, you have invested hundreds of thousands in growth capital still circulating. The paradox: success creates cash pressure. The solution: secure financing capacity before you need it, and pace growth to match capital availability.
What is the cost of float and how do I calculate it?
Float cost is the expense of capital tied up in your cash conversion cycle. Calculate it as: Average Receivables x (Annual Cost of Capital / 12) = Monthly Float Cost. For example, $300K average receivables at 12% annual cost of capital equals $3,000 monthly or $36,000 annually. This cost should be included in your unit economics. At 10,000 leads monthly, that $3,000 adds $0.30 per lead to your true cost. On thin-margin leads, this hidden cost can eliminate or reverse apparent profitability.
How do I manage cash flow when buyers are late paying?
For late-paying buyers, implement a structured escalation. At day 1 past terms, send automated reminder. At day 7, make personal call to your contact. At day 14, escalate to buyer’s management and pause new lead delivery. At day 21, send formal demand letter and withhold service completely. At day 30, engage collections process. Document everything. Meanwhile, protect yourself structurally: require deposits from new buyers, negotiate shorter terms when possible, and maintain enough credit facility to absorb late payments without operational impact. Chronic late-payers should either pay premium pricing (to compensate for float cost) or lose access to your leads.
What financing options are available specifically for lead generation companies?
Lead generation companies can access several financing options. Invoice factoring (85-93% advance rate, 1-5% fees, based on buyer creditworthiness). Revenue-based financing (receive lump sum, repay via percentage of monthly revenue at 25-45% effective APR). Business lines of credit from banks (8-15% for qualified borrowers with 2+ years history). SBA-backed lines (10-13%, requires SBA qualification). Online alternative lenders (20-35%+, faster approval, lower requirements). Venture debt (for funded startups). Strategic investment from buyers seeking supply security. The right choice depends on your credit profile, business history, margin tolerance for financing cost, and how quickly you need capital.
Key Takeaways
-
The 60-day float requirement is not negotiable. Maintain cash reserves equal to sixty days of operating expenses plus media spend before scaling traffic. This is survival math, not conservative planning.
-
Payment timing mismatches are structural. Traffic platforms demand immediate payment while buyers operate on net-30 to net-45 cycles. This gap cannot be negotiated away – only funded or compressed.
-
Growth accelerates cash consumption, not profit. Every incremental dollar of traffic spend widens the gap between when you pay and when you collect. Success can bankrupt you without adequate capital.
-
Float has a real cost. Capital tied up in receivables costs 8-24% annually depending on your funding source. Include this cost in your unit economics or your true margins are lower than you think.
-
Working capital scales dramatically with volume. Under $50K monthly spend needs $100K-$150K reserves. $500K+ monthly spend requires $1.5M-$10M+ in working capital. Plan financing before reaching transition points.
-
The 13-week cash flow forecast is essential infrastructure. Weekly updates catch timing issues that monthly forecasts miss entirely. Build three scenarios (base, stress, crisis) to understand your true vulnerability.
-
Accelerate collections, extend payables. Every day shifted in your favor reduces float requirements. A 2% early payment discount is cheaper than 12%+ annual capital cost.
-
Build credit facilities before you need them. The time to establish financing relationships is when your business is healthy, not when you are in crisis. Lenders can detect desperation.
-
Cash flow management is daily discipline. Those who build sustainable lead generation businesses obsess over cash the way pilots obsess over altitude. They know their numbers. They see problems coming. They act before crisis forces action.
Sources
-
Investopedia: Cash Conversion Cycle - Explains the cash conversion cycle concept referenced throughout this article, including how to calculate the time between cash outflow and collection.
-
Corporate Finance Institute: Days Sales Outstanding - Provides the DSO calculation methodology and benchmarks for tracking collection efficiency.
-
Investopedia: Days Sales Outstanding (DSO) - Defines DSO metrics and explains how to monitor accounts receivable performance.
-
Investopedia: Working Capital - Covers working capital requirements and the relationship between current assets and liabilities.
-
U.S. Small Business Administration: 7(a) Loans - Details SBA-backed credit facilities mentioned as a financing option for lead generation businesses.
-
SCORE - SBA resource partner providing cash flow management guidance and small business financial planning resources.
-
Federal Reserve Small Business Credit Survey - Research on small business financing trends, credit access, and working capital challenges.
Statistics and financial benchmarks current as of late 2025. Specific rates, terms, and market conditions change continuously – verify current data before making financing decisions. This guide provides educational information about cash flow management; consult with qualified financial professionals for advice specific to your situation.