Market cycles determine everything in insurance lead generation. This guide explains how hard and soft markets reshape lead pricing, carrier appetite, and strategic positioning so you can thrive regardless of where we are in the cycle.
The insurance lead business you built in 2021 may not survive 2026 if you operate the same way. That is not a threat. It is market reality.
Between 2022 and 2024, the property and casualty insurance industry experienced whiplash that fundamentally reshaped lead generation economics. Carriers that spent aggressively on customer acquisition suddenly pulled back. Lead prices that seemed locked in place for years compressed 30-40% almost overnight. Publishers who had grown comfortable with stable demand found themselves scrambling for buyers. Then, just as quickly, the market reversed. Progressive nearly tripled its advertising spend in a single year. MediaAlpha reported 123% revenue growth. The feast-or-famine nature of carrier advertising became impossible to ignore.
Understanding insurance market cycles is not optional for serious lead generation operators. These cycles determine demand, pricing, buyer behavior, and competitive dynamics. Practitioners who recognize where they are in the cycle can position appropriately. Those who assume current conditions will continue forever get crushed when conditions change.
This guide provides the strategic framework you need to operate successfully during both hard and soft insurance markets. You will understand what drives these cycles, how they affect lead economics, and what tactical adjustments separate survivors from casualties when the market shifts.
Understanding Insurance Market Cycles
The insurance industry operates on predictable cycles that drive every aspect of lead generation economics. Before diving into lead-specific strategy, you need to understand the underlying dynamics that create these cycles.
What Defines Hard and Soft Markets
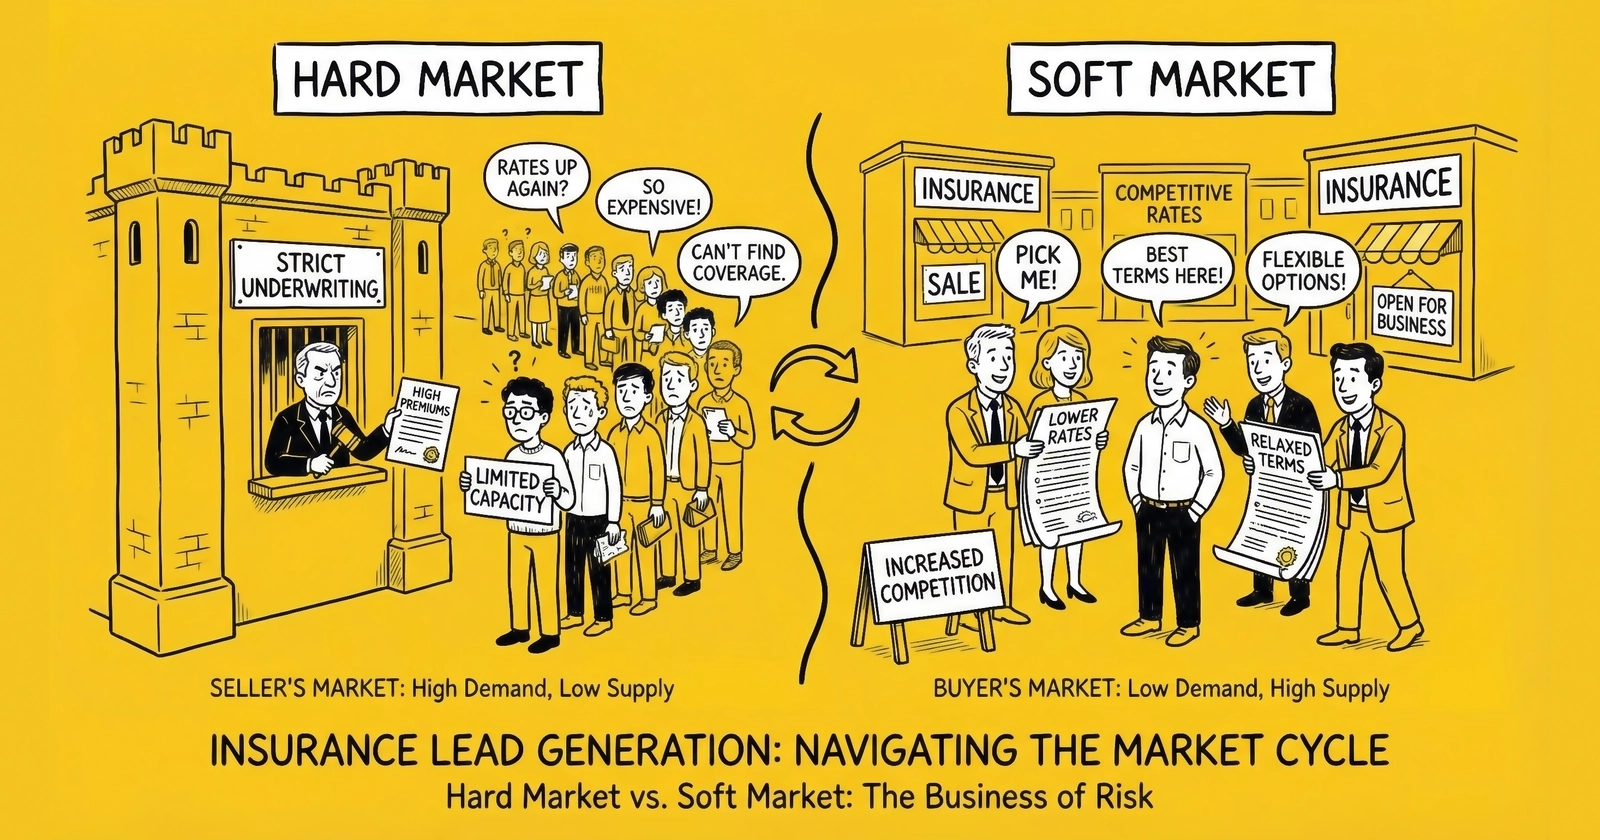
Insurance markets exist on a spectrum between “hard” and “soft” conditions, with most periods falling somewhere between the extremes.
Soft Market Conditions
Soft markets occur when carriers are profitable, competitive, and actively seeking growth. During these periods, carriers compete aggressively for new business, expanding advertising budgets substantially to fuel customer acquisition. Underwriting standards relax as carriers chase volume, which means premiums stabilize or even decrease for consumers. For lead generators, soft markets translate directly to rising lead prices because increased buyer demand creates competition for inventory.
Hard Market Conditions
Hard markets occur when carriers face profitability pressure from claims losses, forcing them to prioritize underwriting discipline over growth. Carriers restrict new business acquisition and contract advertising budgets, sometimes dramatically. Lead demand decreases as carriers focus on rate adequacy rather than volume growth. Underwriting standards tighten as carriers become selective about which risks they write. Consumers face substantially higher premiums, while lead generators experience price compression due to reduced buyer demand.
The terminology can seem counterintuitive. A “hard” market is hard for consumers (higher prices, stricter underwriting) but can also be hard for lead generators (reduced demand, lower prices). A “soft” market is soft for consumers (competitive prices, easier qualification) and typically creates better conditions for lead generators (strong demand, higher prices).
The Underwriting Cycle Driver
Insurance market cycles are fundamentally driven by underwriting results. When carriers make money on policies, they invest in growth. When they lose money on policies, they cut back.
The key metric is the combined ratio, which measures total claims and expenses as a percentage of premium collected. A combined ratio below 100% indicates underwriting profit, while a combined ratio above 100% indicates underwriting loss.
When the industry-wide combined ratio trends below 100%, carriers become aggressive. They have profitable products and capacity for growth. Advertising expands. Lead demand increases. Prices rise.
When the industry-wide combined ratio trends above 100%, carriers become conservative. They are losing money on existing business and cannot justify acquiring more unprofitable customers. Advertising contracts. Lead demand decreases. Prices compress.
The auto insurance industry experienced this dynamic acutely during 2022-2024:
2022-2023: Severe underwriting losses due to claims inflation (higher repair costs, more expensive vehicles, medical cost increases). Industry combined ratios exceeded 100% across most carriers. Advertising budgets contracted. Lead demand dropped significantly.
2024: Rate increases earned through. Underwriting profitability returned. Progressive’s combined ratio improved to 87.4% by Q4. Advertising budgets expanded dramatically. Lead demand surged.
Understanding this cycle helps you anticipate market shifts. When you see carriers reporting improving combined ratios in quarterly earnings, expect advertising expansion within 2-3 quarters. When you see deteriorating combined ratios, prepare for contraction.
How Cycles Affect Different Lines of Insurance
Not all insurance lines cycle together. Understanding the specific dynamics of each line helps you position across verticals.
Personal Auto: The most cyclical line with the fastest shifts. Combined ratios can swing 10-15 points within 18 months based on claims frequency, severity, and rate adequacy. Progressive spent $1.22 billion on advertising in 2023 and $3.5 billion in 2024, demonstrating how quickly auto insurance advertising can expand when conditions improve.
Homeowners: More stable than auto but subject to catastrophe events. A major hurricane season or wildfire year can shift homeowners from soft to hard conditions almost instantly. Geographic concentration matters significantly, with coastal and wildfire-prone markets experiencing more volatility than stable inland regions.
Commercial Lines: Typically longer cycles than personal lines. Hard market conditions in commercial often persist for 2-3 years as carriers reprice books of business. Soft conditions can also extend for long periods during competitive phases.
Life Insurance: Less cyclical than property and casualty lines. Investment returns and mortality experience drive results more than underwriting cycles. Lead generation economics remain more stable, though individual carrier appetite varies.
Medicare: Operates on its own cycle driven by CMS policy, plan profitability by geography, and enrollment period timing. The one-to-one consent requirement implemented in October 2024 affected lead generation more than traditional market cycles.
Monitoring Cycle Indicators
Sophisticated lead generators track indicators that signal market shifts before they fully manifest in lead pricing.
Earnings and Financial Signals
Carrier earnings calls reveal advertising intentions, combined ratio trends, and strategic priorities. When Progressive’s CEO discusses “capitalizing on competitive positioning” or “investing in growth,” expect advertising expansion. Industry aggregate combined ratio data from A.M. Best, S&P Global, and insurance trade publications provides leading indicators of market direction before individual carrier actions become visible.
Market Activity Signals
MediaAlpha and EverQuote earnings provide real-time visibility into carrier advertising behavior, with transaction value growth or contraction signaling current market conditions. State insurance department filings reveal carrier rate strategies, and significant rate increase filings across multiple carriers signal hard market conditions. Rising reinsurance costs flow through to primary carrier profitability, contributing to hard market conditions, so monitoring reinsurance renewal season around January 1 provides early warning signals.
Hard Market Strategy: Surviving and Positioning
Hard markets test lead generation operations. Demand contracts, prices compress, and competition for remaining buyers intensifies. Practitioners who lack strategic discipline fail during hard markets. Those who adapt can emerge stronger when conditions improve.
Demand Dynamics During Hard Markets
When carriers experience underwriting losses, they respond predictably. Marketing is variable cost that carriers can reduce quickly, so expect 20-50% reductions in carrier advertising during hard market conditions. Carriers simultaneously tighten volume caps, raise quality thresholds, and reduce bids. The same lead that sold for $50 during soft conditions might clear at $30-35 during hard conditions.
The downstream effects compound quickly. Marginal lead buyers exit the market or dramatically reduce volume, creating concentration risk for publishers dependent on specific relationships. Carriers impose additional underwriting requirements that extend the consumer journey from lead to bound policy. Return rates that ran 8-10% during soft conditions can spike to 15-20% during hard markets as carriers reject more leads as “unquotable” or “outside appetite.”
The 2022-2023 auto insurance hard market demonstrated these dynamics clearly. MediaAlpha reported year-over-year revenue declines. EverQuote’s auto vertical contracted significantly before its 2024 recovery. Publishers who had grown accustomed to stable demand found themselves scrambling.
Pricing Adjustments and Margin Compression
Hard markets compress margins from multiple directions simultaneously. Carriers bid less for each lead, decreasing your revenue per lead while more leads get returned, reducing effective revenue further. Publishers compete more aggressively for remaining demand, putting pressure on sell-through rates.
Adding to the pressure, consumer shopping behavior does not decrease proportionally to carrier demand. Consumers shopping for insurance during hard markets face higher premiums and shop more actively, which means your traffic acquisition costs may remain stable while revenue decreases.
The math becomes challenging. A lead that cost $25 to generate and sold for $40 during soft conditions (60% margin) might cost $25 to generate and sell for $32 during hard conditions (28% margin). That margin compression can turn profitable operations unprofitable quickly.
Strategic Response: Operations
Operational adjustments help maintain viability during hard markets.
Quality as Competitive Advantage
When buyers become selective, quality differentiation matters more. Invest in validation, consent documentation like TrustedForm or Jornaya, and data enhancement. The publisher selling commoditized leads struggles during hard markets, while the publisher selling verified, compliant, high-intent leads maintains buyer relationships. Quality becomes the primary basis for buyer decisions when they have surplus inventory to choose from.
Diversification and Efficiency
Reduce dependency on any single carrier or buyer because hard markets expose concentration risk brutally. If 60% of your volume goes to one carrier and they cut budgets, your operation faces existential threat. Diversified distribution across carriers, agency networks, and independent agents provides stability. Simultaneously, optimize acquisition to reduce cost per lead by cutting underperforming campaigns and focusing spend on highest-ROI channels. The fat you accumulated during soft conditions becomes liability during hard markets.
Volume and Inventory Management
Tighten lead generation to match reduced demand. Producing leads you cannot sell at positive margin destroys cash, so accepting reduced volume while maintaining margin beats chasing volume at negative economics. Develop capabilities to monetize leads that do not sell immediately through aged lead strategies. Real-time leads that find no buyer can be resold as aged inventory at reduced prices. The revenue is not ideal, but it is not zero either.
Strategic Response: Business Development
Relationship and positioning adjustments help during hard markets.
Buyer Relationship Investment
Hard markets reveal which publishers carriers value and which they merely tolerate. Invest in relationships before you need them through regular communication, performance transparency, and proactive problem-solving that differentiate you from competitors. When carriers must cut volume, they cut vendors they feel neutral about first.
Channel and Vertical Diversification
When carriers restrict direct acquisition, independent agents often maintain or increase lead purchasing. Agents face the same hard market with fewer competitive quotes for consumers, but they still need to write business. Diversify toward agency buyers who remain active regardless of carrier advertising cycles. Similarly, if auto insurance enters hard conditions, consider whether you can pivot capacity toward homeowners, life, or other lines. Publishers with multi-vertical capability can shift resources toward healthier markets.
Contract Flexibility
Consider volume commitments, exclusivity arrangements, or pricing concessions that lock in buyer relationships during uncertain periods. A guaranteed floor volume at slightly reduced pricing may be preferable to uncertain spot market dynamics where you compete for scraps.
Cash Management During Hard Markets
Hard markets stress cash positions in multiple ways. Lead generation operates on negative cash cycles where you pay traffic sources immediately but collect from buyers 30-45 days later. Hard markets extend this float as buyers delay payment and dispute more leads, compounding the cash flow pressure.
The key to surviving is preparation during better times. Profitable soft market periods should fund reserves for hard market survival because operators who extract all profits during good times lack cushion when conditions worsen. Variable costs must decrease proportionally with revenue while fixed costs become dangerous. Review all overhead for reduction opportunities during hard markets.
Finally, ensure access to credit before you need it. Banks do not extend credit to struggling businesses, so establish relationships and capacity during good times when your financials look strong.
Soft Market Strategy: Scaling and Maximizing
Soft markets create opportunity for aggressive operators. Demand exceeds supply. Prices rise. Buyers compete for inventory. The challenge shifts from survival to optimal positioning for maximum value capture.
Demand Dynamics During Soft Markets
When carriers become profitable and growth-oriented, the market dynamics shift dramatically in favor of lead generators. Carriers increase marketing spend, often dramatically. Progressive’s jump from $1.22 billion to $3.5 billion in a single year demonstrates the magnitude possible when profitability returns.
The result is a lead demand surge as more buyers enter the market, existing buyers increase volume caps and raise bids, and competition for inventory intensifies. Carriers accept leads they would reject during hard markets, with return rates decreasing and qualification standards softening. Streamlined underwriting and competitive urgency compress the time from lead to bound policy. Strong demand drives lead prices upward, with the same lead quality commanding 20-40% higher prices during soft conditions than during hard conditions.
The 2024 recovery demonstrated these dynamics. MediaAlpha’s Q4 2024 transaction value increased 202% year-over-year. EverQuote’s automotive revenue grew 96%. Carriers competed aggressively for consumer attention, and lead generators benefited directly.
Scaling Strategies
Soft markets reward operators who can scale efficiently.
Traffic and Channel Expansion
Increase investment in acquisition channels that maintain efficiency at higher volume. Soft markets provide margin cushion to test new channels and expand into new geographies. Add traffic sources while unit economics remain favorable because the traffic source that seems marginally profitable during soft conditions becomes unprofitable during hard conditions. Build diversified acquisition during favorable periods so you have options when conditions change.
Quality and Premium Development
The temptation during soft markets is to chase volume at the expense of quality. Resist this temptation. Buyers who accept lower-quality leads during soft conditions remember which publishers sent them, and when hard conditions return, they cut publishers known for marginal quality first. Instead, use soft markets to develop exclusive lead products with enhanced verification, real-time delivery, and superior consent documentation. Buyers will pay premiums for quality during soft conditions, and those premium products become your lifeline during hard markets.
Pricing Strategy During Soft Markets
Capturing value during favorable conditions requires pricing discipline.
Track competitor pricing and buyer bids, and do not leave money on the table by underpricing. If shared leads clear at $35 in the marketplace, price accordingly. Exclusive leads should command 2-3x shared pricing during soft markets, so if shared leads sell at $30, exclusive leads should sell at $65-85.
Implement dynamic pricing that responds to demand signals. When buyer bids increase, raise prices. Automated systems can optimize pricing faster than manual review. During soft markets, you have leverage because multiple buyers want your inventory. Use competition to maximize price. Ping/post systems naturally capture this value through real-time bidding, ensuring you receive fair market value for every lead.
Building for the Next Hard Market
The best time to prepare for hard markets is during soft markets.
Relationships and Infrastructure
Establish relationships with buyers you do not currently sell to because when hard markets arrive and some buyers exit, you need alternatives. Build systems, implement validation tools, and enhance infrastructure while cash flow is positive since hard market cash constraints limit investment capacity. Implement consent capture technology, fraud detection, and validation processes. These quality infrastructure investments pay off during hard markets when buyers become selective about which publishers they work with.
Financial Preparation
Build reserves during profitable periods. The 60-day float rule suggests maintaining 60 days of operating expenses in reserve, and soft markets provide the cash flow to build that cushion. Negotiate favorable contract terms while you have leverage. Long-term volume commitments with pricing floors protect against hard market compression and give you predictable revenue when the market turns.
Avoiding Soft Market Traps
Common mistakes during soft markets can set you up for failure when conditions change.
Over-Expansion and Complacency
Scaling fixed costs such as office space, permanent headcount, and enterprise software to match soft market volume creates liability when volume contracts. Scale variable costs, not fixed costs. High margins during soft markets can also mask operational inefficiencies. Continue optimizing even when margins are comfortable because the efficiency you build during soft markets determines survival during hard markets.
Quality and Cash Discipline
Accepting lower traffic quality to meet demand destroys buyer relationships and creates compliance risk. Quality problems planted during soft markets bear fruit during hard markets when buyers remember who sent them marginal leads. Similarly, taking all profits out of the business leaves nothing for hard market survival. Maintain adequate reserves even during profitable periods because the next hard market is always coming.
Carrier Appetite Changes and Their Impact
Understanding how carrier appetite shifts during market cycles helps you predict demand changes and position appropriately.
What Drives Carrier Appetite
Carrier appetite for leads depends on multiple factors, with underwriting results serving as the primary driver. Profitable carriers want growth, while unprofitable carriers restrict acquisition. But competitive position matters as well. Carriers watch competitors, and if Progressive is advertising aggressively and gaining market share, GEICO cannot ignore the competitive pressure indefinitely.
Capital position affects how carriers respond to market conditions. Well-capitalized carriers can invest through hard markets to gain share, while capital-constrained carriers must conserve resources. Geographic focus creates variation within a single carrier’s appetite because carriers prioritize states where they have rate adequacy and favorable loss experience. A carrier might be aggressive in Texas but restrictive in California.
Product mix and reinsurance costs round out the picture. Carriers seek specific risk profiles, so changes in appetite often reflect shifts in which customer segments carriers want to attract. Rising reinsurance expenses reduce carrier capacity and appetite, particularly for catastrophe-exposed lines.
Reading Carrier Signals
Carriers telegraph appetite through observable behaviors. Advertising spend is the most direct signal, with increasing spend indicating growth appetite and decreasing spend signaling restriction. CEO statements during earnings calls reveal strategic priorities, with language like “investing in growth” versus “focused on rate adequacy” telling you where carriers are headed. Significant rate increase filings signal hard market positioning because carriers raising rates are not prioritizing volume growth.
At the operational level, carriers communicate appetite through their agent networks. Changes in commission structures, bonus programs, and volume incentives signal strategic shifts. Tightening underwriting guidelines such as excluding certain vehicle types, requiring higher down payments, or restricting driver profiles indicates reduced appetite. When carriers increase lead return rates, they are signaling reduced appetite through actions rather than words.
Adapting to Appetite Shifts
Different buyer types respond differently to market cycles.
Large Carriers
Progressive, GEICO, and Allstate Direct represent the most responsive segment to market cycles. They can increase or decrease spend dramatically and quickly, which represents significant volume concentration risk for publishers dependent on them. Lead pricing with these buyers fluctuates most during cycles because they have the flexibility to act on market conditions immediately.
Independent Agent Networks
Independent agents provide more stability through cycles because they need to write business regardless of market conditions. They willingly pay premiums for quality exclusive leads and remain less sensitive to industry-wide pricing pressure. This segment often increases purchasing during hard markets when carriers restrict direct acquisition.
Captive Agent Channels
State Farm, Farmers, and similar captive channels show moderate cycle sensitivity. Corporate lead programs may expand or contract, but individual agents maintain consistent local demand. These relationships tend to be relationship-driven more than price-driven, providing stability for publishers who invest in them.
Aggregators and Brokers
Aggregators adjust to carrier demand and can shift focus across carriers based on appetite. They provide diversification for publishers but may compress margins during hard markets as they seek to maintain their own economics.
Diversifying across buyer types provides stability through market cycles. Over-concentration with any single buyer type creates vulnerability.
Lead Pricing Dynamics Across Market Cycles
Lead pricing responds directly to market cycle conditions. Understanding these dynamics helps you plan budgets, set expectations, and negotiate effectively.
Pricing Patterns by Market Condition
Soft Market Pricing
During soft market conditions, exclusive auto leads typically range from $55-100, shared auto leads from $25-40, and live transfers from $120-200. Premium pricing grows relative to hard market levels by 25-40% as carriers compete aggressively for inventory.
Hard Market Pricing
During hard market conditions, exclusive auto leads compress to $40-75, shared auto leads to $15-30, and live transfers to $80-150. Overall compression runs 20-35% from soft market peaks, though quality tiers maintain relatively better pricing.
Market Transition Pricing
Prices lag cycle turns by 1-2 quarters. Buyer behavior changes before published prices adjust, with spot market pricing leading contracted pricing. Savvy operators watch buyer behavior rather than published rates to identify turning points.
These ranges represent general market conditions. Specific pricing depends on geography, quality tier, vertical, and buyer relationship.
Understanding Price Movements
Prices move for structural reasons tied to market cycles.
Demand-Driven Price Increases
When carriers increase advertising, they need more leads. More buyers bidding for the same inventory drives prices up through classic supply-demand economics. Soft markets create demand-driven price increases as carriers compete for consumer attention.
Supply-Driven Price Compression
When carriers reduce advertising, fewer buyers compete for leads. Publishers with the same traffic volume face reduced demand. Prices compress as publishers compete for remaining buyers. Hard markets create supply-driven price compression that can happen faster than publishers expect.
Quality Premium Divergence
During hard markets, quality premiums increase because buyers become selective. The gap between premium exclusive leads and commodity shared leads widens. Buyers who remain active pay more for verified, compliant, high-intent leads while commodity pricing collapses. During soft markets, quality premiums compress somewhat because buyers accept lower-quality leads to meet volume goals. The gap narrows, though premium leads still command meaningful premiums.
Pricing Strategy Across Cycles
Soft Market Pricing Strategy
Price to market and do not leave money on the table. Push exclusive premiums higher because buyers will pay. Test price increases incrementally to find the ceiling while locking in volume commitments at favorable rates. Build pricing power through quality differentiation that persists when conditions change.
Hard Market Pricing Strategy
Protect margin over volume because unprofitable volume destroys cash. Maintain quality premiums while accepting that commodity pricing compresses. Develop creative structures such as performance guarantees and exclusivity commitments that provide value to buyers. Reduce traffic acquisition costs to maintain margin at lower prices. Consider volume guarantees in exchange for pricing floors that protect your downside.
Transition Period Pricing Strategy
Recognize cycle turns early through leading indicators and adjust pricing proactively rather than reactively. Communicate transparently with buyers about market dynamics. Position quality advantages before price becomes the only lever in negotiations.
Case Study: The 2022-2024 Auto Insurance Cycle
The recent auto insurance market cycle provides instructive lessons for navigating future cycles.
Phase 1: The Hard Market (2022-2023)
Claims inflation hit auto insurance hard. Higher vehicle repair costs from semiconductor shortages and parts availability issues, increased medical expenses, and more severe accidents created underwriting losses across the industry. Combined ratios exceeded 100% for most carriers.
Carriers responded predictably. Progressive reduced advertising spend. GEICO pulled back significantly under Berkshire Hathaway’s discipline. Carriers filed rate increases across most states while lead purchasing budgets contracted.
The lead market impact was immediate. MediaAlpha and EverQuote reported revenue declines. Lead pricing compressed 25-35%. Buyer volume caps decreased while return rates increased. Some publishers exited the market entirely or reduced operations significantly.
The lessons learned were clear: concentration risk with single carriers proved dangerous, publishers with diversified buyer bases survived better, quality-focused operations maintained buyer relationships, and operators who had built reserves could weather the downturn.
Phase 2: The Recovery (Late 2023-2024)
Rate increases implemented in 2022-2023 earned through. Underwriting profitability returned, with Progressive’s combined ratio improving to 87.4% by Q4 2024.
Carriers responded aggressively. Progressive expanded advertising to $3.5 billion from $1.22 billion. Allstate maintained aggressive positioning. GEICO began careful re-entry into advertising. Carriers competed aggressively for market share.
The lead market impact was dramatic. MediaAlpha reported 123% revenue growth for 2024. EverQuote’s auto revenue increased 96%. Lead pricing recovered and exceeded pre-hard market levels. Buyer demand exceeded publisher capacity, and new publishers entered the market.
The recovery taught operators important lessons. Cycles reverse faster than expected. Practitioners who maintained operations through hard markets captured recovery value, while those who exited during hard markets missed it entirely. Quality investments made during hard markets paid off during recovery, and cash reserves enabled aggressive scaling when the opportunity arrived.
Phase 3: Current Conditions (2025)
The auto insurance market is experiencing strong soft market conditions as of 2025. Carrier profitability remains healthy, advertising budgets are elevated, and lead demand is robust.
Key indicators to watch include combined ratio trends where any deterioration signals potential cycle turn, claims frequency and severity data, rate adequacy discussions in earnings calls, reinsurance pricing at January 2025 renewals, and vehicle repair cost inflation trends.
This is the time to build reserves, diversify buyer relationships, invest in quality infrastructure, and prepare for the next hard market. The current soft market will not last forever. Practitioners who prepare now will survive the next downturn.
Adapting Strategies by Business Model
Different lead generation business models require different cycle adaptation strategies.
Publishers and Traffic Generators
Hard Market Adaptation
During hard markets, publishers should reduce traffic acquisition to match reduced demand while focusing on highest-quality traffic sources. Develop alternative monetization through aged leads and secondary markets. Invest in consent documentation and compliance. Diversify across verticals if possible, and maintain buyer relationships even at reduced volume because those relationships become crucial during recovery.
Soft Market Optimization
During soft markets, scale traffic acquisition aggressively while margins support expansion. Test new traffic channels and develop exclusive lead products with premium pricing tiers. Establish relationships with additional buyers to reduce concentration risk. Most importantly, build cash reserves for the next hard market while revenue is strong.
Lead Brokers and Distributors
Hard Market Adaptation
During hard markets, tighten source quality standards and reduce carry costs for inventory held between purchase and sale. Focus on quick-turn distribution while maintaining relationships on both publisher and buyer sides. Consider vertical diversification and always preserve margin over volume because cash becomes precious during extended downturns.
Soft Market Optimization
During soft markets, expand your publisher network while demand exceeds supply and develop exclusive distribution arrangements. Build real-time bidding capabilities to maximize spread through better price discovery. Diversify your buyer base and invest in technology and operational efficiency that will pay dividends when conditions tighten.
Lead Buyers (Agents and Carriers)
Hard Market Adaptation
During hard markets, maintain lead purchasing to sustain market presence even as budgets tighten. Quality becomes more important than volume, so focus on verified, high-intent leads. Negotiate favorable terms while publishers are hungry for volume. Build publisher relationships that will serve you during future soft markets. Improve conversion capabilities to justify continued lead investment when every dollar matters.
Soft Market Optimization
During soft markets, secure volume commitments before prices increase further and lock in pricing through longer-term agreements. Diversify publisher sources to ensure supply since capacity becomes scarce when everyone wants leads. Invest in speed-to-contact capabilities to maximize conversion on higher-cost leads. Accept that lead costs will be higher than historical averages because that is the price of growth during competitive periods.
Frequently Asked Questions
What is a hard market in insurance, and how does it affect lead generation?
A hard market occurs when insurance carriers face profitability pressure from claims losses, forcing them to prioritize underwriting discipline over customer acquisition. During hard markets, carriers reduce advertising budgets, tighten underwriting standards, and become more selective about lead purchases. For lead generators, this means reduced demand, lower lead prices (typically 20-35% below soft market levels), higher return rates, and increased competition for remaining buyers. The 2022-2023 auto insurance hard market demonstrated these dynamics, with carriers like Progressive cutting advertising while implementing rate increases to restore profitability.
How long do insurance market cycles typically last?
Insurance market cycles vary by line of business and driving factors. Auto insurance cycles have historically run 2-4 years from peak to trough. The 2022-2024 cycle was relatively compressed, with carriers moving from significant losses to strong profitability in approximately 18-24 months due to aggressive rate increases. Homeowners and commercial lines often experience longer cycles of 3-5 years. Catastrophe-driven hard markets (major hurricanes, wildfires) can occur suddenly and persist for multiple years. Monitor combined ratio trends, carrier earnings, and advertising activity to gauge cycle position rather than assuming fixed timeframes.
How can I predict when market cycles will shift?
Monitor leading indicators including carrier combined ratios (published quarterly), earnings call commentary about advertising intentions, rate filing activity with state insurance departments, and MediaAlpha/EverQuote earnings reports showing transaction value trends. Combined ratios trending below 95% signal carrier profitability that typically precedes advertising expansion. Combined ratios trending above 100% signal losses that typically precede advertising contraction. Carrier CEOs discussing “growth investment” versus “rate adequacy” provide direct signals of strategic direction. Most indicators lead actual lead market changes by 1-2 quarters.
Should I reduce lead generation operations during hard markets?
Reduce but do not eliminate operations during hard markets. Maintaining minimum viable presence preserves buyer relationships, captures remaining demand, and positions you for recovery. Practitioners who exit completely during hard markets miss the recovery and must rebuild from scratch. The key is matching operations to demand, reducing variable costs (traffic acquisition), preserving quality, and maintaining cash reserves. Cut unprofitable volume but sustain the operational capability to scale when conditions improve. The 2024 recovery rewarded operators who maintained operations through the 2022-2023 hard market.
How much should lead prices vary between hard and soft markets?
Lead prices typically vary 25-40% between hard and soft market conditions. Exclusive auto insurance leads that sell for $75 during soft markets might compress to $50-55 during hard markets. Shared leads that sell for $30 during soft markets might compress to $20-22 during hard markets. Live transfers show similar percentage variation. Premium quality tiers maintain relatively better pricing during hard markets because buyers become more selective and willing to pay for verified, compliant leads. Commodity leads experience the most severe price compression.
How do carrier advertising budgets affect lead pricing?
Carrier advertising budgets directly determine lead demand. When Progressive increased advertising from $1.22 billion to $3.5 billion in 2024, lead demand surged and prices rose 30-40%. Carrier advertising creates competition for lead inventory. More advertising dollars chasing the same consumer attention drives up both traffic costs (what publishers pay to generate leads) and lead prices (what buyers pay for leads). Monitor carrier advertising trends through quarterly earnings reports, industry publications, and MediaAlpha/EverQuote transaction value metrics to anticipate pricing movements.
What quality investments should I make during hard markets?
Hard markets reward quality investments because buyers become selective. Prioritize consent documentation technology (TrustedForm, Jornaya certificates), phone and email validation services, fraud detection systems, and data enhancement capabilities. These investments reduce return rates (critical when buyers reject more leads during hard markets), maintain buyer relationships by delivering consistently qualified leads, and position your leads as premium products worth paying for when buyers have many options. Quality infrastructure built during hard markets creates competitive advantage during soft market recovery.
How should I diversify buyer relationships for cycle resilience?
Diversify across buyer types (large carriers, independent agents, captive channels, aggregators), across carriers (avoid more than 30-40% concentration with any single carrier), and across geographies. Independent agents often maintain steadier demand through cycles because they need to write business regardless of carrier advertising trends. Establish relationships with buyers in multiple segments before you need them. Hard markets expose concentration risk; soft markets provide opportunity to build diversified distribution. Target buyer portfolios where no single buyer represents more than 25-30% of volume.
What cash reserves should I maintain for market cycle volatility?
Maintain minimum 60 days of operating expenses in cash reserves, with 90-120 days preferred for operations with significant carrier concentration. Lead generation operates on negative cash cycles where you pay for traffic immediately and collect from buyers 30-45 days later. Hard markets extend this float as buyers delay payment and dispute more leads. Without adequate reserves, cash flow stress during hard markets can force operational shutdowns even when the underlying business remains viable. Build reserves during profitable soft market periods; never extract all profits from the business.
How do different insurance verticals experience market cycles?
Auto insurance experiences the most pronounced and fastest-moving cycles, with combined ratios swinging 10-15 points within 18 months. Homeowners insurance cycles more slowly but can shift suddenly following major catastrophe events (hurricanes, wildfires). Commercial lines typically experience longer cycles of 3-5 years. Life insurance shows less cyclicality because investment returns and mortality experience matter more than underwriting cycles. Medicare lead generation operates on its own dynamics driven by CMS policy, enrollment periods, and plan profitability rather than traditional insurance cycles. Diversifying across verticals with different cycle patterns provides operational stability.
When is the best time to invest in lead generation infrastructure?
Invest in infrastructure during soft markets when cash flow supports investment and during early hard markets when prices are lower for technology and talent. Soft markets provide the cash flow for infrastructure investment, while hard markets provide the motivation (quality requirements tighten, efficiency becomes critical). Avoid major infrastructure investment during late hard markets when cash is constrained, or during late soft markets when asset prices are inflated. The optimal timing is early in market transitions: invest in quality infrastructure as soft markets mature (preparing for hard market selectivity) and invest in scaling infrastructure as hard markets bottom (preparing for recovery).
Key Takeaways
-
Insurance market cycles fundamentally determine lead generation economics. Soft markets (carrier profitability, advertising expansion) create strong demand and rising prices. Hard markets (carrier losses, advertising contraction) compress demand and prices by 25-40%.
-
The combined ratio is the key indicator. Carrier combined ratios below 100% signal underwriting profit and growth appetite. Combined ratios above 100% signal losses that precede advertising cuts and demand reduction.
-
Progressive’s advertising swing from $1.22 billion (2023) to $3.5 billion (2024) demonstrates how quickly soft market conditions can emerge when carrier profitability returns.
-
Hard market survival requires quality focus, buyer diversification, traffic efficiency, and cash reserves. Practitioners who maintain operations through hard markets capture recovery value; those who exit miss it.
-
Soft market optimization requires aggressive scaling while maintaining quality, building reserves for the next hard market, and establishing buyer relationships before you need them.
-
Lead pricing varies 25-40% between hard and soft conditions. Exclusive auto leads ranging from $50-55 (hard) to $75-100 (soft) demonstrates typical variation.
-
Diversify across buyer types (carriers, agents, aggregators), across carriers (no more than 30-40% concentration), and across verticals to reduce cycle vulnerability.
-
Monitor leading indicators (combined ratios, earnings commentary, advertising activity, rate filings) to anticipate cycle turns 1-2 quarters before they fully manifest in lead pricing.
-
The current soft market (2025) will not last forever. Use favorable conditions to build reserves, invest in quality infrastructure, diversify relationships, and prepare for the next hard market.
-
Maintain minimum 60-90 days of operating expenses in cash reserves to survive the negative float dynamics that intensify during hard markets.
Sources
- MediaAlpha Investor Relations - Publicly traded insurance lead exchange reporting 123% revenue growth demonstrating 2024 market recovery
- Allstate Investors - Progressive financial disclosures showing $3.5B advertising spend (up from $1.22B) and 87.4% combined ratio by Q4 2024
- Insurance Information Institute - Industry statistics on underwriting cycles and combined ratio trends
- Investopedia: Combined Ratio - Definition and explanation of combined ratio as key indicator of carrier profitability
- A.M. Best - Insurance industry financial strength ratings and market analysis
- TrustedForm by ActiveProspect - Consent documentation platform for quality infrastructure investment
- Verisk (Jornaya) - Lead intelligence platform for quality verification during market cycles
Understanding market cycles separates operators who build sustainable businesses from those who ride favorable conditions and fail when conditions change. The cycle will turn. The question is whether you will be positioned to survive and capitalize when it does.