Building systematic quality control that protects margins, strengthens buyer relationships, and creates sustainable competitive advantage in lead generation.
The lead that passed every validation check still got returned. The phone number worked. The email delivered. The address verified. The consent certificate existed. And yet, three days later, the buyer requested a refund because the consumer claimed they never filled out a form.
This scenario plays out thousands of times daily across the lead generation industry. It represents the fundamental gap between validation and quality control. Validation confirms data is technically accurate. Quality control ensures leads actually convert to value.
The distinction matters because the economics are unforgiving. An operation running 8% returns generates fundamentally different results than one running 18%. Same traffic sources. Same buyers. Same vertical. The difference between those return rates transforms a profitable business into one hemorrhaging cash. On 10,000 monthly leads at $40 each, that 10-point swing represents $40,000 in lost revenue before you count the processing costs, supplier payments, and relationship damage.
Quality control is not a feature you add when the business matures. It is the foundation upon which every sustainable lead operation is built. This guide covers the complete framework: the systems, processes, metrics, and technologies that separate professional operations from commodity generators. By the end, you will understand how to build quality control that protects your margins, strengthens your buyer relationships, and creates competitive advantage that compounds over time.
The Quality Control Imperative: Why It Matters Now More Than Ever
The lead generation industry faces a quality crisis that grows more severe each year. According to industry research from 2024-2025, approximately 30% of leads sold by third-party vendors contain fraudulent or significantly problematic data. This is not a marginal inefficiency. It represents a structural failure that costs buyers billions annually and destroys trust throughout the ecosystem.
The broader digital advertising landscape provides context. Global ad fraud losses reached $84 billion annually by 2023, with projections exceeding $100 billion by 2025. That represents roughly 22% of total digital advertising spend flowing to clicks, impressions, and leads that never had a real human behind them.
Traffic composition tells an even starker story. When accounting for all automated traffic, only about half of web traffic comes from actual humans. Malicious bot percentages run even higher on lead generation forms where payouts create direct financial incentive for fraud.
What Quality Control Actually Means
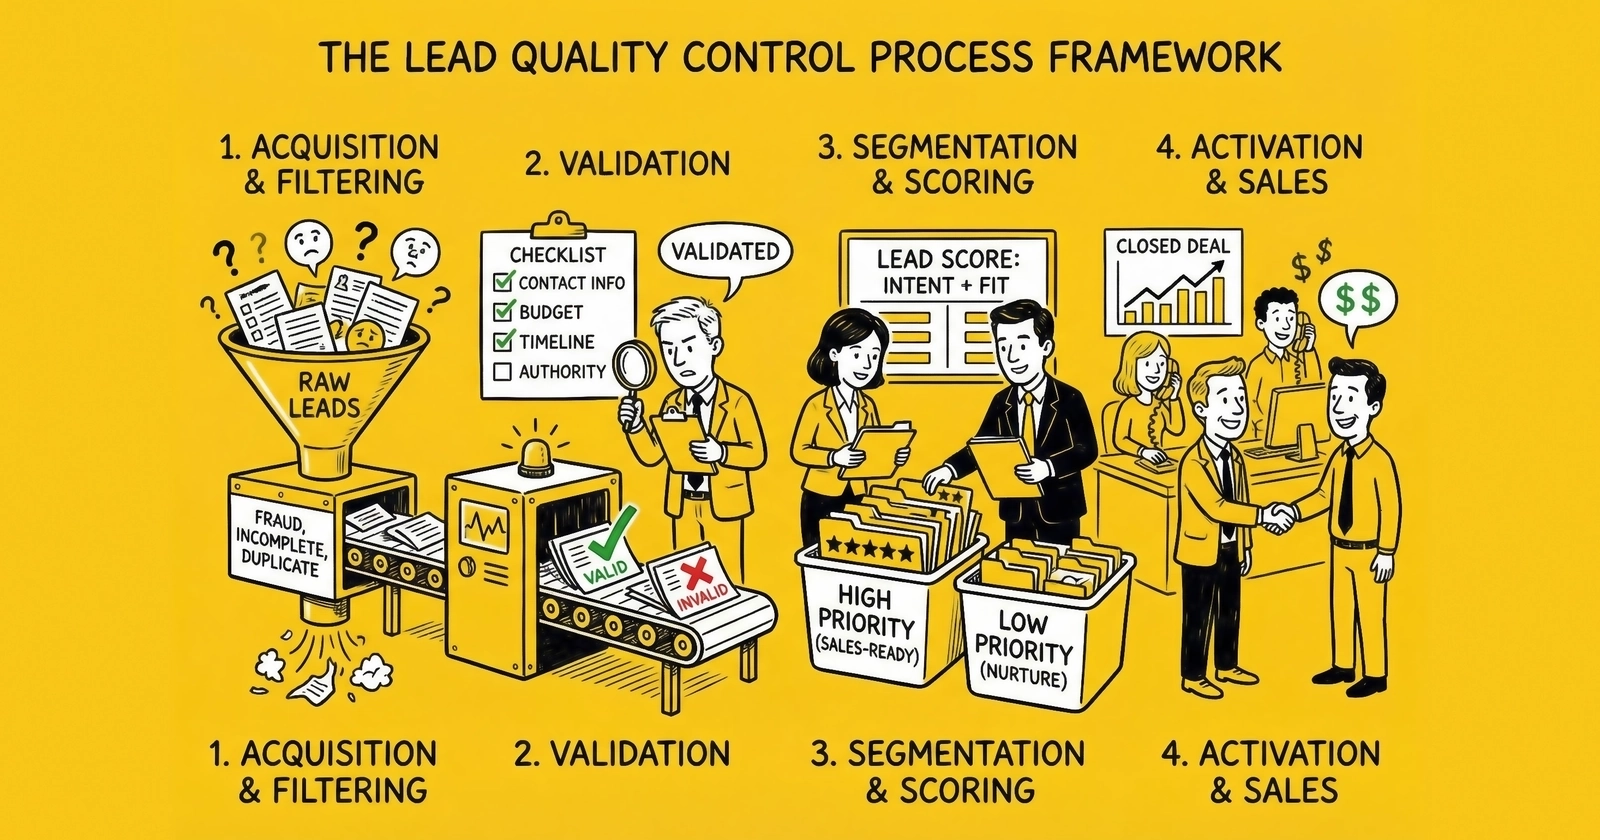
Quality control in lead operations encompasses three distinct but interconnected systems.
Prevention stops bad leads before they enter your operation. This includes validation technology, fraud detection, and source qualification processes that filter problems at the point of capture.
Detection identifies quality issues that prevention missed. This involves scoring models, pattern analysis, and feedback loops that surface problems before they damage buyer relationships.
Remediation addresses discovered issues systematically. This covers return processing, source management, and process improvement that prevents recurring problems.
most practitioners invest heavily in prevention while neglecting detection and remediation. This creates blind spots where sophisticated fraud, low-intent traffic, and systematic source problems accumulate until margins collapse.
The Financial Case for Quality Investment
Quality control costs money. Validation services charge per lead. Fraud detection platforms require subscriptions. Staff time goes to monitoring and analysis. The business case requires that these investments return more than they cost.
Consider a lead broker processing 10,000 monthly leads at $30 purchase price and $50 sale price.
Without quality control:
- Gross revenue: $500,000
- Purchase cost: $300,000
- Return rate: 20%
- Returns: $100,000
- Net margin: $100,000 (20%)
With comprehensive quality control:
- Gross revenue: $500,000
- Purchase cost: $300,000
- Quality control cost: $15,000 (validation, fraud detection, monitoring)
- Return rate: 8%
- Returns: $40,000
- Net margin: $145,000 (29%)
The $15,000 quality investment returns $60,000 in reduced returns, a 400% ROI before counting the value of preserved buyer relationships and improved pricing power.
The Quality Control Stack: Prevention Layer
Prevention represents the most cost-effective quality control investment. Every lead caught before delivery costs only the acquisition price. Every lead that passes through and gets returned costs the acquisition price plus processing time plus buyer relationship damage.
Real-Time Validation Infrastructure
Real-time validation checks data accuracy at the moment of submission. The consumer completes your form, the system validates instantly, and invalid data gets rejected before entering your pipeline.
Phone Validation
Phone validation serves as the primary quality gate for most lead verticals. A bad phone number means zero contact opportunity. The lead is worthless regardless of what other data fields contain.
Line type detection identifies whether a number connects to mobile, landline, or VoIP service. Mobile phones have significantly higher contact rates than landlines because consumers carry them constantly. Non-fixed VoIP numbers from services like Google Voice carry 3-5x higher fraud rates than mobile numbers. Many buyers reject non-fixed VoIP entirely or discount prices by 30-50%.
Carrier lookup identifies which company currently owns the number. Major carriers like Verizon, AT&T, and T-Mobile suggest established service. Prepaid carriers and certain VoIP providers correlate with higher fraud rates.
Disconnected number detection checks carrier databases to identify numbers no longer in service. This costs nothing relative to the value of preventing dead-lead delivery.
DNC registry checking screens against the National Do Not Call list containing over 240 million numbers. Numbers on the registry should not receive telemarketing calls without prior express consent. DNC screening costs $0.001-$0.005 per lookup and prevents both compliance violations and buyer returns.
Email Validation
Email validation prevents bounces and ensures deliverability. A high bounce rate damages sender reputation with email service providers, potentially blocking your entire domain from reaching inboxes.
Syntax validation catches format errors: missing @ symbols, invalid characters, impossible domain patterns. Domain verification confirms the email domain exists and has mail exchange servers configured. Mailbox verification tests whether the specific address exists at the verified domain using SMTP protocols.
Disposable email detection identifies temporary addresses from services like Mailinator, Guerrilla Mail, and 10MinuteMail. A lead submitted with a disposable email has clearly indicated they do not want ongoing communication. That is someone who deliberately circumvented your form’s intent.
Address Validation
Physical address validation matters most for verticals tied to specific properties: home services, solar, mortgage, roofing. CASS-certified validation standardizes and verifies addresses against USPS databases. Geocoding converts addresses to coordinates for geographic analysis and fraud detection.
For property-related verticals, appending property characteristics adds qualification intelligence. Property databases provide estimated home value, square footage, year built, lot size, and ownership information. A solar lead from a renter is nearly worthless. A home improvement lead for a 600 square foot apartment differs fundamentally from one for a 3,000 square foot house.
Fraud Detection Systems
Validation catches bad data. Fraud detection catches bad actors. These require different approaches because fraudsters specifically design submissions to pass validation checks.
IP Analysis and Proxy Detection
Every form submission originates from an IP address that reveals more than consumers realize. Geographic consistency matters. A consumer claiming to live in Phoenix should submit from an Arizona IP address. Submissions from Eastern Europe for US consumers raise immediate questions.
IP classification distinguishes residential, commercial, mobile carrier, data center, proxy/VPN, and Tor traffic. Data center IPs and known proxy services rarely submit legitimate consumer leads. Commercial IP intelligence databases maintain this classification and provide reputation scores based on historical behavior.
Device Fingerprinting
When IP analysis proves insufficient, device fingerprinting provides another identification layer. Every browser and device combination creates a semi-unique fingerprint based on configuration details: browser version, installed plugins, screen resolution, system fonts, timezone settings, language preferences, WebGL rendering characteristics.
A legitimate consumer typically uses one or two devices to submit forms. A fraudster submitting hundreds of fake leads needs to mask this. Device fingerprinting catches the attempt. Canvas fingerprinting uses HTML5 rendering to capture hardware-specific characteristics. WebGL fingerprinting extends this to 3D rendering.
Behavioral Analysis
Human behavior differs from bot behavior in observable ways. Behavioral analysis examines how form submissions occur, not just what data they contain.
Time-on-page analysis measures how long users spend before submitting. A complex multi-step form that takes legitimate users 3-4 minutes to complete should not be submitted in 8 seconds. Mouse movement patterns reveal automation. Humans move cursors in curved paths with micro-corrections. Bots move in straight lines or skip movement entirely.
Typing dynamics examine keystroke rhythm: intervals between keys, time each key is held, patterns of common letter combinations. Humans type with characteristic rhythm that varies by individual. Bots type with machine precision or fake patterns that do not quite match natural behavior.
Velocity Checking
Velocity analysis examines submission frequency to identify patterns inconsistent with organic consumer behavior. How many submissions originated from this IP address in the past hour? Day? Week? One submission per household is normal. Twenty submissions from a single IP in an hour is not.
The same analysis applies to device fingerprints and unique data fields. One device, fifty submissions indicates a problem. The same phone number appearing in multiple submissions across short periods suggests either duplicate submission or fraud.
Source Qualification and Management
Not all traffic performs equally. Source qualification establishes baseline expectations before volume flows, while ongoing management ensures sources maintain quality standards.
New Source Protocol
Before accepting significant volume from any new source, test with small caps of 10-20 leads. Track return rates for the full return window plus a buffer period. Require 30 or more leads before drawing statistical conclusions. Graduate sources through quality tiers based on demonstrated performance.
Ongoing Source Metrics
Every source should be tracked on core quality indicators:
Validation pass rate measures what percentage of leads pass all validation checks. Sources with high failure rates need investigation or termination.
Fraud rate tracks how many leads show fraud indicators. A source sending 30% fraudulent traffic requires immediate action.
Contact rate measures what percentage of leads answer or return calls when buyers attempt contact. Low contact rates indicate data quality issues that validation did not catch.
Conversion rate tracks what percentage of contacted leads convert. This reveals whether the source attracts genuinely interested consumers.
Return rate shows what percentage of leads get returned by buyers. High return rates signal quality problems that require intervention.
The Quality Control Stack: Detection Layer
Prevention catches obvious problems. Detection identifies issues that made it through initial screening. This requires scoring models, pattern analysis, and systematic monitoring that surface problems before they compound.
Predictive Lead Scoring
Traditional lead scoring assigns point values to characteristics based on assumed importance. A California lead gets 10 points. A mobile phone number adds 5 points. Prior insurance coverage adds 15 points. The total determines priority.
Predictive lead scoring replaces manual point assignment with machine learning models that learn from outcomes. The model analyzes thousands of leads with known outcomes and identifies patterns that predict success. It might discover that leads submitted between 10 AM and 2 PM from mobile devices with certain property characteristics convert at 2x the average rate. No human would identify this pattern across hundreds of variables.
The impact of predictive scoring is substantial. Companies using AI-powered lead scoring report 25% average conversion increases. Businesses see up to 45% conversion rate improvements. Sales cycles shorten by approximately 28% when teams focus on high-quality leads. Yet only about 44% of companies use lead scoring systems. The majority treat all leads the same, creating opportunity for operators who invest in prediction capability.
Intent Data Integration
Intent data platforms track buying signals across the web: content consumption patterns, product page visits, competitor research, technology installations, funding announcements. For B2B operations, this data identifies accounts showing purchase intent before they fill out any form.
The validation data is compelling. 93% of B2B marketers using intent data report increased conversion rates. 65% say intent signals have improved pipeline forecasting accuracy. 95% of respondents link intent data to positive sales outcomes.
Intent-enriched leads command premiums because they demonstrably perform better. The middle ground of generic leads without intent enrichment is where margins will compress most painfully as the industry evolves.
Source-Level Quality Tracking
Individual lead scoring is necessary but insufficient. Source-level tracking identifies systematic quality patterns that demand strategic response.
Aggregate metrics mask critical variation. A blended 12% return rate might include one source at 4% and another at 28%. Treating them identically guarantees suboptimal outcomes.
Segment quality analysis by traffic type (search, social, native, email), sub-source or affiliate, geographic origin, time of day and day of week, and creative or landing page version. A source might send excellent leads from search traffic and terrible leads from email campaigns. Granular tracking enables precise optimization.
Trending analysis catches decline before it damages relationships. A 5% week-over-week increase in return rate warrants investigation. A 15% increase demands immediate source pause.
Pattern Recognition and Anomaly Detection
Systematic quality control requires pattern recognition that surfaces issues humans would miss in day-to-day operations.
Return reason analysis reveals root causes. If a specific source shows elevated “bad phone number” returns, that source has validation problems. If a specific buyer returns for “not qualified” frequently, their filter criteria may not match reality. If returns spike on Mondays from weekend lead accumulation, speed-to-lead needs attention.
Fraud pattern detection identifies coordinated attacks. When multiple submissions share IP ranges, device fingerprints, or behavioral patterns, investigation is warranted even if individual leads pass validation.
Seasonal and cyclical analysis distinguishes temporary fluctuations from persistent problems. Medicare quality naturally fluctuates around enrollment periods. Solar leads perform differently by season and geography. Understanding normal variation prevents overreaction to expected changes.
The Quality Control Stack: Remediation Layer
Detection without action provides no value. Remediation translates quality insights into operational improvement through feedback integration, source management, and process refinement.
Buyer Feedback Integration
Your buyers know things about lead quality you cannot measure directly. They know which leads answered the phone, which engaged in meaningful conversation, which showed purchase intent, and which converted to customers.
Structured Feedback Collection
Establish formal mechanisms for buyer quality feedback.
Return reason codes standardize why leads get returned. “Bad phone number” differs from “consumer not interested” differs from “never requested contact.” Each reason implies different root causes and different solutions.
Disposition reporting provides regular feeds from buyer CRM systems showing contact attempt outcomes, conversation results, and ultimate conversion status. This data trains your quality scoring models.
Quality scorecards capture periodic buyer assessments of overall lead quality, comparing your performance to their other sources. This qualitative feedback contextualizes quantitative metrics.
Feedback Timing
Buyer feedback arrives at different speeds:
- Contact rate data: available within days
- Conversion data for short sales cycles (insurance, home services): available within weeks
- Conversion data for long sales cycles (mortgage, solar, education): potentially months delayed
Design feedback processes that accommodate these timing differences. Immediate signals like contact rates inform real-time optimization. Lagging signals like mortgage conversion update long-term quality models.
Source Optimization Based on Quality
Quality data must translate to strategic action. Sources that consistently deliver quality earn increased allocation and premium payouts. Persistent problems trigger termination.
Performance-Based Pricing
Quality data enables source pricing that reflects actual value delivered.
| Quality Tier | Return Rate | Contact Rate | Payout Adjustment |
|---|---|---|---|
| Premium | Under 5% | Over 80% | +15% |
| Standard | 5-10% | 70-80% | Base rate |
| Below Standard | 10-20% | 60-70% | -15% |
| Probation | Over 20% | Under 60% | -30% or pause |
Termination Criteria
Some sources cannot be fixed. Establish clear criteria for termination:
- Return rates exceeding threshold for consecutive weeks
- Fraud detection rates exceeding acceptable limits
- Repeated consent documentation failures
- Pattern of invalid contact information
Enforcing termination criteria protects buyer relationships and maintains quality standards. The revenue lost from terminating a bad source is always less than the buyer relationship damage from continued poor quality.
Process Improvement Cycles
Quality control should improve over time. Build systematic review cycles that refine processes based on accumulated data.
Weekly Operational Review
Review weekly: return rates by source and buyer, validation pass rates, fraud detection rates, quality score distributions.
Monthly Strategic Review
Review monthly: source portfolio optimization, buyer relationship assessments, technology vendor performance, process adjustment needs, pricing recalibration requirements.
Quarterly Deep Analysis
Review quarterly: market and vertical trends, technology upgrade decisions, staffing and capability assessment, competitive positioning.
Quality Control Technology Stack
Building comprehensive quality control in-house requires significant engineering investment. Most practitioners leverage vendor services for some or all quality functions.
Validation Service Providers
Phone Validation: Twilio Lookup offers line type intelligence at $0.008 per lookup. Trestle (formerly Payfone) provides phone activity scoring. Melissa combines phone validation with broader data quality services. Typical costs range from $0.01-$0.05 per lead for comprehensive phone validation.
Email Validation: ZeroBounce leads in accuracy with 99%+ guarantees at $0.008-$0.01 per email at volume. NeverBounce provides fast bulk processing at $0.003-$0.008 per email. Quality validation catches spam traps, disposable addresses, and deliverability issues.
Address Validation: Smarty (SmartyStreets) offers USPS CASS-certified validation with geocoding. Loqate provides global coverage at $0.04-$0.05 per US lookup. Property data appends add $0.05-$0.15 per lookup for ownership and characteristic information.
Fraud Detection Platforms
Bot Detection: HUMAN (formerly White Ops) specializes in bot detection with 90-95% accuracy. DataDome provides real-time protection. Fraudlogix focuses specifically on lead generation verticals.
Device Intelligence: Fingerprint.js offers 99%+ device identification accuracy at $0.001-$0.01 per identification. These platforms detect emulators, identify known fraud devices, and track device reputation.
Identity Verification: Ekata (Mastercard subsidiary) provides phone, email, address, and IP analysis with machine learning fraud scoring. Plaid and Alloy verify identity elements for high-value leads. Costs range from $0.15-$2.00 per verification.
Consent Verification
TrustedForm and Jornaya dominate consent verification. TrustedForm provides session replay and consent certificates at $0.25-$0.50 per lead. Jornaya offers lead intelligence with journey tracking across publishers.
These services matter because consent documentation provides defense against TCPA litigation. A call to a consumer who never actually consented creates liability regardless of what your form recorded.
Platform Integration
Quality control technology must integrate with your lead distribution and CRM systems. Evaluate vendors on API design and documentation quality, response latency for real-time validation, reliability and uptime guarantees, volume pricing and commitment structures, and data security certifications.
Most operations spend $0.40-$0.70 total per lead for comprehensive quality control including validation, fraud detection, and consent verification. At 10,000 monthly leads, that represents $4,000-$7,000 monthly investment returning multiples in reduced returns and improved buyer relationships.
Vertical-Specific Quality Control Considerations
Quality control requirements vary significantly by vertical. Understanding these differences enables appropriate investment and prevents both under-protection and unnecessary expense.
Insurance Lead Quality Control
Insurance leads require verification of coverage status, timeline to renewal, and qualification factors. Contact rates run 55-65% average, with top performers achieving 75-85%. Return rate benchmarks: auto insurance targets 8-10%, Medicare runs 12-15%, health insurance operates at 10-15%.
Key quality checkpoints include current coverage verification, renewal timing documentation, multi-line opportunity identification, and state-specific compliance requirements. Medicare leads face additional CMS marketing compliance requirements that affect allowable outreach methods.
Mortgage Lead Quality Control
Mortgage quality centers on credit qualification, property verification, and rate sensitivity. Contact rates average 50-60%, with top performers achieving 70-80%. Return rate benchmarks run 10-14% for steady operations, potentially higher during volatile rate environments.
Quality checkpoints should verify property ownership, stated credit ranges against risk models, loan-to-value ratio reasonableness, and debt-to-income qualification likelihood. The long sales cycle (30-45 days average) means quality feedback arrives slowly, requiring patient model training.
Solar Lead Quality Control
Solar presents the highest quality control challenge due to demanding qualification requirements. Contact rates run 45-55% average, with top performers at 65-75%. Return rate benchmarks of 15-18% represent strong performance; operations above 20% struggle with profitability.
Quality verification must confirm homeownership (not just self-reported), utility bill ranges that justify solar economics, roof age and condition suitability, geographic installer coverage, and credit qualification for financing. Property data appends are essential, not optional, for solar quality control.
Legal Lead Quality Control
Legal leads maintain the lowest return rates (5-8%) due to high lead values and thorough intake processes. Contact rates run 60-70% average, with top performers achieving 80-90%.
Quality checkpoints focus on incident recency (statute of limitations), injury severity documentation, jurisdiction matching, and case type qualification. The high value of legal leads (often $100-500+) justifies comprehensive pre-qualification investment.
Home Services Lead Quality Control
Home services achieve the highest contact rates (65-75% average, 85-95% top performers) due to immediate need and local relevance. Return rate benchmarks run 8-12% for quality operations.
Quality verification emphasizes geographic service area matching, project scope qualification, homeownership or authorization confirmation, and timeline urgency assessment. Speed to contact matters particularly for home services where consumers often accept the first available provider.
Quality Control Metrics and KPIs
What you measure improves. Establishing the right quality metrics enables systematic improvement and early problem detection.
Core Quality Metrics
Return Rate: The percentage of delivered leads returned by buyers. Track overall, by buyer, by source, and by return reason. Benchmark against vertical standards. Target below 10% for most verticals; premium operations maintain below 5%.
Contact Rate: The percentage of leads where buyers successfully reach consumers. Track by source, by time of day, by line type. Target above 65% for most verticals; below 55% signals systemic problems.
Validation Pass Rate: The percentage of raw leads passing all validation checks. Track by source and by validation type. Target 70-85% overall; below 70% indicates traffic quality issues; above 85% suggests validation may be too lenient.
Fraud Detection Rate: The percentage of leads flagged by fraud detection systems. Track by source and by fraud type. Rates above 15% from any source warrant investigation; rates above 25% require source termination.
Quality Score Distribution: The distribution of predictive quality scores across your lead population. Monitor for score inflation or deflation over time. Investigate sources with unusual score distributions.
Secondary Quality Metrics
Conversion Rate: The percentage of leads that ultimately purchase from buyers. This is the ultimate quality metric but arrives with significant delay. Track by source, geography, and lead characteristics when buyer feedback allows.
Time to Close: Duration from lead delivery to customer conversion. Faster closes indicate higher intent and better qualification. Track trends for early warning of quality changes.
Buyer Retention: How long buyers continue purchasing from you. Quality problems surface as shortened buyer tenure. Track average relationship duration and reasons for termination.
Price Premium/Discount: Your pricing relative to market rates. Quality leaders command premiums; quality laggards accept discounts. Track pricing trends as quality indicator.
Monitoring Cadence
Daily: Total returns, returns by buyer, returns by source, fraud alerts, validation failures.
Weekly: Trend analysis, source quality rankings, return reason distribution, quality score calibration.
Monthly: Strategic review, source portfolio optimization, buyer relationship assessment, process improvement priorities.
Quarterly: Technology evaluation, market benchmarking, capability investment decisions, long-term quality trending.
Building a Quality Culture
Technology and process matter, but quality ultimately depends on organizational commitment. Building a quality culture requires leadership emphasis, aligned incentives, and continuous improvement mindset.
Organizational Alignment
Quality must be a leadership priority, not just an operations function. When quality metrics conflict with volume targets, leadership decisions signal true priorities. Organizations that sacrifice quality for short-term volume consistently underperform over time.
Compensation structures should align with quality outcomes. If sales teams are paid purely on lead volume, quality suffers. If operations teams are evaluated on processing speed without quality components, corners get cut. Include quality metrics in performance evaluation at every level.
Cross-Functional Coordination
Quality control requires coordination across functions. Marketing affects quality through traffic source selection and landing page design. Sales affects quality through buyer expectations and feedback collection. Operations affects quality through validation configuration and source management. Finance affects quality through pricing decisions and investment allocation.
Regular cross-functional quality reviews ensure no function optimizes at others’ expense. A marketing team driving volume through low-quality sources creates problems operations must solve. An operations team rejecting leads without marketing input may damage profitable traffic flows.
Continuous Improvement
Quality control is never finished. Fraudsters evolve their techniques. Market conditions change. Buyer expectations shift. Continuous improvement maintains quality as conditions change.
Establish formal improvement cycles. Monthly process reviews identify optimization opportunities. Quarterly technology assessments evaluate upgrade needs. Annual capability reviews guide investment priorities.
Document everything. Quality control decisions, process changes, and outcome data create organizational memory that survives personnel changes. Undocumented tribal knowledge creates fragility.
Frequently Asked Questions
What is lead quality control and why does it matter?
Lead quality control encompasses the systems, processes, and technologies that ensure leads delivered to buyers meet quality standards and convert to value. It matters because quality directly determines margins, buyer relationships, and long-term sustainability. Operations with strong quality control achieve 5-8% return rates while poor operations run 15-25% returns. That difference transforms profitability.
How much should I invest in quality control technology?
Most professional operations spend $0.40-$0.70 per lead on comprehensive quality control including validation, fraud detection, and consent verification. At 10,000 monthly leads, that represents $4,000-$7,000 monthly. The investment typically returns 400% or more through reduced returns and improved buyer pricing.
What return rate should I target for my vertical?
Return rate benchmarks vary by vertical. Auto insurance targets 8-10%. Medicare runs 12-15%. Solar operates at 15-18% for strong performers. Legal maintains 5-8%. Home services targets 8-12%. Any rate significantly above your vertical benchmark signals problems requiring investigation.
How do I improve contact rates on my leads?
Contact rates improve through multiple factors. Real-time phone verification during form submission catches bad numbers before delivery. Line type detection identifies mobile phones with higher answer rates. Speed to lead ensures buyers contact consumers while intent remains fresh. SMS verification before delivery confirms phone numbers work and consumers are responsive.
What is the difference between validation and quality control?
Validation confirms data accuracy: the phone number works, email delivers, address exists, format is correct. Quality control encompasses validation plus fraud detection, scoring, feedback integration, and source management. Validation is necessary but insufficient. A lead can pass every validation check and still represent zero value if the consumer has no purchase intent.
How do I detect sophisticated lead fraud?
Sophisticated fraud requires layered detection. IP analysis catches geographic mismatches and proxy usage. Device fingerprinting identifies fraud devices and coordinated submissions. Behavioral analysis distinguishes human from bot patterns. Velocity checking catches unnatural submission rates. No single technique catches all fraud; layered approaches provide comprehensive protection.
How quickly should I respond to quality problems?
Speed matters. When systematic quality issues emerge, pause affected sources immediately to prevent further damage. Investigate within 24-48 hours. Communicate with affected buyers proactively. Implement fixes before resuming volume. Delayed response allows problems to compound and damages relationships.
What feedback should I collect from buyers?
Essential buyer feedback includes return reasons (standardized codes), disposition data (contact outcomes, conversation results, conversion status), and quality scorecards (comparative assessment against other sources). The more detailed the feedback, the better your models become. Invest in relationships with data-rich buyers who provide comprehensive feedback.
How do I balance quality control costs with lead volume?
Quality control costs should be evaluated against returns prevented, not as a percentage of lead cost. Comprehensive quality control at $0.50 per lead that reduces returns by 10 points saves $4.00 per lead on $40 leads. The math overwhelmingly favors investment. Operations that cut quality spending to improve short-term margins consistently underperform.
When should I terminate a lead source for quality problems?
Establish clear termination criteria before problems occur. Typical thresholds include return rates exceeding 20% for two consecutive weeks, fraud detection rates above 15%, repeated consent documentation failures, or patterns of invalid contact information. Enforce criteria consistently. Short-term revenue loss from termination is always less than relationship damage from continued poor quality.
Key Takeaways
-
Quality control separates sustainable operations from those trapped in boom-bust cycles. The difference between 8% and 18% return rates transforms profitability on identical traffic.
-
Prevention catches obvious problems; detection surfaces hidden issues; remediation translates insights into improvement. All three layers are necessary for comprehensive quality control.
-
Validation confirms data accuracy but does not predict conversion. A lead can pass every technical check and still represent zero value. Predictive scoring bridges this gap.
-
Source-level tracking is essential. Aggregate metrics mask critical variation. One underperforming source can destroy overall economics while remaining invisible in blended reporting.
-
Buyer feedback provides intelligence that internal systems cannot generate. Contact rates, conversion data, and return reasons train models and reveal problems. Invest in collecting this data systematically.
-
Quality control technology costs $0.40-$0.70 per lead for comprehensive coverage including validation, fraud detection, and consent verification. The investment returns multiples through reduced returns and improved pricing power.
-
Vertical-specific quality requirements vary significantly. Solar demands comprehensive property verification. Legal requires case qualification. Insurance centers on coverage timing. Build quality processes that match your vertical’s requirements.
-
Quality culture requires organizational commitment beyond technology and process. Leadership emphasis, aligned incentives, and cross-functional coordination determine whether quality control succeeds or becomes theater.
-
Continuous improvement maintains quality as conditions change. Fraudsters evolve, markets shift, and buyer expectations change. Static quality control degrades over time; only systematic improvement maintains effectiveness.