How state-by-state net metering policies, NEM 3.0, and regulatory shifts create an 8.5x pricing spread in solar leads – and what operators need to know to capture the opportunity.
Net metering policy is the single most important variable in solar lead economics. A qualified homeowner lead in California might be worth $200 to an installer. That same lead profile in North Dakota might fetch $25. The difference is not sunshine hours or roof orientation. The difference is policy.
After fifteen years in lead generation, I have watched net metering changes move entire state markets between profitability tiers overnight. California’s NEM 3.0 implementation in April 2023 contracted that state’s residential solar market by 40% within twelve months. Arizona’s 2016 net metering reduction crushed lead values by 35%. Every state with retail-rate net metering faces utility pressure to reduce compensation, and lead generators who fail to understand these dynamics leave money on the table – or lose it entirely.
This guide breaks down net metering policy impact on solar lead value across every major market. You will learn which states offer premium lead economics, which are deteriorating, and how to position your operation for the policy changes that inevitably come.
What Is Net Metering and Why It Matters for Lead Value
Net metering is a billing mechanism that credits solar system owners for excess electricity they send to the grid. When a homeowner’s solar panels produce more electricity than they consume during the day, that excess flows to the grid and runs the meter backward. At night or during cloudy periods, they draw from the grid, running the meter forward. They pay only for the “net” difference.
The economic magic happens in the compensation rate, directly influencing CPL benchmarks. Under traditional net metering, homeowners receive credits at the full retail electricity rate – the same rate they pay for grid power. If electricity costs $0.25 per kilowatt-hour, every excess kWh exported earns $0.25 in credit. This one-to-one exchange makes solar economics compelling: produce during the day, consume at night, and effectively use the grid as a free battery.
For lead generators, net metering policy directly determines lead value through a predictable chain:
Net metering generosity → Solar payback period → Consumer willingness to buy → Installer conversion rates → Lead prices installers will pay
States with strong net metering policies have shorter payback periods, higher consumer interest, better installer close rates, and ultimately higher lead values. States with weak or eliminated net metering have extended payback periods, lower consumer enthusiasm, reduced close rates, and compressed lead values.
This is why understanding net metering policy matters more than understanding panel efficiency or installation techniques. Policy determines economics. Economics determine lead value.
The Current Net Metering Landscape: 2024-2025
As of late 2024, 34 states plus Washington D.C. and Puerto Rico have mandatory net metering rules. However, the substance of these policies varies dramatically. Some states offer full retail-rate compensation. Others have moved to wholesale-rate or “avoided cost” compensation that pays a fraction of retail rates. Still others have eliminated net metering entirely for new installations while grandfathering existing systems.
The Database of State Incentives for Renewables and Efficiency (DSIRE) tracks these policies, but the landscape changes quarterly. What matters for lead generators is understanding not just current policy, but policy trajectory – where each state is headed.
States with Strong Net Metering (Full Retail Rate or Near-Retail)
These states offer the most favorable net metering economics, translating to premium lead values:
Massachusetts maintains robust net metering with retail-rate credits for systems up to certain size thresholds. Combined with high electricity rates averaging above $0.26 per kWh and the SMART (Solar Massachusetts Renewable Target) incentive program, Massachusetts generates some of the highest solar lead values in the country. Payback periods run 5-7 years, and installer competition is intense.
New York offers net metering at retail rates for residential systems, complemented by a 25% state tax credit up to $5,000. With electricity rates exceeding $0.20 per kWh in most territories and strong environmental policy support, New York represents a Tier 1 market for solar leads. The state’s complex utility landscape (Con Edison, National Grid, PSEG, and numerous municipal utilities) creates micro-market variations that sophisticated lead generators can exploit.
New Jersey provides full retail-rate net metering with no practical residential capacity limits. High population density, strong electricity rates, and a developed installer ecosystem make New Jersey leads valuable. The state’s Successor Solar Incentive (SuSI) program adds additional compensation, further improving project economics.
Connecticut maintains retail-rate net metering for residential systems. Combined with electricity rates among the highest in the nation (often exceeding $0.25 per kWh), Connecticut offers compelling solar economics and strong lead values.
Maryland offers retail-rate net metering with annual true-up, meaning credits carry forward month-to-month. The state’s renewable portfolio standard creates additional demand drivers.
States with Transitional or Reduced Net Metering
These states have moved away from retail-rate net metering but maintain some form of compensation:
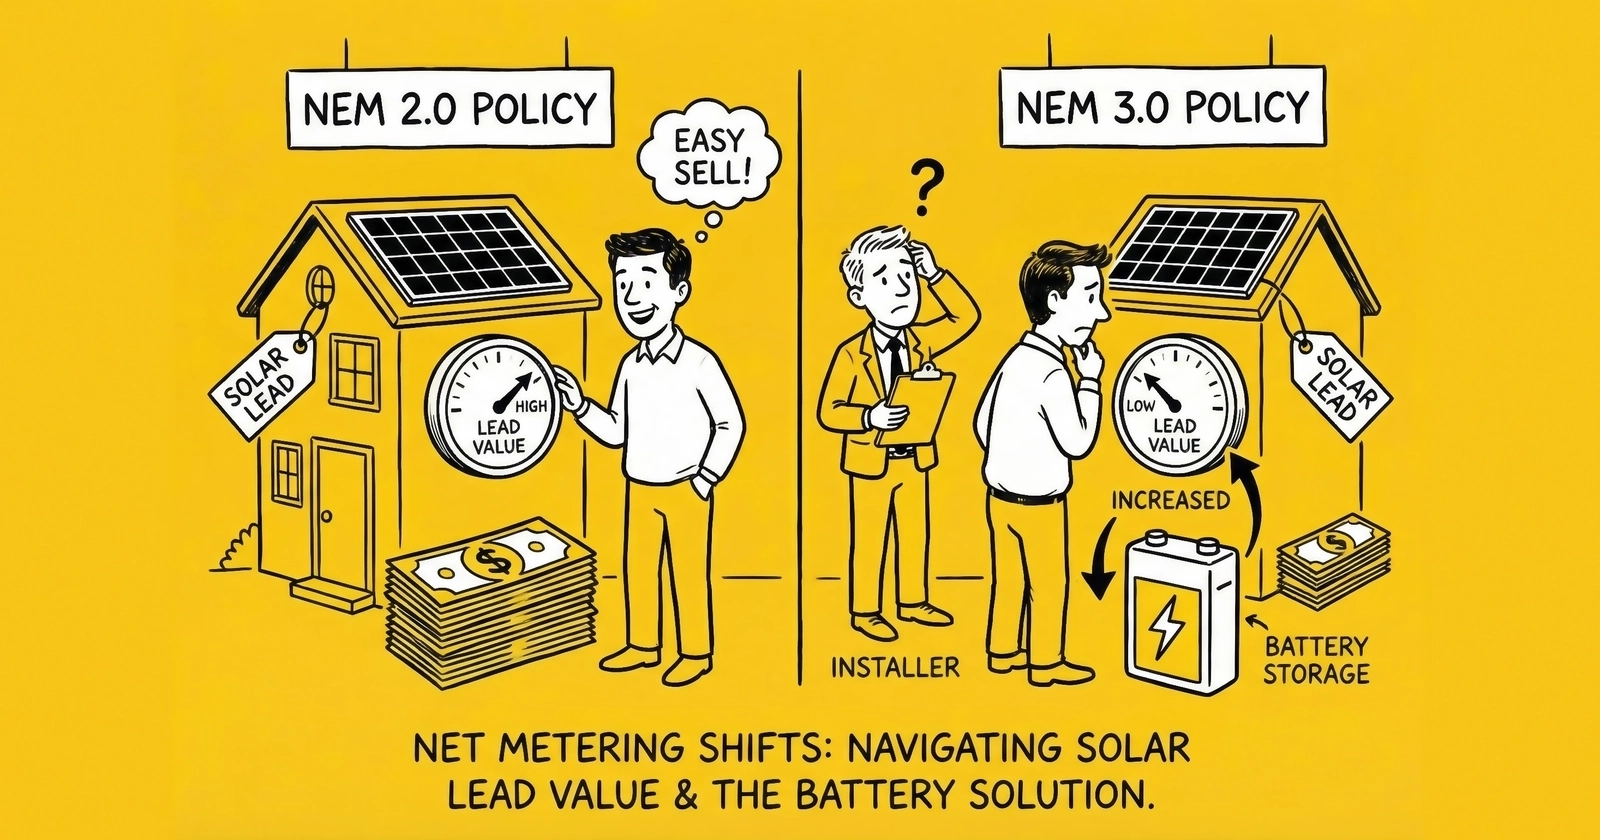
California implemented the Net Billing Tariff (commonly called NEM 3.0) on April 15, 2023. This policy replaced retail-rate net metering with export compensation based on “the value of this generation to the grid” – typically 75% lower than retail rates. A kilowatt-hour that earned $0.30 under NEM 2.0 might earn $0.05-$0.08 under NEM 3.0.
The impact was immediate and severe. Residential solar installations in California dropped 38-50% in 2024 compared to the prior year. The California Solar and Storage Association reported installer sales declines of 66-83% compared to 2022 peaks. Lead values in California compressed by 30-40%, and many lead generators who had concentrated portfolios in California suffered significant margin erosion.
However, battery attachment rates soared to 79% as the value proposition shifted from grid export to self-consumption and backup power. Leads that qualify for storage interest now command premium pricing, while solar-only leads have diminished value.
Arizona reduced net metering compensation significantly in 2016-2017, moving from retail rates to a “Resource Comparison Proxy” rate substantially below retail. The market contracted sharply, then gradually stabilized at lower volume. Arizona remains a solar market due to abundant sunshine, but lead values reflect the reduced economics.
Nevada underwent a dramatic net metering battle from 2015-2017, initially eliminating net metering (which cratered the market), then partially restoring it through legislation. Current policy provides reduced compensation that varies by utility and vintage.
Hawaii offers perhaps the most complex case. As an island state with the highest electricity rates in the nation (often exceeding $0.40 per kWh), Hawaii should be the most attractive solar market. However, grid integration challenges and utility resistance have created a patchwork of programs – Customer Grid Supply, Smart Export, and various legacy tariffs – that complicate lead qualification. Despite these challenges, Hawaii leads remain premium due to the underlying electricity economics.
States with Minimal or No Net Metering
These states offer limited or no net metering, typically compensating exported solar at wholesale or “avoided cost” rates:
Texas has no statewide net metering requirement. Some retail electricity providers offer credits, but rates vary dramatically. The ERCOT competitive market structure means solar economics depend heavily on the specific retail provider. Despite this, Texas installed more total solar capacity than any other state in the first half of 2024, driven primarily by utility-scale projects. Residential solar faces challenges but remains viable in territories with favorable retail plans.
Idaho eliminated retail-rate net metering in 2021, moving to compensation based on avoided cost – typically a fraction of retail rates. Lead values declined accordingly.
South Dakota, North Dakota, Wyoming offer minimal net metering with no meaningful state incentives. Combined with low electricity rates (often below $0.12 per kWh), these states represent Tier 4-5 markets where solar lead generation is generally unprofitable.
California NEM 3.0: A Case Study in Policy Impact
California’s transition from NEM 2.0 to NEM 3.0 (officially the Net Billing Tariff) provides the clearest illustration of how net metering policy affects solar lead value. Understanding this transition helps predict impacts when other states make similar changes.
What NEM 3.0 Changed
Under NEM 2.0, California homeowners received retail-rate credits for exported solar power. A homeowner paying $0.30 per kWh for electricity received $0.30 in credits for each kWh exported. This made the grid function as a free battery – produce during the day, use credits at night.
NEM 3.0 replaced retail-rate credits with “avoided cost” compensation that reflects the value of exported solar to the grid at the time of export. Because California has abundant midday solar, the value of additional solar during peak production hours is minimal. Export compensation under NEM 3.0 typically ranges from $0.04-$0.08 per kWh during midday – 75-85% less than retail rates.
The policy also introduced time-of-use rate structures that charge higher rates during evening hours (when solar produces nothing) and lower rates during midday (when solar produces the most). This double impact – reduced export value and higher consumption charges during non-production hours – fundamentally altered project economics.
The Economic Impact
Under NEM 2.0, a typical California solar installation had a payback period of 5-6 years. Under NEM 3.0, that same installation – without battery storage – has a payback period of 14-15 years. This more than doubles the time homeowners must wait to recoup their investment.
The market response was predictable. Residential solar installations in California declined sharply:
- Q2 2024 marked the lowest residential installation quarter since Q2 2021
- California volumes dropped 41% in 2024 compared to 2023
- Multiple installers laid off substantial portions of their workforce
- Some regional installers exited the California market entirely
For lead generators, the impact was severe. California had been the largest and most valuable solar lead market in the nation. A California-concentrated lead generation operation might have seen:
- Lead volumes decline 30-40% as consumer interest dropped
- Lead prices decline 20-30% as buyer demand fell
- Buyer churn increase as installers reduced marketing or exited the market
- Margin compression from both volume and price declines
The Storage Opportunity
NEM 3.0 did not kill the California solar market – it transformed it. With grid export values reduced, the value proposition shifted to self-consumption. Battery storage allows homeowners to store excess daytime production and use it during expensive evening hours, bypassing the low export rates.
Battery attachment rates in California soared to 79% of new installations. Solar-plus-storage systems under NEM 3.0 can achieve payback periods closer to 8-10 years, making the economics more reasonable (though still less attractive than NEM 2.0 solar-only).
California Assembly Bill 942: Forced Migration Risk (May 2025)
AB 942, passed in May 2025, introduces significant risk for legacy solar customers in California. The bill could force NEM 1.0 and NEM 2.0 customers to migrate to NEM 3.0 rates after 10 years of their original interconnection.
What This Means:
- Homeowners who installed solar in 2015 or earlier could lose grandfathered rates
- Migration to NEM 3.0 would reduce their export compensation by 75%+
- Systems designed for grid export without batteries become economically challenged
Lead Generation Implications:
- Creates potential new market for battery retrofits to existing NEM 1.0/2.0 systems
- Reinforces battery-first messaging for all California solar leads
- Legacy solar customers become prospects for storage upgrades
- Timeline visibility: first forced migrations could occur 2025-2026
Current NEM 3.0 Export Rate Reality: Export rates under NEM 3.0 range from $0.00 to $3.50/kWh across 576 possible rate combinations. Peak value windows include summer evenings (6-9 PM) at up to $3.50/kWh, while midday peak solar production hours often yield only $0.04-0.08/kWh.
Homeowners with battery storage can capture $200+ weekly during high-value export windows by storing daytime production and discharging during evening peaks. This arbitrage opportunity is central to NEM 3.0 economics.
For lead generators, this means California leads now require storage qualification. A solar-only lead in California has diminished value. A solar-plus-storage lead – where the homeowner expresses interest in battery backup, has adequate budget, and understands the value proposition – commands premium pricing.
Lead forms targeting California should include storage qualification questions using multi-step form design:
- Interest level in battery backup for power outages
- Awareness of time-of-use rate structures
- Budget expectations that reflect storage addition ($15,000-$25,000 additional cost)
- Existing utility account confirmation (critical for accurate savings estimates)
Lessons for Other Markets
California’s NEM 3.0 transition offers templates for what to expect when other states reduce net metering:
Lead value declines 20-40% in the 12-18 months following implementation, as buyer demand adjusts to new economics.
Volume declines 30-50% as consumer interest drops with extended payback periods.
Storage attachment becomes critical as the value proposition shifts from export to self-consumption.
Market eventually stabilizes at lower volumes but rational economics, typically 18-24 months post-implementation.
Pre-announcement surge creates temporary demand spike as consumers race to lock in existing rates. Lead generators who anticipate policy changes can capture premium pricing during this window.
States likely to follow California’s path – those with high solar penetration and utility pressure to reduce compensation – include Arizona (already transitioned), Nevada, Hawaii, and potentially Massachusetts, New York, and New Jersey. Monitoring Public Utility Commission proceedings in these states provides early warning of changes.
State-by-State Lead Value Tiers
For practical lead generation purposes, states cluster into five tiers based on net metering policy, electricity rates, installer density, and overall lead value:
Tier 1: Premium Markets ($150-$300+ per lead)
- California (post-NEM 3.0, storage-qualified leads only)
- Hawaii (highest electricity rates, complex programs)
- Massachusetts (strong policy, high rates, SMART incentives)
- New York (retail net metering, state tax credit, high rates)
These markets justify premium lead pricing because installers can afford high customer acquisition costs and still profit. Lead generators should focus on quality over volume – stringent qualification, utility bill verification, storage qualification where applicable.
Tier 2: Strong Markets ($100-$150 per lead)
- New Jersey (retail net metering, high density, SuSI program)
- Connecticut (retail net metering, high rates)
- Maryland (retail net metering, RPS support)
- Rhode Island (retail net metering, high rates)
- Florida (growing market, strong fundamentals despite no state incentives)
These markets offer solid unit economics. Installers compete actively for leads, and quality differentiates premium from commodity suppliers.
Tier 3: Developing Markets ($50-$100 per lead)
- Texas (no statewide policy, varies by retail provider)
- Arizona (reduced net metering, high irradiance)
- Nevada (reduced net metering, growing market)
- Colorado (environmental consciousness, moderate rates)
- Illinois (growing market, adjustable block program)
- Virginia, Georgia, North Carolina, South Carolina (developing markets)
These states represent growth opportunities with less competition. Lead costs are lower, but close rates may also be lower due to less mature installer operations.
Tier 4: Emerging Markets ($25-$50 per lead)
- Most Midwest states (low electricity rates, limited policy support)
- Mountain states outside Colorado and Arizona
- Parts of the Southeast
Low electricity rates and minimal policy support make solar economics challenging. Lead generation is possible but requires extremely low traffic acquisition costs.
Tier 5: Minimal Markets (Generally unprofitable)
- North Dakota, South Dakota, Wyoming (low rates, minimal sunshine, no policy support)
- Parts of Appalachia (low rates, challenging roof stock)
Even if leads are nearly free to generate, installer appetite is minimal. These markets are generally not worth targeting.
The 8.5x Spread
At the extremes, this creates an 8.5x pricing spread. A lead that generates $1,929 in customer lifetime value in California might yield $225 in North Dakota. The difference reflects:
- Electricity rates: California averages $0.25+ per kWh; North Dakota averages $0.10 per kWh
- Net metering policy: California has structured programs; North Dakota has minimal support
- State incentives: California has various programs; North Dakota has none
- Installer density: California has hundreds of competing installers; North Dakota has a handful
- Customer sophistication: California homeowners understand solar; North Dakota homeowners need education
Lead generators who sell national leads at uniform pricing leave money on the table. State-level (and ideally utility-level) pricing captures the true value variation – a concept that applies to lead distribution strategies more broadly.
Net Metering Trends: What Is Coming
Net metering policy is in flux nationwide. Understanding directional trends helps lead generators position for future markets.
Utilities Are Pushing for Reductions
Utilities argue that net metering shifts costs from solar customers to non-solar customers. When solar customers reduce their grid consumption through self-generation and receive retail-rate credits for exports, they pay less toward grid infrastructure that they still rely on during non-production hours. Utilities claim non-solar customers subsidize this infrastructure.
This “cost shift” argument has driven successful utility campaigns to reduce net metering in California, Arizona, Nevada, Hawaii, and other states. Similar campaigns are underway in Massachusetts, New York, and other strong net metering states.
Lead generators should monitor:
- Public Utility Commission dockets in key states for net metering-related proceedings
- Utility rate case filings that often include proposals to modify solar compensation
- State legislative sessions where net metering bills may be introduced
- SEIA and state solar association alerts that track policy developments
The Move to Net Billing
The trend is toward “net billing” – compensation at wholesale or avoided-cost rates rather than retail rates. California’s NEM 3.0 is a net billing structure. Other states are likely to follow.
Under net billing, solar economics depend heavily on self-consumption. Systems sized to match household load (producing what the home consumes) retain value. Oversized systems that export heavily lose value as export compensation declines.
This shift affects lead qualification. Lead generators should capture:
- Electricity consumption patterns (high users benefit more from self-consumption)
- Battery storage interest (essential for maximizing self-consumption)
- Time-of-use rate awareness (affects which hours matter most)
- Budget expectations (storage adds significant cost)
Fixed Charges and Grid Access Fees
Beyond net metering itself, utilities are implementing fixed charges for solar customers. California approved monthly fixed charges up to $24.15 for solar customers in May 2024, even for those with $0 usage bills. Other states are considering similar structures.
Fixed charges reduce solar savings by ensuring solar customers continue paying grid infrastructure costs. A $25 monthly fixed charge represents $300 annually that solar cannot offset, extending payback periods regardless of net metering policy.
The Federal Landscape
At the federal level, the Investment Tax Credit (ITC) provides a 30% tax credit for residential solar installations through 2032, with gradual step-downs thereafter. This federal incentive partially offsets state-level net metering reductions. However, federal policy can change, and lead generators should monitor legislative developments.
Practical Strategies for Lead Generators
Understanding net metering policy is only valuable if it translates to operational strategy. Here are concrete approaches for lead generation operations.
Geographic Portfolio Management
Diversify across net metering policy environments, applying lead source diversification principles. A portfolio concentrated in a single state – especially one with pending net metering changes – carries significant policy risk. Target allocation might include:
- 25-30% Tier 1 markets (premium value, higher competition)
- 35-40% Tier 2 markets (solid economics, good volume)
- 25-30% Tier 3 markets (growth opportunity, lower CPL)
- Minimal exposure to Tier 4-5 markets unless traffic is essentially free
Rebalance when policy changes occur. When California announced NEM 3.0, smart practitioners began shifting traffic to Texas, Florida, and the Northeast months before implementation.
Utility-Level Targeting
Net metering policies vary not just by state but by utility. Within California, three major investor-owned utilities (PG&E, SCE, SDG&E) each have distinct tariff structures, export schedules, and customer economics. Municipal utilities like LADWP and SMUD operate under entirely separate rules.
Lead generators who understand utility-level nuance can:
- Route traffic to highest-value territories within states
- Adjust qualification questions based on utility-specific programs
- Price leads differently based on utility-level economics
- Identify pockets of premium value within otherwise average states
Building utility-to-ZIP-code mapping enables this granularity. The technical investment pays dividends in margin improvement.
Policy Monitoring Systems
Build or subscribe to systems that track:
- Public Utility Commission filings in key states
- State legislative bill tracking for solar-related legislation
- Utility rate case proceedings
- Industry association policy alerts
- Trade publication coverage of regulatory developments
Lead value can shift 30% in 90 days based on policy changes. Early warning enables proactive positioning rather than reactive scrambling.
Quality Verification Investment
In a market where net metering policies create complex economics, lead quality matters more than ever. Invest in:
- Ownership verification: Property database matching to confirm homeowner status ($0.50-$2.00 per lead)
- Utility bill validation: Confirm consumption levels and rate structures (friction adds quality)
- Storage qualification: In NEM 3.0 and similar markets, storage interest is mandatory
- Credit pre-qualification: Soft credit indicators to filter unlikely buyers, following lead quality scoring principles
- Property assessment: Roof age, orientation, and shading verification
The extra $3-$8 per lead for comprehensive verification pays for itself through higher buyer close rates and lower return rates.
Storage Integration
As net metering policies shift toward net billing, storage becomes essential to solar economics. Lead generators should:
- Add storage qualification questions to all forms
- Educate traffic sources about storage value proposition
- Build buyer relationships with installers who offer storage
- Price storage-qualified leads at appropriate premiums
- Track storage attachment rates as a quality metric
In California, a solar-only lead might be worth $50-$75. A solar-plus-storage qualified lead might be worth $150-$200. The qualification effort drives significant value.
Pre-Policy-Change Positioning
When net metering changes are announced but not yet implemented, lead demand typically surges as consumers race to lock in existing rates. This creates temporary premium windows.
Strategies to capture these windows:
- Build rapid-response traffic scaling capability
- Maintain relationships with installers who can absorb surge volume
- Develop “deadline-aware” creative that emphasizes policy change urgency
- Pre-position inventory through extended nurture sequences
- Adjust pricing to capture premium willingness-to-pay
The California NEM 3.0 transition created 6-9 months of elevated demand before the April 2023 effective date. Practitioners who positioned early captured premium revenue.
Frequently Asked Questions
What is net metering and how does it affect solar lead value?
Net metering is a billing mechanism that credits solar system owners for excess electricity they send to the grid. Under traditional net metering, homeowners receive credits at the full retail electricity rate. This makes solar economics compelling – shorter payback periods, higher consumer interest, better installer close rates, and ultimately higher lead values. When net metering is reduced or eliminated, payback periods extend, consumer interest declines, and lead values drop accordingly. States with strong net metering policies (Massachusetts, New York, New Jersey) generate lead values 3-5x higher than states with minimal net metering (North Dakota, South Dakota).
How did California’s NEM 3.0 impact solar lead values?
California’s NEM 3.0 (Net Billing Tariff), implemented April 15, 2023, reduced export compensation by approximately 75% compared to the prior NEM 2.0 policy. This extended solar payback periods from 5-6 years to 14-15 years for systems without battery storage. The market impact was severe: residential installations dropped 38-50% in 2024, lead values compressed 30-40%, and numerous installers reduced operations or exited the market. However, battery attachment rates surged to 79%, creating a new premium category for solar-plus-storage qualified leads.
Which states have the best net metering policies for solar lead generation?
As of late 2024, the states with the strongest net metering policies include Massachusetts, New York, New Jersey, Connecticut, and Maryland. These states offer full retail-rate net metering credits, high electricity rates (often exceeding $0.20-$0.25 per kWh), and additional state incentives. Lead values in these Tier 1 markets typically range from $150-$300 or higher for qualified leads. States with reduced net metering (California post-NEM 3.0, Arizona) require storage qualification to maintain premium values.
What is the difference between net metering and net billing?
Traditional net metering provides credits at the full retail electricity rate – if you pay $0.30 per kWh for electricity, you receive $0.30 in credits for each kWh exported. Net billing, by contrast, compensates exports at wholesale or “avoided cost” rates, typically far below retail rates. California’s NEM 3.0 is a net billing structure, where export compensation might be $0.04-$0.08 per kWh compared to retail rates of $0.30 or more. Net billing economics require battery storage to maximize self-consumption and minimize low-value exports.
How should lead generators prepare for net metering policy changes?
Lead generators should implement policy monitoring systems that track Public Utility Commission filings, state legislative developments, and utility rate cases in key markets. When policy changes are announced, shift traffic acquisition to unaffected states, adjust qualification criteria to include storage where applicable, and capture premium pricing during the pre-implementation surge period. Geographic diversification across multiple net metering policy environments reduces risk when any single state implements changes.
Why does solar lead value vary so much by state?
Solar lead value varies by 8.5x across states due to the convergence of five factors: electricity rates (higher rates mean faster payback), net metering policy (stronger policy means better credits), state incentives (additional programs improve economics), installer density (competition affects buyer demand), and customer sophistication (educated consumers close faster). California generates lead values around $1,929 per sale while North Dakota yields approximately $225 – reflecting the cumulative impact of these factors.
What role does battery storage play in solar lead qualification post-NEM 3.0?
In markets with net billing policies like California’s NEM 3.0, battery storage transforms solar economics. Without storage, export compensation is minimal, and payback periods extend to 14-15 years. With storage, homeowners can store excess daytime production and use it during expensive evening hours, achieving payback periods closer to 8-10 years. Battery attachment rates in California reached 79% of new installations. Lead generators targeting these markets should include storage qualification questions – interest level, backup power needs, budget expectations – and price storage-qualified leads at appropriate premiums (often 2x solar-only values).
How do I determine which utility territory a lead is in?
Utility-to-ZIP-code mapping enables territory identification. Most states publish service territory maps through their Public Utility Commissions, and third-party data providers offer ZIP-to-utility matching. Within California, PG&E, SCE, SDG&E, LADWP, and SMUD each have distinct economics. Lead qualification should capture utility information through address-based lookup or explicit questions about the electric provider. This granularity enables utility-level pricing that captures value variation within states.
What happens to solar lead markets when the federal tax credit changes?
The federal Investment Tax Credit (ITC) provides a 30% tax credit for residential solar, currently extended through 2032 with gradual step-downs thereafter. Any reduction or elimination of the ITC would significantly impact solar economics – removing the 30% credit increases effective system cost by that amount, extending payback periods by approximately 30%. Lead volumes and values would decline in proportion to the economic impact. When the ITC was scheduled to step down in 2016, markets experienced surge-and-crash dynamics that sophisticated lead generators anticipated and captured.
Should I target states with declining net metering or avoid them entirely?
The answer depends on your operational capabilities. States with declining net metering (like California post-NEM 3.0) still offer opportunity for lead generators who adapt. Storage qualification, utility-level targeting, and premium positioning can maintain profitability despite policy headwinds. However, these markets require more sophisticated operations – quality verification, storage-focused messaging, and buyer relationships with full-service installers. Lead generators seeking simpler operations might focus on stable net metering states (Massachusetts, New York, New Jersey) where the traditional value proposition remains intact.
Key Takeaways
Net metering policy is the primary determinant of solar lead value, creating an 8.5x pricing spread from premium markets like California and Massachusetts to minimal markets like North Dakota.
California’s NEM 3.0 implementation provides a template for how net metering reductions affect lead markets: 30-40% value compression, 40-50% volume decline, and a shift toward storage-qualified leads commanding premium pricing.
State-by-state lead value tiers range from Tier 1 markets ($150-$300+ per lead) with strong net metering and high electricity rates to Tier 5 markets that are generally unprofitable regardless of lead acquisition cost.
The industry trend is toward net billing – compensation at wholesale rather than retail rates – driven by utility pressure and cost-shift arguments. States currently offering retail-rate net metering face ongoing pressure to reduce compensation.
Geographic diversification across net metering policy environments reduces risk when any single state implements changes. Policy monitoring systems that track PUC filings and legislative developments provide early warning of value shifts.
Storage qualification becomes mandatory in net billing markets, transforming lead value propositions from grid export to self-consumption and backup power. Battery attachment rates approaching 80% in affected markets demonstrate this shift.
Quality verification investment ($3-$8 per lead for ownership verification, utility bill validation, and storage qualification) pays dividends through higher buyer close rates and lower return rates in a complex policy environment.
Utility-level targeting within states captures value variation that state-level pricing misses. Within California alone, five major utilities have distinct tariff structures and customer economics.
Pre-policy-change positioning captures premium pricing windows when net metering changes are announced but not yet implemented. The 6-9 month window before California’s NEM 3.0 effective date created significant opportunity for prepared operators.
The solar lead market rewards operators who combine geographic intelligence, policy awareness, and quality discipline. Those who treat net metering as a static backdrop rather than a dynamic variable will learn expensive lessons as policies continue evolving.
This article is part of The Lead Economy book series. For comprehensive coverage of solar lead generation, geographic arbitrage strategies, and vertical-specific playbooks, see Chapter 48: Solar Leads – Geographic Arbitrage at Scale.