The choice between Pay Per Lead (PPL) and Cost Per Acquisition (CPA) pricing determines who bears financial risk, how quality gets measured, and ultimately whether your lead generation campaigns succeed or fail. PPL dominates consumer-focused industries like insurance and mortgage where high-volume lead flows and strong sales teams can convert prospects efficiently, while CPA gains traction in e-commerce and enterprise B2B where longer conversion windows and higher-value transactions justify the model’s complexity.
This distinction matters more than ever as the lead generation market approaches $6.4 billion globally with projections reaching $32 billion by 2035. New FCC regulations, evolving fraud tactics, and AI-powered qualification systems are reshaping how buyers and sellers structure these agreements. Understanding the mechanics, risks, and strategic implications of each model has become essential knowledge for anyone operating in performance marketing. For foundational context, see our guide to how the lead economy works.
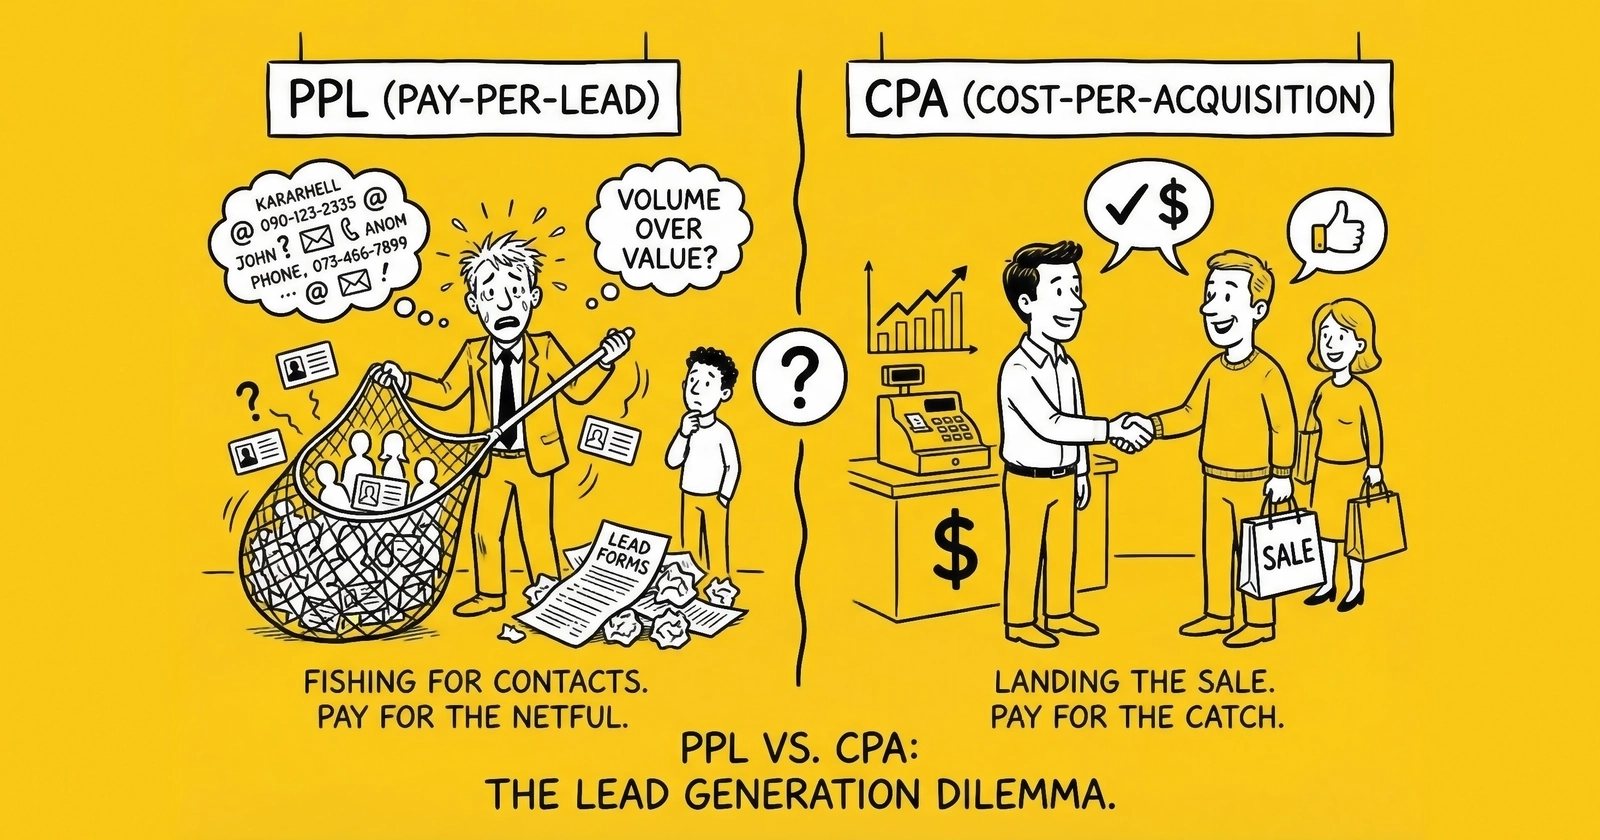
Defining PPL and CPA: fundamental philosophical differences
Pay Per Lead compensates publishers when a prospect submits contact information indicating interest – a form fill, quote request, webinar registration, or content download. The advertiser receives a name, email, phone number, and qualifying data, then assumes responsibility for nurturing that prospect toward a sale. Payment triggers upon lead delivery, regardless of whether that lead ever converts to revenue.
Cost Per Acquisition shifts the trigger point further down the funnel. Publishers receive payment only when the prospect completes a defined action – typically a purchase involving a credit card transaction, but sometimes an app installation, subscription activation, or funded account. The publisher funds the entire customer journey from awareness through conversion, accepting greater risk in exchange for higher per-action payouts.
The critical distinction lies in where risk transfers between parties. In PPL arrangements, lead generators receive faster payment with lower risk exposure since they’re compensated for generating interest rather than closing sales. Advertisers bear the conversion risk but gain access to prospect data they can nurture over time. CPA inverts this dynamic – publishers absorb conversion risk while advertisers achieve better ROI alignment, paying only for actual customers.
Wikipedia classifies PPL as technically a subset of CPA, noting that “Pay per lead is a form of cost per acquisition, with the ‘acquisition’ in this case being the delivery of a lead.” Industry practitioners, however, treat them as distinct models serving different strategic purposes.
Payment mechanics and validation processes
PPL payments trigger when leads pass through validation filters – email syntax verification, phone number authentication, IP address analysis, duplicate detection, and fraud screening. Lead management platforms like LeadConduit and boberdoo execute these checks in milliseconds, accepting or rejecting submissions in real-time before routing qualified leads to buyers.
Validation in PPL environments typically includes:
- Real-time email deliverability verification
- Phone number format validation and carrier lookup
- Address standardization against USPS databases
- IP reputation scoring and geographic verification
- Duplicate detection against suppression lists
- TCPA consent certificate verification via TrustedForm or Jornaya
CPA validation extends across longer timeframes. Sales remain in “pending” status throughout return windows – typically 30 to 90 days depending on industry – before commissions finalize. Chargebacks, returns, and fraudulent transactions trigger clawbacks. This extended validation period protects advertisers from paying for conversions that reverse but creates cash flow challenges for publishers.
Attribution in both models relies increasingly on server-to-server postback tracking rather than cookie-based pixels. Browser privacy restrictions in Safari and Firefox, combined with ad blocker proliferation, have made client-side tracking unreliable. Modern implementations pass unique click identifiers through the conversion funnel, firing server-side postbacks when leads or acquisitions occur.
Historical evolution: the shift toward performance accountability
The conceptual foundations of performance marketing predate the internet – commission-based referral programs for insurance sales, direct selling organizations like Avon and Tupperware, and print media’s occasional “per inquiry” arrangements all operated on pay-for-results principles. Digital channels transformed these concepts into scalable, trackable systems.
Key milestones shaped today’s landscape:
William J. Tobin pioneered internet marketing in 1989 through PC Flowers & Gifts on the Prodigy network, later patenting affiliate tracking technology in 1996 (granted as U.S. Patent #6,141,666 in 2000). CDNow launched the BuyWeb affiliate program in November 1994. Amazon’s Associates Program debuted in 1996, fundamentally legitimizing affiliate marketing and establishing CPA as a mainstream acquisition channel.
Commission Junction (now CJ Affiliate) and LinkShare (now Rakuten) launched in 1998, creating infrastructure for affiliate networks. By that year, Amazon reported over 2 million affiliates participating in its program. Google AdWords launched in October 2000, introducing pay-per-click as a bridge between impression-based and action-based models.
A pivotal 2007 IBM research study found two-thirds of senior marketers expected 20% of advertising revenue to shift from impression-based to action-based models within three years. A concurrent Doubleclick Performics report showed cost-per-click prices rising 33-55%, accelerating interest in CPL alternatives that offered more predictable economics.
Today’s market reflects this evolution: 80% of affiliate programs use revenue share or pay-per-sale models, 19% use CPA, and less than 1% in mature markets rely on impression-based pricing. The lead generation segment specifically favors PPL in high-volume consumer verticals while CPA dominates transactional e-commerce.
Industry verticals: model preferences based on economics
Insurance leads command premium pricing across all lines
Insurance overwhelmingly favors PPL models. Well-established aggregators like EverQuote, QuoteWizard, and SmartFinancial have built infrastructure specifically for high-volume lead distribution. The industry’s standardized qualification criteria – vehicle information for auto, health status for medical, property details for home – enable efficient lead scoring and routing.
Current insurance lead pricing reflects significant variation by exclusivity:
| Lead Type | Shared Price | Exclusive Price |
|---|---|---|
| Auto Insurance | $8-$49 | $25-$100+ |
| Health Insurance (Aged 30+) | $0.75-$3.00 | - |
| Health Insurance (Fresh) | - | $10-$50 |
| Life Insurance | $30-$85 | $100+ |
| Medicare | $15-$40 | $50-$150 |
| Home Insurance | $10-$35 | $30-$80 |
The consistent pattern: exclusive leads cost 2-4x more but close at rates up to 5x higher than shared leads. For detailed analysis of when exclusive leads justify their premium, see our guide on whether exclusive lead buying is worth it.
Mortgage and lending: volume versus regulatory complexity
Mortgage lead generation operates primarily on PPL with growing CPA use for exclusive arrangements. Fresh exclusive mortgage leads command $100-$300+ while aged leads (30-90 days) cost just $2-$8. Rate table leads from platforms like Zillow and Bankrate typically price at $100-$150.
The industry faces significant regulatory transition. The FCC’s proposed “one-to-one consent” requirement – which would have required separate consent for each marketing partner rather than blanket consent – was struck down by the 11th Circuit Court of Appeals in January 2025. However, state-level regulations continue evolving, and industry best practices increasingly favor one-to-one consent regardless of federal requirements.
Legal services: the highest-value lead vertical
Personal injury leads represent the premium end of the lead generation market, with costs ranging from $300-$1,500 for auto accident cases. Mass tort leads price at $300-$1,000+, while lower-complexity practice areas like bankruptcy run $40-$150. Google Ads cost-per-click for personal injury keywords averages $70-$250, driving blended CPL figures to $600-$1,000 in competitive markets.
Legal lead generation frequently incorporates hybrid arrangements combining PPL with revenue share – typically 10-35% of legal fees or settlements – for high-value cases. This structure aligns incentives and shares upside when cases result in substantial recoveries.
Home services: pricing reflects job complexity and seasonality
HVAC leads exemplify the home services pattern: exclusive leads cost $20-$120 depending on job type while shared leads run $8-$49 with distribution to up to four providers. Roofing leads range $150-$500, solar averaging approximately $196 with customer acquisition costs reaching $0.43 per watt (roughly $3,000 for a typical 7kW system).
| Service Type | Shared Lead | Exclusive Lead | Conversion Rate | Margin |
|---|---|---|---|---|
| Emergency HVAC/Plumbing | $8-$35 | $30-$80 | 12-16% | 25-30% |
| Roofing | $50-$150 | $150-$500 | 6-10% | 35-40% |
| Solar Installation | $75-$150 | $150-$250 | 3-5% | 20-30% |
| Kitchen Remodel | $40-$100 | $100-$300 | 4-8% | 35-40% |
Emergency services like plumbing and HVAC repair deliver the highest conversion rates at 12-16%, while premium jobs like kitchen remodels and roofing show 35-40% margins despite higher lead costs. Sales cycles for major installations average 60 days.
B2B lead generation operates across multiple pricing models
B2B environments use CPL, cost-per-appointment (CPA), and monthly retainers interchangeably. CPL pricing ranges from $30-$400+ depending on qualification level, while cost-per-appointment typically runs $150-$250. Monthly retainers span from $500-$1,000 for basic services to $10,000-$25,000+ for enterprise programs.
Industry-specific CPL benchmarks reveal substantial variation:
| Industry | Average CPL Range |
|---|---|
| B2B SaaS | $164-$310 |
| IT Services | $501-$617 |
| Cybersecurity | $404-$411 |
| Manufacturing | $415-$691 |
| Higher Education | $982+ (paid channels exceed $1,260) |
Risk distribution: which model fits your business
PPL places conversion risk squarely on buyers
In PPL arrangements, lead generators bear upfront marketing costs – advertising spend, content creation, traffic generation – but receive payment upon lead delivery regardless of downstream conversion. The buyer assumes primary financial risk, paying for leads that may never generate revenue. According to research from FasterCapital, “Since payment occurs only when a lead is generated, the risk lies with the advertiser.”
This risk distribution makes PPL attractive for sellers with strong traffic generation capabilities but limited ability to influence post-lead activities. It benefits buyers with robust sales teams capable of converting raw leads into customers, as their internal conversion rate determines final ROI.
CPA shifts risk upstream to publishers
CPA inverts the risk equation. Publishers must fund the entire sales funnel – from impression through conversion – before receiving payment. This requires higher risk tolerance and longer cash flow cycles. However, buyers achieve better ROI alignment since they only pay for actual customers.
The extended validation periods in CPA create additional complexity. A sale might appear successful initially but reverse through returns or chargebacks weeks later, triggering commission clawbacks. Publishers operating CPA programs must maintain reserves against such reversals.
Quality considerations favor CPA but require patience
CPA leads demonstrate higher average quality by definition – they’ve already converted, indicating genuine intent. PPL leads require additional qualification since form submission doesn’t guarantee purchasing intent. Industry benchmarks suggest only 27% of generated leads ever get contacted by sales and 79% of marketing leads never convert due to process failures rather than lead quality issues.
Lead quality metrics in PPL environments include decision-maker contact rates (benchmark: 30%), meaningful conversation rates (14.5%), and appointment conversion rates (9.25%). These downstream metrics determine whether PPL economics work for specific buyers.
Fraud: asymmetric challenges across models
PPL faces higher fraud exposure due to lower completion barriers
The lead generation industry loses approximately $1.4 billion annually to fake leads and bot form submissions. PPL faces greater fraud exposure than CPA because form fills present lower barriers than completed purchases. Bots can submit realistic-looking lead data – sometimes using scraped real consumer information – at scale.
Common PPL fraud patterns include:
- Bot-submitted forms with real scraped consumer data
- Incentivized leads from users paid to submit without genuine interest
- Click farms employing human fraudsters
- Duplicated leads sold multiple times
- Aged data submitted as fresh leads
According to ClickPatrol research, “This type of fraud is prevalent in pay-per-lead and affiliate marketing campaigns” because bots containing real consumer data make detection difficult.
The TCPA implications compound this problem: every bot-submitted lead that gets called represents a potential $1,500 violation since no valid prior express written consent exists when a human didn’t complete the form. This creates substantial compliance exposure for lead buyers.
CPA fraud centers on transaction manipulation
CPA fraud takes different forms – cookie stuffing for fraudulent attribution, fake purchases followed by chargebacks, trial signups with no intent to convert, and return abuse where actions complete then reverse. While potentially more damaging per incident, CPA fraud typically occurs at lower volumes than PPL fraud.
Detection methods span both models: IP monitoring for proxy/VPN usage, device fingerprinting for repeated patterns, behavioral analysis for non-human interactions, velocity checks for suspicious submission rates, and honeypot fields that bots fill but humans never see. Platforms like TrustedForm offer bot detection capabilities that examine session certificates for fraudulent patterns.
Recent data from Spider AF indicates that up to 51.8% of ad budgets face impact from ad fraud, with 78% of detected invalid traffic classified as “Sophisticated Invalid Traffic” that evades basic detection. Bots have overtaken humans as the largest percentage of web traffic for the first time in history.
TCPA compliance: existential risk for lead buyers
The Telephone Consumer Protection Act establishes $500 penalties per violation for standard infractions and $1,500 for willful violations – with no cap on total liability. National Do Not Call Registry violations can reach $43,792 per incident. These uncapped statutory damages have produced landmark settlements: ViSalus faced a $925 million verdict for 2 million robocalls without consent, Dish Network paid $280 million for registry violations, and Capital One settled for $75 million.
New FCC consent revocation rules took effect in 2025
While the 11th Circuit struck down the FCC’s one-to-one consent requirement, new consent revocation rules became effective April 11, 2025. Consumers can now revoke consent through “any reasonable method” – SMS, email, voicemail, live calls, or social media. Organizations must process opt-outs within 10 business days (reduced from 30) and may send only one confirmation message within 5 minutes containing no marketing content.
State regulations add compliance complexity
| State | Key Requirements | Penalties |
|---|---|---|
| California (CCPA/CPRA) | $25M+ revenue, 50K+ CA consumers, or 50%+ revenue from data | $2,500/violation, $7,500 intentional |
| Florida (FTSA) | Private lawsuit rights, enhanced consumer protections | Statutory damages + attorney fees |
| New Jersey | Consumer Fraud Act applicability | $10,000 first offense, $20,000 subsequent, treble damages |
| Oklahoma (OTSA) | Stricter calling windows, separate consent required | State AG enforcement |
| Washington | Additional telemarketing restrictions | State enforcement |
Compliance best practices include capturing timestamps of consent, recording source URLs, storing session data and IP information, documenting explicit opt-in (unchecked checkboxes), retaining disclosure text shown to consumers, maintaining consent certificates, and logging revocation requests.
Technology infrastructure: operational capability requirements
Ping/post systems enable real-time price discovery
Modern lead distribution operates through ping/post technology – a two-stage process separating price discovery from data transfer. The ping stage sends partial, non-PII data (geography, loan amount, credit profile) to potential buyers who return bids or rejections. The post stage delivers complete contact information to winning buyers within seconds.
This architecture enables sophisticated distribution logic: exclusive sales to highest bidders, multi-buyer distribution comparing exclusive bids against summed non-exclusive offers, priority-based routing, and cap management. Response time requirements typically demand completion within 5 seconds with individual buyer timeouts of 1-3 seconds.
Platform selection depends on primary use case
LeadConduit (ActiveProspect) excels at lead optimization and routing with 100+ pre-built integrations, TrustedForm compliance integration, and real-time validation add-ons. Pricing starts at approximately $10 per lead processed.
CAKE serves affiliate networks with support for CPA/CPS, CPC, and CPM models alongside lead capture and distribution. Server-to-server postback tracking, fraud detection, and AWS-hosted infrastructure with 99.9% uptime make it suitable for high-volume operations.
Everflow focuses on partner marketing with stage-based attribution tracking leads from form start through customer conversion. Native HubSpot and Salesforce integrations enable closed-loop revenue attribution.
TUNE (formerly HasOffers) offers enterprise customization with 650+ API endpoints, multi-language support, and fully white-labeled deployment options.
Phonexa provides an all-in-one suite combining lead management (LMS Sync) with call tracking (Call Logic), including AI-powered call agents and integrated fraud detection.
boberdoo specializes in ping/post distribution with dynamic and static pricing support, A/B testing capabilities, and performance-based bid adjustment. For a detailed comparison of these platforms, see our lead distribution platform comparison guide.
Server-side tracking has become the industry standard
Cookie-based pixel tracking faces terminal decline. Safari and Firefox block third-party cookies; Chrome’s privacy controls increasingly limit cross-site tracking; ad blockers interfere with client-side pixels. Server-to-server postback tracking – where advertisers fire server calls with click identifiers upon conversion – provides reliable attribution resistant to browser restrictions.
Implementation requires passing unique request IDs through landing page URLs, storing IDs with user sessions, and firing postback URLs containing transaction details when conversions occur. This architecture supports cookieless environments while maintaining attribution accuracy.
When to choose PPL versus CPA
PPL fits businesses with strong sales capabilities
Choose PPL when your organization has:
- Robust internal sales teams capable of converting leads
- Need to build first-party customer databases
- Sales cycles extending over months requiring relationship development
- Budget predictability matters more than outcome certainty
PPL works particularly well in industries with standardized lead qualification – insurance, mortgage, legal, home services – where clear criteria define acceptable leads.
Financial considerations favor PPL for organizations with limited marketing budgets seeking predictable per-lead costs (typically $30-$400 depending on industry and quality), early-stage companies building customer databases, and businesses testing market demand before scaling.
CPA suits high-LTV businesses with optimized funnels
Choose CPA when you:
- Operate in e-commerce or transactional environments with short purchase cycles
- Have customer lifetime value justifying higher acquisition costs
- Lack internal sales resources to convert raw leads
- Need partners to bear conversion risk
CPA aligns incentives between publishers and advertisers – both benefit only when real customers convert.
CPA makes sense for established companies with proven conversion rates and strong attribution tracking, businesses prioritizing immediate revenue over database building, and organizations willing to pay premium prices (often $150-$250+ per appointment in B2B) for pre-qualified prospects. For frameworks to calculate true ROI across both pricing models, accurate cost accounting is essential.
Hybrid models outperform pure approaches
Research from Forrester indicates hybrid models achieve 72% client satisfaction compared to 64% for pure retainer and 57% for pure performance arrangements. Effective hybrid structures combine base retainers ($2,000-$6,000 monthly) with performance bonuses ($100-$500 per lead exceeding targets), graduated performance tiers, or revenue share components (5-20% of generated revenue).
This structure balances risk appropriately – publishers receive baseline compensation covering operational costs while maintaining incentive alignment through performance components. Buyers gain predictability while preserving accountability.
AI and automation: reshaping lead generation economics
The integration of artificial intelligence into lead generation has progressed rapidly, with 84% of B2B companies projected to use AI in their lead generation operations. Companies deploying AI report up to 50% increases in lead generation volume and cost reductions up to 60%. Marketing automation alone can increase qualified leads by 451% according to research from Warmly.ai.
Predictive lead scoring improves qualification accuracy
AI-driven lead scoring has increased accuracy by approximately 40% on average compared to rule-based approaches. Machine learning models analyze historical conversion patterns, behavioral signals, firmographic data, and intent indicators to predict which leads will convert. This enables dynamic scoring that adjusts as new data emerges rather than static criteria that may drift from reality.
Automated routing reduces speed-to-lead delays
Research consistently shows leads contacted within minutes convert at dramatically higher rates than those reached hours later – delays beyond 24 hours reduce conversion potential by 60% or more. AI-powered routing eliminates manual assignment delays, matching leads to appropriate sales resources based on qualification scores, geography, product interest, and representative availability.
Approximately 80% of routine SDR tasks can now be handled by AI agents, including initial outreach, qualification conversations, appointment scheduling, and data entry. This shifts human resources toward high-value relationship building while AI handles volume processing.
Future pricing models will incorporate AI capabilities
Emerging AI-driven pricing structures include outcome-based models where agencies receive compensation tied to revenue generated rather than activities performed, usage-based arrangements with token or credit-based consumption, and dynamic pricing adjusted in real-time based on intent signals and competitive factors. These models require sophisticated attribution but promise better alignment between costs and results.
Common implementation mistakes
PPL failures: quality-quantity misalignment
Organizations implementing PPL frequently focus exclusively on lead volume without establishing quality criteria. This produces high lead counts but poor conversion rates – the data shows only 27% of generated leads ever get contacted and 79% never convert due to inadequate processes rather than inherent lead quality.
Pricing mistakes that compound these issues:
- Charging uniform rates across industries ignores substantial variation in lead economics
- Failing to tier pricing by quality level commoditizes all leads
- Underestimating true costs (including time, tools, and overhead) produces unsustainable margins
Contract errors:
- Guaranteeing specific lead volumes without market testing
- Using vague qualification definitions that create disputes
- Omitting return policies for invalid leads
- Inadequate exclusivity terms that allow data resale
CPA implementations: attribution complexity
CPA programs often fail due to multi-touch attribution challenges – complex B2B sales involving dozens of touchpoints across months make it difficult to assign credit accurately. Cross-device tracking remains imperfect, and long conversion windows create tracking difficulties.
Conversion funnel optimization gaps also undermine CPA results. Poorly designed landing pages, excessive friction in checkout processes, and untested user flows reduce conversion rates, making the model economically unfeasible even with qualified traffic.
Universal failures: sales-marketing misalignment
Companies with misaligned sales and marketing teams lose approximately 10% of annual revenue according to research. This misalignment manifests as different definitions of qualified leads, absent feedback loops between teams, and conflicting incentives that undermine collaboration.
Data fragmentation creates additional losses – organizations forfeit 20-30% of annual revenue due to poor data quality including duplicate records, outdated information, and siloed systems that prevent unified customer views.
Negotiation strategies for buyers and sellers
Buyers should leverage volume for pricing advantages
Lead buyers negotiating with sellers can typically secure 10-25% discounts for volume commitments, with additional reductions for longer contract terms. Transparency about forecasting and demand patterns builds trust that enables better pricing.
Quality standards should be established contractually with clear lead qualification criteria (BANT, ICP match), measurable KPIs, quality-based payment adjustments, and replacement policies for invalid leads. Return policies should define criteria for lead rejection (typically within 24-72 hours), cap return rates (usually 5-15% maximum), and establish dispute resolution processes.
Sellers should focus on value positioning and payment protection
Lead sellers benefit from researching market rates and client budgets, preparing portfolios with documented results, framing discussions around ROI and business impact, and quantifying the value premium of qualified leads versus commodity data.
Payment protection mechanisms include hybrid structures combining base retainers with performance bonuses, upfront deposits (typically 30-50% for new clients), clear milestone-based payments, and penalty clauses for late payment.
The 5 C’s framework provides useful negotiation structure:
- Clarity – Define deliverables and terms precisely
- Communication – Disclose reasoning behind clauses
- Collaboration – Co-draft complex sections
- Compromise – Package trade-offs systematically
- Commitment – Secure final sign-off authority
PPL Contract Negotiation: The VALOR Framework
PPL contracts require specific provisions that differ substantially from general service agreements. The VALOR framework provides a structured approach for negotiating PPL-specific terms that protect both parties while enabling productive partnerships.
V – Volume Commitments and Flexibility Bands
PPL contracts should establish volume expectations with built-in flexibility rather than rigid minimums that create disputes when market conditions shift.
Tiered Volume Structure:
| Monthly Volume Tier | Price Per Lead | Commitment Level |
|---|---|---|
| 0-500 leads | Base rate | No minimum |
| 501-1,500 leads | Base minus 8% | Soft target |
| 1,501-3,000 leads | Base minus 15% | Hard commitment |
| 3,001+ leads | Base minus 22% | Negotiated |
Flexibility provisions to include:
- Seasonal adjustment clauses allowing 15-25% volume variance during documented slow periods without penalty
- Ramp period protections giving new relationships 60-90 days before minimum volume requirements activate
- Market disruption triggers suspending minimums during defined events (regulatory changes, platform policy shifts, economic downturns exceeding specified thresholds)
- Catch-up provisions allowing volume shortfalls in one period to be offset by overperformance in subsequent periods within the same quarter
The most common PPL contract dispute involves volume shortfalls. Sellers commit to volumes they cannot consistently deliver; buyers commit to volumes they cannot consistently absorb. Building flexibility into the contract structure prevents these disputes.
A – Acceptance Criteria and Return Mechanisms
Lead acceptance criteria require precise contractual definition to prevent post-hoc disputes about what constitutes a valid lead.
Standard PPL Acceptance Framework:
Define leads across three categories with specific handling rules:
Category A – Automatically Accepted: Valid phone number (passes carrier lookup), valid email (deliverable, no disposable domains), within defined geography, all required fields complete, passes duplicate check against 30-day suppression window.
Category B – Subject to Review: Partial phone validation (valid format but carrier lookup inconclusive), secondary geography (adjacent markets buyer may accept), minor field inconsistencies (e.g., name capitalization issues).
Category C – Automatically Rejected: Failed phone validation, invalid email, outside service geography, duplicate within suppression window, missing required consent documentation, bot-detection flags triggered.
Return Process Provisions:
- Return submission window: 24-72 hours from delivery (shorter windows favor sellers; longer windows favor buyers)
- Return format requirements: Specific disposition codes with supporting evidence
- Return rate caps: 8-15% monthly maximum with rolling calculation methodology defined
- Escalation path: Named contacts and response time SLAs for disputed returns
- Cure period: 14-30 day notice before contract termination for persistent quality issues
Sample contract language for return disputes:
“Disputed leads shall be reviewed by both parties within five (5) business days of dispute submission. If parties cannot reach agreement, leads shall be submitted to a mutually agreed third-party validation service, with costs shared equally. The third party’s determination shall be binding.”
L – Liability Allocation and Indemnification
TCPA liability represents the most significant risk in PPL contracts. Clear allocation protects both parties.
Seller Representations:
- All leads generated through compliant methods
- Prior express written consent obtained per FCC requirements
- Consent documentation retained and available upon request
- No leads generated through bots, incentivized submissions, or scraped data
- DNC registry scrubbing performed prior to delivery
Buyer Representations:
- Leads contacted only through methods covered by obtained consent
- Contact attempts cease upon revocation request
- Internal DNC compliance maintained
- No re-sale of lead data to third parties without explicit consent
Indemnification Structure:
“Each party shall indemnify, defend, and hold harmless the other party from claims arising from the indemnifying party’s breach of representations and warranties herein. Seller’s maximum aggregate liability shall not exceed [X times / X months of] fees paid under this agreement.”
Liability caps should be negotiated based on relationship value and risk profile. New relationships typically use lower caps (3-6 months of fees); established relationships may accept higher caps or carve-outs for willful misconduct.
O – Optimization Rights and Data Usage
PPL contracts should address data usage rights clearly to prevent disputes about permissible optimization activities.
Data rights provisions:
- Feedback data: Buyer provides disposition data (contacted, converted, returned with reason) within defined timeframe (typically 30-60 days)
- Optimization usage: Seller may use anonymized, aggregated feedback data to improve lead quality
- Prohibition on resale: Leads sold as exclusive cannot be resold; leads sold as shared are limited to defined number of buyers
- Suppression requirements: Converted leads added to suppression list; sellers prohibited from remarketing to converted customers
Performance transparency clauses:
“Seller shall provide monthly reporting including: lead volume by day, geographic distribution, field completion rates, and consent certificate validity rates. Buyer shall provide quarterly feedback including: contact rates, conversion rates by lead source, and return disposition analysis.”
R – Renewal Terms and Exit Provisions
Clear exit provisions prevent costly disputes when relationships end.
Renewal structure options:
- Auto-renewal with adjustment: Annual contracts auto-renew with price adjustment tied to defined index (e.g., CPI or prior year volume)
- Performance-based renewal: Renewal contingent on meeting defined quality thresholds
- Mutual opt-out: Either party may exit with 30-60 day written notice without cause
Exit provisions to include:
- Wind-down period: 14-30 days to fulfill pending lead commitments
- Final settlement: Payment terms for leads delivered during wind-down
- Data handling: Destruction or return of lead data, consent documentation retention requirements
- Non-solicitation: Prohibition on direct recruitment of other party’s employees for 6-12 months post-termination
CPA Contract Negotiation: The TRUST Framework
CPA contracts involve different economics and risk profiles than PPL, requiring distinct contractual frameworks. The TRUST framework addresses CPA-specific concerns.
T – Tracking Infrastructure and Attribution
CPA contracts depend entirely on accurate conversion tracking. Technical specifications must be contractually defined.
Required technical provisions:
- Postback specifications: Server-to-server postback URL format, required parameters, timeout thresholds
- Click ID persistence: How click identifiers are passed through conversion funnels, storage requirements
- Attribution window: Typically 7-30 days from click (longer windows benefit publishers; shorter windows benefit advertisers)
- De-duplication rules: How multiple touchpoints are handled, which click receives credit
- Testing requirements: Mandatory test conversions before campaign launch, periodic validation requirements
Sample technical specification:
“Publisher shall fire server-side postback within 60 seconds of conversion event to: [URL]?clickid={clickid}&payout={payout}&transaction_id={txid}. Postbacks not received within 24 hours of conversion may not be credited. Advertiser shall maintain 99.5% postback receipt rate; systematic failures shall trigger technical review within 48 hours.”
R – Revenue Validation and Chargeback Handling
CPA economics require clear rules for handling reversed transactions.
Validation period provisions:
- Hold period: 30-90 days during which commissions remain provisional
- Chargeback allocation: How chargebacks within hold period affect commission
- Post-hold chargebacks: Whether chargebacks after hold period trigger clawbacks (contentious – negotiate carefully)
- Fraud chargebacks: Distinct treatment for fraud-flagged transactions versus legitimate returns
Commission adjustment calculation:
“Monthly commissions shall be adjusted for returns and chargebacks occurring within ninety (90) days of original transaction. Adjustment shall equal the commission originally paid for returned transactions. Advertiser shall provide chargeback reporting within fifteen (15) days of month-end. Publisher may dispute chargebacks exceeding 3% of monthly transactions; disputes shall follow the escalation process defined in Section [X].”
U – Uplift Measurement and Incrementality
Sophisticated CPA contracts address incrementality – whether conversions would have occurred without publisher involvement.
Incrementality provisions:
- Baseline definition: How organic conversion rates are established
- Holdout testing: Rights to run randomized control tests measuring publisher incrementality
- Payment adjustment: Whether commission rates adjust based on proven incrementality
- Minimum incrementality thresholds: Below which campaigns may be paused or renegotiated
Most CPA contracts do not include incrementality provisions, which favors publishers. Advertisers should push for at least measurement rights.
S – Scale Commitments and Pacing
CPA contracts should address how campaigns scale and pace to prevent budget overruns or underperformance.
Pacing provisions:
- Daily/monthly caps: Maximum spend or conversion volume
- Cap notification: How quickly publishers must pause when caps are reached
- Budget increase process: Notice requirements and approval workflow for budget changes
- Minimum performance thresholds: Below which advertiser may pause without penalty
Scale commitment structure:
“Publisher commits to deliver minimum [X] conversions per month within defined CPA range. Advertiser commits to maintain campaign active with minimum [Y] daily budget for contract duration. Either party may request monthly review meeting if actual performance deviates more than 25% from commitments.”
T – Termination Triggers and Performance Guarantees
CPA contracts require clear termination triggers tied to measurable performance.
Performance-based termination triggers:
- Quality threshold: Chargeback/return rate exceeding defined percentage (typically 5-15%) for consecutive measurement periods
- Volume threshold: Conversion volume falling below minimum for consecutive periods
- CPA threshold: Effective CPA exceeding maximum by defined percentage for consecutive periods
- Compliance violations: Any substantiated compliance breach enabling immediate termination
Cure provisions:
“Upon written notice of performance deficiency, the receiving party shall have [14-30] days to cure. If deficiency is not cured within the cure period, the notifying party may terminate immediately. For compliance violations involving consumer harm, regulatory action, or willful misconduct, termination shall be effective immediately upon notice without cure period.”
The PRISM Framework: Pricing Model Selection for Lead Generation Operations
Selecting between PPL and CPA requires systematic analysis beyond simple cost comparison. The PRISM framework provides a structured methodology for evaluating which pricing model aligns with specific business circumstances, capabilities, and growth objectives.
P – Pipeline Capacity Assessment
Before selecting a pricing model, operations must honestly evaluate their pipeline processing capabilities. The most common source of pricing model failure stems from misalignment between lead volume and conversion capacity.
Pipeline Capacity Diagnostic Matrix:
| Capacity Factor | PPL Suitability Score | CPA Suitability Score | Assessment Method |
|---|---|---|---|
| Sales team size | High (5+ reps) | Any size | Headcount analysis |
| Lead response time | Under 5 min average | Under 30 min acceptable | Response time audit |
| Contact rate achievement | 75%+ consistently | 60%+ acceptable | CRM reporting |
| Follow-up sequence depth | 8+ touches standard | 3-5 touches acceptable | Process documentation |
| CRM data hygiene | 95%+ complete records | 85%+ acceptable | Data quality audit |
Capacity Calculation Formula:
Maximum sustainable PPL volume = (Sales reps × 40 hours × Contact rate × Calls per hour) ÷ Average touches per conversion
Example calculation: A team of 4 reps working 40 hours weekly with 75% contact rate and 8 calls per hour, requiring 6 touches per conversion, can sustain: (4 × 40 × 0.75 × 8) ÷ 6 = 160 leads per week maximum
Operations purchasing PPL volume exceeding this capacity experience declining conversion rates, wasted spend, and team burnout. CPA models require less capacity planning since conversions arrive pre-qualified.
R – Revenue Model Alignment Analysis
The pricing model must align with how revenue flows through the business. Misalignment creates cash flow stress that undermines otherwise sound unit economics.
Revenue Flow Compatibility Assessment:
| Revenue Model | PPL Compatibility | CPA Compatibility | Critical Consideration |
|---|---|---|---|
| Transaction-based | Medium | High | Short cycles favor CPA |
| Subscription/recurring | High | Medium | LTV justifies PPL investment |
| Project-based services | High | Low | Relationship building favors PPL |
| Marketplace/platform | Low | High | Volume economics favor CPA |
| Hybrid (transaction + recurring) | High | Medium | Optimize for LTV capture |
Cash Flow Timing Analysis:
PPL operations must model cash requirements accounting for:
- Lead payment timing (typically immediate to 7 days)
- Sales cycle duration (varies by vertical: 7-90+ days)
- Revenue collection timing (payment terms: net 15-45 typical)
- Return/refund exposure window (24-72 hours for lead returns)
Working capital requirement formula:
Minimum working capital = (Daily lead spend × Average sales cycle days) + (Monthly overhead × 1.5)
Operations transitioning from CPA to PPL frequently underestimate working capital requirements by 40-60%, creating cash crises during scale-up phases.
I – Infrastructure Readiness Evaluation
Technical infrastructure requirements differ substantially between models. Attempting to operate either model without appropriate infrastructure produces systematic underperformance.
PPL Infrastructure Requirements:
| Component | Minimum Viable | Competitive Standard | Market Leader |
|---|---|---|---|
| Lead distribution platform | Spreadsheet/email | LeadConduit or equivalent | Custom ping/post system |
| Validation stack | Manual review | Automated phone/email | Real-time fraud detection |
| Consent documentation | Screenshot capture | TrustedForm Basic | TrustedForm + Jornaya |
| CRM integration | Manual entry | API sync | Bidirectional real-time |
| Reporting capability | Weekly manual | Daily automated | Real-time dashboards |
Monthly infrastructure cost benchmarks by operation size:
| Operation Scale | Platform Costs | Validation Costs | Compliance Costs | Total Monthly |
|---|---|---|---|---|
| Startup (under 1,000 leads) | $150-300 | $50-150 | $150-400 | $350-850 |
| Growth (1,000-5,000 leads) | $300-800 | $150-750 | $400-2,000 | $850-3,550 |
| Scale (5,000-20,000 leads) | $800-2,500 | $750-3,000 | $2,000-8,000 | $3,550-13,500 |
| Enterprise (20,000+ leads) | $2,500-10,000 | $3,000-15,000 | $8,000-30,000 | $13,500-55,000 |
CPA Infrastructure Requirements:
CPA operations require robust attribution and tracking infrastructure:
- Server-side conversion tracking (implementation cost: $2,000-15,000)
- Multi-touch attribution modeling (platform cost: $500-5,000/month)
- Fraud detection for conversion events (cost: $0.01-0.10 per conversion)
- Chargeback/return monitoring (often included in payment processing)
S – Strategic Positioning Consideration
Pricing model selection signals market positioning and influences competitive dynamics. The choice affects how buyers, sellers, and partners perceive and interact with your operation.
Market Positioning Implications:
| Positioning Goal | Recommended Model | Strategic Rationale |
|---|---|---|
| Premium quality positioning | PPL with strict criteria | Quality control signals value |
| High-volume market share | CPA or hybrid | Volume efficiency matters most |
| Vertical specialization | PPL | Deep expertise enables scoring |
| Geographic expansion | CPA initially, transition to PPL | Lower risk during market learning |
| Technology differentiation | PPL with proprietary scoring | Tech advantage monetizes via PPL |
Competitive Dynamic Analysis:
In markets with 70%+ PPL adoption, CPA offerings may struggle to attract quality publishers who prefer immediate payment certainty. Conversely, in markets dominated by CPA (e-commerce, app installs), PPL offerings must compensate with significant pricing premiums to attract publisher attention.
Partner Ecosystem Compatibility:
| Partner Type | PPL Preference | CPA Preference | Hybrid Tolerance |
|---|---|---|---|
| Large media buyers | Medium | High | High |
| Affiliate networks | High | Medium | High |
| Content publishers | High | Low | Medium |
| Call centers | High | Low | Low |
| Lead aggregators | High | Medium | High |
M – Measurement Framework Selection
The pricing model determines which metrics matter and how success gets measured. Selecting inappropriate KPIs for your model produces misleading optimization signals.
PPL Primary Metrics Hierarchy:
- Earnings Per Lead (EPL) – Net revenue after returns and costs
- Sell-through rate – Percentage of leads successfully monetized
- Return rate by source – Quality indicator by traffic origin
- Speed-to-revenue – Time from lead capture to cash collection
- Buyer concentration index – Revenue diversity across buyers
CPA Primary Metrics Hierarchy:
- Customer Acquisition Cost (CAC) – Fully loaded acquisition expense
- Payback period – Months until acquisition cost recovered
- LTV:CAC ratio – Long-term value versus acquisition investment
- Chargeback rate – Conversion quality indicator
- Channel incrementality – True lift versus organic baseline
Model-Specific Benchmarking Standards:
| Metric | PPL Healthy Range | PPL Warning Zone | CPA Healthy Range | CPA Warning Zone |
|---|---|---|---|---|
| Gross margin | 25-45% | Under 20% | 60-80% | Under 50% |
| Return/rejection rate | Under 12% | Over 18% | Under 8% | Over 15% |
| Revenue concentration (top buyer/channel) | Under 35% | Over 50% | Under 40% | Over 60% |
| Month-over-month variance | ±15% | ±30%+ | ±10% | ±25%+ |
PRISM Framework Decision Matrix
Apply PRISM scoring to generate a quantitative model recommendation:
Scoring Instructions:
Rate each factor 1-5 (1 = strongly favors CPA, 5 = strongly favors PPL):
| Factor | Score | Weight | Weighted Score |
|---|---|---|---|
| Pipeline capacity (P) | ___ | 1.5x | ___ |
| Revenue model alignment (R) | ___ | 1.2x | ___ |
| Infrastructure readiness (I) | ___ | 1.0x | ___ |
| Strategic positioning (S) | ___ | 0.8x | ___ |
| Measurement framework (M) | ___ | 1.0x | ___ |
| Total | 5.5x | ___ |
Interpretation:
- Score under 15: Strong CPA recommendation
- Score 15-20: CPA with PPL testing on limited scope
- Score 20-25: Hybrid model recommended
- Score 25-30: PPL with CPA backup for specific use cases
- Score over 30: Strong PPL recommendation
Future trends: first-party data and outcome-based models
Privacy regulations accelerate first-party data strategies
By 2025, 84% of brands will depend on first-party data strategies according to eMarketer. Businesses using first-party data achieve 50% higher lead-to-customer conversions while those applying first-party strategies achieve 2.9x better customer retention and 1.5x higher marketing ROI.
The deprecation of third-party cookies – while partially reversed by Google – continues creating pressure toward first-party collection through progressive profiling, zero-party data (preferences willingly shared), and value exchanges offering tools, calculators, or content in return for data.
Outcome-based pricing gains traction
The industry trajectory points toward pricing tied to revenue outcomes rather than activity metrics. AI-enabled precise attribution makes this feasible by accurately connecting marketing investments to downstream revenue. Revenue share models (5-20% of generated revenue) represent early movement in this direction.
Intent data integration enables smarter lead acquisition
Buying intent signals – topics researched, competitors evaluated, solutions explored – increasingly inform lead pricing and prioritization. Real-time behavior analysis, cross-platform intent aggregation, and predictive scoring based on intent patterns enable more sophisticated approaches than simple demographic targeting.
Key takeaways
-
Model selection must match business capabilities. PPL works for organizations with strong sales teams and lead nurturing processes; CPA fits transactional businesses with optimized conversion funnels. Hybrid models outperform pure approaches with 72% satisfaction rates versus 57-64% for pure models. Understanding what lead generation entails helps clarify which model fits your operation.
-
Pricing varies dramatically by vertical and quality tier. Insurance leads range from $8-$100+, legal leads reach $300-$1,500, B2B SaaS averages $164-$310, and higher education exceeds $980. Exclusive leads cost 2-4x more but convert 3-5x better than shared leads.
-
TCPA compliance creates existential business risk. Penalties of $500-$1,500 per violation with uncapped total liability have produced settlements exceeding $900 million. New consent revocation rules require 10-day processing of opt-outs through any reasonable method.
-
Technology infrastructure determines operational capability. Server-side tracking has replaced cookie-based pixels as the industry standard. Ping/post systems enable real-time price discovery with sub-5-second response requirements.
-
AI is transforming unit economics. Companies using AI report up to 50% increases in lead generation and 60% cost reductions. Predictive scoring improves qualification accuracy by approximately 40% over rule-based approaches.
-
First-party data strategies will dominate. Privacy regulations and cookie deprecation are making third-party data unreliable. Organizations investing in first-party collection achieve 50% higher conversions and 2.9x better retention.
-
Only 27% of leads ever get contacted by sales. Process failures – not lead quality – cause 79% of leads to never convert. Speed-to-lead response times and sales-marketing alignment determine conversion success more than lead source.
-
Fraud costs the industry $1.4 billion annually. Bot-submitted leads represent both financial loss and TCPA compliance exposure. 51.8% of ad budgets face fraud impact, with sophisticated invalid traffic evading basic detection.
-
Volume discounts of 10-25% are standard. Buyers should establish quality criteria contractually, define return policies (24-72 hour windows, 5-15% caps), and specify dispute resolution processes before committing to lead sources.
-
Emerging models tie pricing to revenue outcomes. Revenue share (5-20%), outcome-based AI pricing, and hybrid retainer-plus-performance structures represent the future of lead generation economics as attribution capabilities mature.
Frequently asked questions
What is the main difference between PPL and CPA?
PPL pays publishers when prospects submit contact information (form fills, quote requests, registrations), while CPA pays only when prospects complete defined actions – typically purchases involving payment. PPL compensates for generating interest; CPA compensates for generating customers.
Which model is riskier for advertisers?
PPL creates more risk for advertisers who pay for leads regardless of whether they convert to sales. CPA reduces advertiser risk by tying payment to actual conversions but requires publishers to bear conversion risk. The appropriate choice depends on sales team capability and conversion funnel optimization.
How much do leads cost across different industries?
Pricing varies substantially: auto insurance leads run $8-$100+, mortgage leads $10-$300+, legal leads $40-$1,500 depending on practice area, home services $20-$500, and B2B SaaS $164-$310. Exclusive leads typically cost 2-4x more than shared leads.
What technology is required to operate PPL or CPA programs?
Both models require tracking infrastructure – server-to-server postback tracking is now standard due to cookie restrictions. PPL additionally requires lead validation systems, ping/post distribution capability, and CRM integration. Platforms like LeadConduit, CAKE, Everflow, and Phonexa provide these capabilities.
How does TCPA compliance affect lead generation?
TCPA violations carry $500-$1,500 penalties per call or text with no cap on total liability. Leads generated by bots create compliance exposure since valid consent doesn’t exist. New FCC rules require processing opt-outs within 10 business days through any reasonable method. Consent documentation via TrustedForm or Jornaya has become essential.
What is a ping/post system?
Ping/post is a two-stage lead distribution architecture. The ping stage sends anonymized lead attributes to buyers who return bid prices. The post stage delivers complete contact information to winning buyers. This enables real-time price discovery and optimal distribution across multiple buyers.
How is AI changing lead generation pricing?
AI enables predictive lead scoring (40% accuracy improvement), automated routing (reducing speed-to-lead delays), fraud detection through pattern recognition, and dynamic pricing based on intent signals. 84% of B2B companies are projected to use AI in lead generation, with early adopters reporting 50% volume increases and 60% cost reductions.
Should I use exclusive or shared leads?
Exclusive leads cost 2-4x more but convert at rates up to 5x higher than shared leads. Choose exclusive leads when conversion rate matters more than volume and when your sales process depends on being first to contact prospects. Shared leads work for high-volume operations with strong sales teams capable of competing for conversions.
What return policies should I negotiate for PPL agreements?
Standard return policies allow rejection within 24-72 hours for leads failing qualification criteria (invalid contact information, outside service area, duplicate submissions). Return rate caps typically range from 5-15% maximum to prevent abuse. Clear criteria and dispute resolution processes should be established contractually.
What emerging models should I watch?
Hybrid PPL+CPA arrangements (base retainer plus performance bonus), revenue share models (5-20% of generated revenue), dynamic pricing based on intent signals, and outcome-based AI pricing tied to revenue rather than activities represent the frontier of lead generation economics. First-party data strategies and consent-first collection methods are becoming competitive necessities.