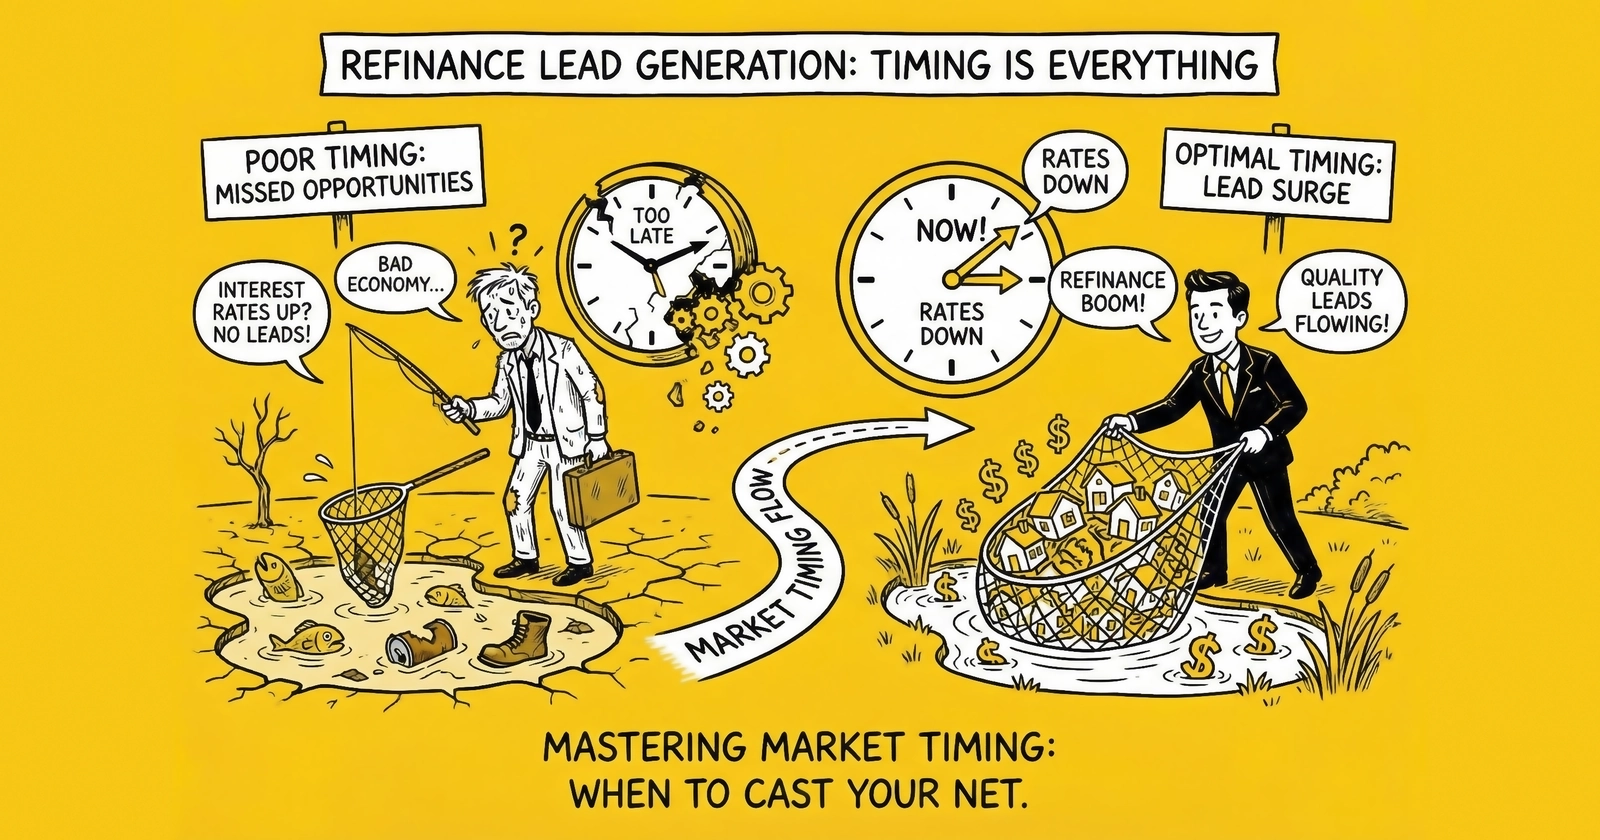
During the 2020-2021 refinance surge, correctly positioned operators generated revenue exceeding their previous five years combined. Those who entered late found saturated markets and compressed margins. In refinance lead generation, timing is everything.
Mortgage refinance lead generation operates on fundamentally different economics than most marketing verticals – demand materializes suddenly when interest rate conditions create compelling consumer value propositions, then evaporates equally quickly when rate movements eliminate the financial logic of refinancing. The difference between capturing these demand waves and missing them entirely can determine annual profitability for lead generation operations. During the 2020-2021 refinance surge, operators positioned correctly generated revenue that exceeded their previous five years combined, while those who entered too late found markets saturated and margins compressed beyond viability.
This analysis examines the rate thresholds that trigger refinance demand, the market timing indicators that predict demand shifts, and the operational strategies that enable rapid scaling when conditions favor refinance activity. The insights draw from multiple refinance cycles and the observable patterns that connect monetary policy, rate movements, and consumer refinancing behavior. Understanding these dynamics – alongside broader rate cycle pricing strategies – transforms refinance from an unpredictable opportunistic vertical into a strategically manageable component of lead generation portfolios.
The Economics of Refinance Decision-Making
Refinance demand emerges from a simple calculation that consumers and their financial advisors perform: does the interest savings from a new loan exceed the costs of obtaining it? When this calculation produces clearly positive results for large consumer populations, refinance waves materialize. When the calculation turns negative or marginal, demand collapses regardless of marketing investment.
The Break-Even Framework
Consumer refinance decisions rest on break-even analysis comparing monthly payment reduction against closing costs. The standard rule of thumb suggests refinancing makes financial sense when the borrower will remain in the home long enough to recoup closing costs through monthly savings – typically calculated as a break-even period of 18-36 months depending on risk tolerance and planning horizon.
Consider a borrower with a $400,000 mortgage at 7.0% interest evaluating a refinance to 5.5%. Monthly principal and interest payments drop from $2,661 to $2,271 – a savings of $390 per month. With typical closing costs of $8,000-$12,000 (2-3% of loan amount), break-even occurs in 20-31 months. For homeowners planning to stay 5+ years, this represents compelling economics.
The sensitivity of this calculation to rate differences explains the threshold effects observed in refinance markets. A rate reduction from 7.0% to 6.5% produces $167 monthly savings on the same loan – extending break-even to 48-72 months and eliminating refinance appeal for many borrowers. Small rate movements produce large demand changes because they cross decision thresholds for substantial consumer populations.
Rate Spread Thresholds and Demand Triggers
Historical analysis reveals consistent patterns in rate spread thresholds that trigger meaningful refinance demand:
| Rate Reduction | Demand Response | Break-Even (typical) | Consumer Motivation |
|---|---|---|---|
| 0.25-0.50% | Minimal | 48-96 months | Only opportunistic refinancers |
| 0.50-0.75% | Moderate | 32-48 months | Engaged homeowners with long horizons |
| 0.75-1.00% | Strong | 24-32 months | Broad middle market activation |
| 1.00-1.50% | Very Strong | 16-24 months | Mass market refinance wave |
| 1.50%+ | Extraordinary | Under 16 months | Historic demand, capacity constraints |
The 2020-2021 refinance surge exemplified extraordinary demand conditions. Rates dropped from approximately 4.5% in early 2020 to below 3.0% by late 2020 – representing 1.5%+ reduction for borrowers with relatively recent originations. Mortgage Bankers Association data shows refinance applications increased 220% year-over-year at peak, overwhelming lender capacity and creating lead buyer demand that far exceeded available supply.
The “Refinanceable Population” Concept
Not all mortgage holders benefit from refinancing regardless of rate environment. The refinanceable population – borrowers for whom current rates offer compelling improvement over existing terms – varies dynamically based on the distribution of outstanding mortgage rates.
When rates decline to historic lows, virtually all outstanding mortgages become refinance candidates, maximizing the refinanceable population. When rates rise from recent lows, the refinanceable population shrinks to borrowers with older, higher-rate mortgages – a decreasing share of total mortgage holders as these loans age and are paid off or refinanced.
The 2022-2024 period demonstrated this dynamic clearly. After historic lows in 2020-2021, rates rose to 7%+ by late 2022. This rate level exceeded almost all outstanding mortgage rates – Federal Housing Finance Agency data indicates the median outstanding mortgage rate was 3.9% in 2023. With virtually no borrowers holding rates above current market levels, the refinanceable population approached zero regardless of lender appetite or marketing investment.
Market Timing Indicators and Predictive Signals
Successfully timing refinance market entry and scaling requires monitoring leading indicators that signal rate movements and demand shifts before they fully materialize. While precise rate prediction remains impossible, directional indicators provide actionable intelligence for operational planning.
Federal Reserve Policy Signals
Federal Reserve monetary policy decisions represent the most powerful driver of mortgage rate movements, though the relationship operates with lag and complexity rather than direct transmission.
Federal Funds Rate Guidance
Fed communications provide forward guidance about interest rate intentions. When the Fed signals easing cycles – reducing the federal funds rate or pausing increases – mortgage rates typically decline with a 2-8 week lag as bond markets price in lower future rates. Fed dot plots (projections of future rate targets) and FOMC meeting minutes offer insight into policymaker thinking.
The practical application: monitoring Fed communications enables preparation for rate-driven demand changes. When Fed signals shift toward easing, refinance operations should begin preparing for potential demand increases – building lender relationships, testing creative, and ensuring traffic sources can scale.
Quantitative Easing and Mortgage-Backed Securities
Fed purchases of mortgage-backed securities (MBS) directly influence mortgage rates by increasing MBS demand and reducing yields. The Fed’s MBS purchase programs during 2020-2021 contributed significantly to historic rate lows. Fed announcements regarding MBS purchase changes provide direct signals about mortgage rate direction.
Treasury Yield Movements
The 10-year Treasury yield serves as a primary benchmark for mortgage rate movements. Mortgage rates typically trade at a spread above Treasury yields – historically 1.5-2.0 percentage points, though this spread varies based on market conditions and MBS pricing dynamics.
| Treasury Yield Movement | Typical Mortgage Rate Response | Lag Time |
|---|---|---|
| 0.25%+ decline over 4 weeks | Proportional decline | 1-2 weeks |
| 0.50%+ decline over 8 weeks | Refinance demand activation | 2-4 weeks |
| Sustained decline trend | Market timing opportunity | 4-8 weeks |
Monitoring Treasury yields provides earlier warning of mortgage rate movements than waiting for posted mortgage rate changes. When Treasury yields decline meaningfully, mortgage rates will follow – providing lead time for operational preparation.
Economic Indicators with Rate Implications
Several economic indicators influence Fed policy and therefore indirectly affect mortgage rates:
Inflation Metrics Consumer Price Index (CPI) and Personal Consumption Expenditures (PCE) inflation measures drive Fed rate decisions. Declining inflation creates space for Fed easing, which typically reduces mortgage rates. Sustained high inflation keeps rates improved.
Employment Data Unemployment rate increases may prompt Fed easing to support economic activity, potentially reducing mortgage rates. Strong employment data reduces likelihood of rate cuts.
GDP Growth Economic weakness may trigger monetary policy accommodation, while strong growth reduces need for lower rates.
The practical application involves monitoring these indicators not for direct rate prediction but for understanding the probability distribution of rate movements. When inflation declines while unemployment rises, the probability of Fed easing – and subsequent mortgage rate declines – increases substantially.
Rate Comparison to Outstanding Mortgage Distribution
Perhaps the most actionable timing indicator involves comparing current market rates to the distribution of outstanding mortgage rates. This comparison directly indicates the size of the refinanceable population.
Federal Housing Finance Agency and Freddie Mac data provides insight into outstanding mortgage rate distributions. When current market rates fall substantially below the median outstanding rate, large refinanceable populations exist. When market rates exceed most outstanding rates, refinance demand will remain minimal regardless of marketing investment.
Current Market Assessment Framework:
- Identify median and distribution of outstanding mortgage rates from FHFA or similar data
- Compare to current market rates available to qualified borrowers
- Estimate percentage of outstanding mortgages with rates exceeding current market by 0.75%+
- This percentage approximates the maximum refinanceable population
This framework explains why refinance marketing during high-rate environments wastes resources – the addressable market is structurally limited regardless of execution quality.
Operational Strategies for Market Timing
Translating market timing signals into operational execution requires organizational capabilities that enable rapid scaling when conditions favor refinance activity and efficient contraction when they do not.
Surge Capacity Planning
Refinance demand cycles exhibit extreme volatility – the difference between peak and trough demand can exceed 10x within 12-month periods. Operations must accommodate this volatility without maintaining excessive fixed costs during low-demand periods.
Traffic Source Scalability
Traffic acquisition infrastructure must enable rapid scaling when demand materializes. Key requirements include:
- Pre-negotiated rate cards with traffic sources enabling quick activation
- Tested creative assets ready for deployment across multiple platforms
- Established accounts with major platforms (Google, Facebook, programmatic) avoiding new account limitations
- Relationships with affiliate networks that can rapidly increase volume
- Content/SEO assets that capture organic demand during rate-driven search volume increases
Organizations that lack this infrastructure face weeks of ramp-up time when conditions shift favorably – often missing the most profitable portion of demand cycles.
Lender Relationship Management
Buyer (lender) relationships require cultivation during low-demand periods to ensure capacity during surges. Lenders constrain acquisition spending based on origination capacity, which expands slowly relative to demand fluctuations. Lead generators with established, trusted relationships receive allocation priority during capacity-constrained periods.
The 2020-2021 cycle demonstrated this dynamic clearly. Lenders faced origination capacity constraints despite strong demand – they had more leads than they could process. Lead generators with long-standing relationships maintained placements while newer entrants found limited buyer appetite despite apparently favorable conditions. Understanding the differences between mortgage lenders and brokers as lead buyers helps navigate these capacity dynamics.
Cost Structure Flexibility
Fixed costs during low-demand periods erode profitability accumulated during favorable cycles. Operational structures that enable cost reduction without eliminating capability preserve profitability across cycles.
| Cost Category | Fixed Approach | Flexible Approach |
|---|---|---|
| Creative Development | In-house design team | On-demand freelance + templates |
| Campaign Management | Full-time specialists | Cross-trained generalists + contractors |
| Call Center (if applicable) | Owned facility | Outsourced with variable pricing |
| Technology | Custom development | Configurable platform solutions |
The flexible approaches trade some efficiency during peak periods for sustainability across full cycles. Given the extreme demand volatility in refinance, this trade-off typically favors flexibility.
Lead Quality Calibration
Refinance lead quality requirements vary across rate environments, requiring calibration of lead generation parameters.
During Strong Demand (Favorable Rates)
When rate differentials create compelling refinance economics, lenders can profitably convert a broader range of leads. Credit score thresholds may relax, debt-to-income ratio limits may expand, and loan-to-value requirements may become more flexible. Lead generators can cast wider nets while maintaining buyer acceptance.
During Moderate Demand (Marginal Rates)
When refinance economics become marginal for many borrowers, lenders tighten criteria to maintain conversion economics. Only borrowers with strong profiles – excellent credit, substantial equity, stable income – represent viable opportunities. Lead generation must target more precisely to maintain buyer satisfaction.
During Weak Demand (Unfavorable Rates)
When the refinanceable population shrinks dramatically, only niche opportunities remain: cash-out refinance for debt consolidation regardless of rate, ARM-to-fixed conversions for specific borrower situations, or renovation-focused products. Lead generation pivots to these niches or scales down substantially.
Rate Threshold Triggers: Tactical Implementation
Converting rate monitoring into operational decisions requires establishing specific trigger thresholds that prompt defined actions.
Primary Rate Trigger Framework
Establish trigger thresholds based on rate spreads between current market rates and estimated median outstanding mortgage rates:
| Spread to Median Outstanding | Market Condition | Operational Response |
|---|---|---|
| Current rate > median | Unfavorable | Minimal activity, maintenance mode |
| Current rate within 0.50% of median | Neutral | Moderate activity, testing mode |
| Current rate 0.50-0.75% below median | Favorable | Scale preparation, increased activity |
| Current rate 0.75-1.00% below median | Strong | Aggressive scaling, full deployment |
| Current rate 1.00%+ below median | Optimal | Maximum investment, surge operations |
This framework provides objective decision criteria that remove emotional bias from timing decisions. When spreads cross thresholds, predefined operational responses activate.
Secondary Trigger: Rate Velocity
Rate direction and velocity provide additional timing intelligence beyond absolute levels. Rapidly declining rates signal potential demand acceleration that may exceed what spread levels alone suggest.
Declining Rates (Favorable Trend) When rates decline 0.25%+ over 4 weeks, demand typically accelerates beyond what current spread levels indicate. Borrowers who delayed refinance decisions begin acting as declining rates suggest further opportunity. Marketing response should lead observed demand changes.
Rising Rates (Unfavorable Trend) When rates increase after declining periods, urgency messaging becomes effective – “rates are rising, act now” creates conversion pressure. However, this window closes quickly as rates rise beyond refinanceable thresholds for remaining populations.
Stable Rates When rates stabilize after movements, demand normalizes to levels consistent with current spreads. Operations should calibrate to sustainable levels rather than expecting continued acceleration.
Trigger Integration: Decision Matrix
Combining spread levels and velocity indicators produces a decision matrix for operational scaling:
| Spread Level | Rate Declining | Rate Stable | Rate Rising |
|---|---|---|---|
| Unfavorable | Prepare for potential shift | Maintenance mode | Exit/minimal activity |
| Neutral | Increase testing | Standard operations | Begin wind-down |
| Favorable | Aggressive scale-up | Sustained investment | Urgency messaging, ride the wave |
| Strong | Maximum investment | Sustained maximum | Capture remaining demand |
| Optimal | All resources deployed | Maintain peak | Extract final value |
Product Variations and Timing Considerations
Different refinance products demonstrate varying sensitivity to rate triggers and market timing, enabling portfolio construction that maintains activity across broader market conditions.
Rate-and-Term Refinance
Traditional rate-and-term refinance – replacing existing mortgage with new mortgage at better rate – demonstrates highest sensitivity to rate triggers. This product depends entirely on rate differential economics; when differentials disappear, demand collapses completely.
Timing considerations: Focus investment when spreads exceed 0.75%. Exit quickly when spreads contract. This product offers highest volume during favorable conditions but lowest baseline demand otherwise.
Cash-Out Refinance
Cash-out refinance allows borrowers to access home equity while refinancing, providing debt consolidation or capital access value independent of rate savings. This creates demand that persists across rate environments, though at lower volumes than rate-driven waves.
Timing considerations: Maintain steady activity regardless of rate environment. Cash-out demand depends on home equity levels (strong after price appreciation periods), consumer debt levels, and major expense needs (education, renovation, debt consolidation). Rate-driven demand surges overlay onto this baseline.
The 2023-2024 period demonstrated cash-out resilience – while rate-and-term refinance approached zero volume, cash-out refinance continued at reduced but meaningful levels as homeowners accessed accumulated equity despite unfavorable rates.
Adjustable Rate Mortgage (ARM) Conversions
Borrowers with adjustable rate mortgages approaching rate adjustments may refinance to fixed rates regardless of current rate levels – they are protecting against future rate uncertainty rather than capturing current rate advantages.
Timing considerations: ARM conversion demand increases when rates appear likely to rise further or remain improved. Economic uncertainty increases appeal of fixed-rate security. Target ARM holders specifically when rate volatility increases.
Renovation and Construction Loans
Renovation-focused products (FHA 203k, Fannie Mae HomeStyle) enable financing for property improvements combined with refinancing. Demand depends on renovation intentions rather than rate differentials, creating baseline activity across rate environments.
Timing considerations: Renovation loan demand follows housing market dynamics – strong demand when home values support improvement investment returns, weaker when price appreciation stalls. Maintain consistent presence with renovation messaging regardless of rate environment.
Competitive Dynamics Across Rate Cycles
Refinance lead generation competitive intensity varies dramatically across rate cycles, affecting both market opportunity and strategic positioning.
During Favorable Rate Environments
When rate conditions trigger strong refinance demand, competition intensifies rapidly as operators observe opportunity and increase investment. This produces several dynamics:
Traffic Cost Inflation
Digital advertising costs for refinance-related keywords increase substantially during demand surges. “Mortgage refinance” CPC rates that might average $25-35 during normal periods can exceed $75-100 during peak demand. This cost inflation compresses margins even as volume increases.
Capacity Constraints
Lender origination capacity limits the total lead volume the market can absorb. When capacity constraints emerge, lead prices plateau or decline despite continued demand – lenders cannot profitably acquire leads they cannot convert. Recognizing capacity constraints enables strategic volume calibration.
Quality Competition
When lead volume exceeds buyer capacity, quality differentiation becomes paramount. Lenders prioritize leads from sources with demonstrated conversion performance, deprioritizing high-volume but lower-quality sources. Investment in quality metrics and buyer relationships pays dividends during capacity-constrained periods.
During Unfavorable Rate Environments
When rates eliminate refinance economics for most borrowers, competitive dynamics invert:
Competitor Exit
Many refinance-focused operators exit or dramatically reduce activity when demand collapses. This reduces competition for remaining opportunities – niche products, specific borrower segments, or preparation positioning for eventual cycle turns.
Buyer Relationship Building
Lenders maintain minimal acquisition activity during unfavorable periods, but relationships built during these periods position generators favorably for future demand cycles. Maintaining communication and modest activity preserves relationships while competitors disappear.
Cost Structure Testing
Low-demand periods enable experimentation with cost structures and processes without impacting significant revenue. Testing that might disrupt peak-period operations can proceed freely when volume is minimal.
Strategic Positioning Across Cycles
The most successful refinance lead generation operations maintain presence across complete rate cycles rather than entering during favorable conditions and exiting during unfavorable ones. This approach provides several advantages:
- Relationship continuity with lenders who value consistent partners
- Infrastructure readiness when conditions shift favorably
- Learning continuity that improves execution each cycle
- Cost structure optimization developed during low-demand periods
- Market intelligence from ongoing activity that informs timing decisions
The challenge involves maintaining this presence profitably. Operations structured with minimal fixed costs, diversification across refinance product variants, and integration with broader mortgage or financial services portfolios can sustain presence across full cycles.
Building a Refinance Timing Intelligence System
Systematic market timing requires organized intelligence gathering and analysis rather than ad hoc observation. Establishing formal processes improves timing decision quality and organizational responsiveness.
Data Sources and Monitoring Cadence
| Data Source | Information Provided | Monitoring Frequency |
|---|---|---|
| Mortgage Bankers Association Weekly Survey | Application volumes, refinance share | Weekly |
| Freddie Mac Primary Mortgage Market Survey | Current average rates | Weekly |
| Federal Reserve Communications | Policy direction signals | Real-time (FOMC meetings, speeches) |
| Treasury Yields | Rate direction indicators | Daily |
| FHFA House Price Index | Equity levels affecting cash-out | Monthly |
| Black Knight/ICE Mortgage Monitor | Outstanding mortgage rate distribution | Monthly |
| Competitor Activity | Market sentiment proxy | Continuous |
Decision Framework Documentation
Document trigger thresholds and predetermined responses before conditions change. This removes emotional decision-making during rapidly changing environments and ensures organizational alignment on responses.
Example Decision Document:
When 30-year fixed rates decline below 5.5% while median outstanding rate exceeds 6.0%:
- Increase paid media budgets by 50%
- Activate dormant traffic source relationships
- Shift creative messaging to rate savings focus
- Alert lender partners to expected volume increases
- Prepare additional call center capacity if applicable
When 30-year fixed rates exceed 6.5% while median outstanding rate remains below 4.5%:
- Reduce paid media to testing-only levels
- Shift messaging to cash-out and niche products
- Focus on relationship maintenance with key lenders
- Reduce variable costs to maintenance levels
Scenario Planning
Develop operational plans for multiple rate scenarios rather than attempting point predictions:
Scenario A: Rates Decline Substantially (Fed Easing Cycle) Timeline expectations, scaling sequence, target volumes, resource requirements, lender communication plan.
Scenario B: Rates Remain Improved (Sustained Tight Policy) Niche product focus, cost reduction targets, relationship maintenance activities, diversification options.
Scenario C: Rate Volatility (Uncertain Economic Conditions) Flexibility maintenance, rapid response capabilities, messaging strategies for different rate movements.
Having plans developed before conditions materialize enables rapid execution when scenarios unfold.
Integration with Broader Lead Generation Portfolios
Refinance lead generation volatility makes it challenging as a standalone business but valuable as a portfolio component that provides extraordinary returns during favorable conditions while contributing modestly during unfavorable periods.
Portfolio Complementarity
Identify lead generation verticals that demonstrate different cyclical patterns than refinance. Understanding seasonal trends across lead generation verticals helps construct portfolios with complementary timing:
Counter-Cyclical Complements
When refinance demand collapses (high rate environment), certain verticals may strengthen:
- Home improvement loans (alternative to refinance for accessing equity)
- Debt consolidation through personal loans
- Purchase mortgage for buyers benefiting from reduced competition
Non-Cyclical Complements
Verticals with consistent demand regardless of rate environment provide portfolio stability:
- Auto insurance
- Medicare products
- Tax services
- Essential healthcare
A portfolio combining refinance opportunity capture with stable verticals smooths revenue volatility while maintaining exposure to refinance upside.
Capital Allocation Across Cycles
Reserve capital accumulated during favorable refinance periods for deployment across the portfolio. This approach treats refinance surpluses as strategic reserves rather than consumption:
During Favorable Refinance Conditions:
- Maximize refinance investment within quality constraints
- Accumulate surplus capital beyond operating needs
- Maintain (do not expand) other vertical investments
During Unfavorable Refinance Conditions:
- Deploy accumulated capital into stable or counter-cyclical verticals
- Maintain minimal refinance presence for cycle preparation
- Build capabilities for next favorable cycle
This capital allocation approach transforms refinance volatility from a business risk into a strategic advantage – accumulated capital enables opportunities unavailable to competitors without refinance surge profits.
Key Takeaways
-
Refinance demand triggers activate at specific rate spread thresholds – meaningful demand emerges when current rates fall 0.75%+ below median outstanding mortgage rates, with optimal conditions occurring at 1.0%+ spreads.
-
The 2020-2021 refinance surge demonstrated that operators positioned correctly before rate movements can generate multi-year revenue in compressed timeframes, while late entrants face saturated markets and compressed margins.
-
Federal Reserve policy communications provide the most actionable leading indicators for rate movements, enabling 4-8 weeks of preparation time before demand shifts materialize in consumer behavior.
-
The refinanceable population – borrowers for whom current rates offer compelling improvement – varies dynamically based on rate levels relative to outstanding mortgage rate distributions, determining the maximum addressable market regardless of marketing investment.
-
Surge capacity planning requires maintaining traffic source relationships, creative assets, and lender relationships during low-demand periods to enable rapid scaling when conditions shift favorably.
-
Cash-out refinance demonstrates baseline demand across rate environments because equity access and debt consolidation value exists independent of rate differential savings.
-
Traffic cost inflation during favorable periods can compress margins even as volume increases, requiring quality differentiation and capacity-conscious volume management.
-
Rate velocity (direction of rate movements) provides additional timing intelligence beyond absolute rate levels – declining rates signal accelerating demand, rising rates create urgency windows followed by demand collapse.
-
Integration with counter-cyclical and non-cyclical verticals transforms refinance volatility from business risk into strategic opportunity by enabling capital accumulation during surges and deployment across stable verticals during unfavorable periods.
-
Systematic intelligence gathering with predefined trigger thresholds and response protocols removes emotional decision-making and ensures organizational readiness for rapidly changing market conditions.
Frequently Asked Questions
What rate reduction typically triggers refinance demand?
Meaningful refinance demand typically requires rate reductions of at least 0.75% below borrowers’ existing mortgage rates. At this threshold, break-even periods compress to 24-32 months for typical closing costs, making refinance attractive for homeowners planning to stay 3+ years. Optimal demand conditions emerge at 1.0%+ rate reductions, where break-even periods drop below 24 months and refinance becomes compelling for broader populations. The 2020-2021 refinance surge occurred when rates dropped 1.5%+ below recent origination rates, creating extraordinary demand that overwhelmed lender capacity.
How far in advance can refinance demand shifts be predicted?
Rate movements that drive refinance demand can typically be anticipated 4-8 weeks before consumer behavior changes through monitoring Federal Reserve communications and Treasury yield movements. Fed policy signals – FOMC meeting statements, dot plot projections, and official speeches – provide directional guidance about rate intentions. Treasury yield movements precede mortgage rate changes by 1-2 weeks as markets price in expectations. However, precise timing and magnitude remain unpredictable; the goal is directional positioning rather than exact prediction. Maintaining operational readiness enables rapid response when signals materialize.
Why does refinance demand collapse so dramatically when rates rise?
Refinance depends entirely on rate differential economics – the savings from a new lower rate must exceed closing costs within a reasonable timeframe. When rates rise above borrowers’ existing rates, this calculation produces negative results and refinancing becomes financially irrational. Unlike purchase mortgage demand, which persists because people need homes regardless of rates, refinance is purely optional financial optimization. When optimization becomes impossible, demand approaches zero. The 2022-2024 period demonstrated this dramatically: when rates rose above 7% while most outstanding mortgages carried rates below 4%, virtually no borrowers benefited from refinancing.
How should lead generators maintain operations during unfavorable rate environments?
During unfavorable rate periods, operations should shift to maintenance mode with several strategic focuses. First, maintain minimal but continued activity to preserve lender relationships that provide priority allocation during future surges. Second, focus on niche products – cash-out refinance, ARM conversions, renovation loans – that maintain demand independent of rate differentials. Third, reduce variable costs while preserving core capabilities needed for rapid scaling when conditions improve. Fourth, use low-demand periods for testing, process improvement, and preparation for the next favorable cycle. The goal is survival with readiness rather than maximizing activity in unfavorable conditions.
What leading indicators signal upcoming rate declines?
Several indicators provide advance warning of potential mortgage rate declines. Federal Reserve communications suggesting policy easing – rate cut expectations or quantitative easing programs – typically precede rate movements by 4-8 weeks. Treasury yield declines of 0.25%+ over 4-week periods signal mortgage rate reductions with 1-2 week lag. Economic data suggesting Fed accommodation – declining inflation, rising unemployment, weakening GDP growth – increases probability of rate-supportive policy changes. No single indicator provides certainty, but combinations of favorable signals increase confidence in positioning decisions.
How does cash-out refinance demand differ from rate-and-term refinance?
Cash-out refinance demand operates on different economics than rate-and-term refinance because borrowers receive value (equity access) beyond rate savings. Homeowners seeking debt consolidation, renovation financing, or major expense funding may accept similar or even slightly higher rates if they gain access to substantial equity. This creates baseline demand that persists across rate environments, though at lower volumes than rate-driven waves. During the 2023-2024 high-rate period, cash-out refinance maintained meaningful activity while rate-and-term refinance approached zero volume. Lead generation strategies should address cash-out value propositions to maintain activity regardless of rate environment.
What happens to lead pricing during refinance demand surges?
Lead pricing dynamics during refinance surges follow capacity-constrained market patterns. Initially, when demand increases faster than lender acquisition budgets, lead prices rise as buyers compete for limited supply. As demand continues growing, lender origination capacity constraints emerge – they cannot profitably acquire leads faster than they can process applications. At this point, lead prices plateau or decline despite continued demand because lenders cannot absorb additional volume. Quality differentiation becomes paramount during capacity-constrained periods; lenders prioritize leads from sources with demonstrated conversion performance, accepting fewer leads from sources with weaker track records.
How important are lender relationships for refinance lead generation success?
Lender relationships prove critical for refinance lead generation success, particularly during demand surges when capacity constraints emerge. Lenders with limited acquisition capacity prioritize relationships with proven lead sources who deliver consistent quality. Generators who maintained relationships during low-demand periods receive preferential treatment during surges – continued placements when others face rejections, faster payment processing, and better communication about changing requirements. Building these relationships requires activity during unfavorable periods when lenders appreciate partners who remain engaged rather than disappearing until conditions improve.
Should lead generators attempt to predict exact rate timing?
Lead generators should avoid attempting precise rate timing predictions and instead focus on directional positioning and rapid response capability. Rate movements depend on complex interactions between economic conditions, Fed policy, and market dynamics that defy precise prediction. The more valuable approach involves maintaining operational readiness – established traffic sources, tested creative, active lender relationships – that enables rapid scaling when favorable conditions emerge. Predetermined trigger thresholds and response protocols ensure organizations act quickly on observed rate movements rather than waiting for perfect certainty that never arrives.
How do refinance lead generation economics compare across different loan amounts?
Refinance economics scale favorably with loan amount because closing costs represent smaller percentages of larger loans while savings scale proportionally. A 1% rate reduction on a $200,000 mortgage saves approximately $165 monthly; on a $600,000 mortgage, the same rate reduction saves approximately $495 monthly. With similar closing costs, break-even periods compress dramatically for larger loans, making refinance attractive at smaller rate differentials. This creates geographic and demographic targeting implications – markets with higher home values and larger average mortgage sizes demonstrate stronger refinance demand at given rate levels. Lead generation strategies can calibrate targeting toward higher-value loans to maintain viability during marginal rate environments.
What role does home equity play in refinance market timing?
Home equity levels affect refinance market timing through multiple mechanisms. First, equity enables cash-out refinance demand that persists regardless of rate differential economics. Following periods of home price appreciation, accumulated equity creates refinance motivation even without rate savings. Second, equity affects qualification – borrowers without adequate equity (typically 20%+) face higher rates or cannot refinance at all, limiting the refinanceable population. Third, equity provides collateral that supports lender confidence and competitive rate offerings. Monitoring home price trends through indices like Case-Shiller or FHFA House Price Index provides insight into equity-driven demand potential.
How quickly should operations scale when favorable rate conditions emerge?
Operations should scale as rapidly as quality maintenance permits when favorable rate conditions emerge. Rate-driven demand windows can close quickly if conditions reverse, making speed valuable. However, scaling faster than quality controls support creates lead quality problems that damage lender relationships and reduce revenue per lead. The optimal approach involves aggressive but staged scaling: initial investment increase of 50-100%, followed by assessment of quality metrics and buyer feedback, then continued scaling if metrics support expansion. Pre-established relationships with traffic sources and lenders enable faster scaling than building these relationships during demand windows.
Sources
- Freddie Mac Primary Mortgage Market Survey - Weekly benchmark survey of 30-year and 15-year fixed-rate mortgage averages, the most widely cited mortgage rate indicator
- Freddie Mac PMMS Archives - Historical weekly mortgage rate data enabling trend analysis and rate cycle identification for timing strategies
- MBA Weekly Mortgage Applications Survey - Mortgage Bankers Association data on application volumes, refinance share, and market index tracking demand shifts in real time
- Federal Reserve FOMC Calendar - Schedule of Federal Open Market Committee meetings and statements that drive rate expectations and mortgage market movements
- FHFA House Price Index (via FRED) - Federal Housing Finance Agency quarterly index tracking home price appreciation that affects equity positions and refinance eligibility
- U.S. Treasury Daily Yield Curve Rates - Daily Treasury yield data including the 10-year note that serves as the primary benchmark for 30-year mortgage rate movements
- Federal Reserve H.15 Selected Interest Rates - Daily and weekly interest rate data published by the Fed covering Treasury securities, federal funds rate, and commercial paper
- ICE Mortgage Technology Origination Insight Reports - Monthly origination data on closing rates, time-to-close, and FICO distributions from the largest mortgage technology platform
Conclusion
Mortgage refinance lead generation rewards operators who understand market timing dynamics and build operational capabilities that enable rapid response to changing conditions. The extreme demand volatility inherent in refinance markets – driven by the binary economics of rate differential calculations – creates both substantial opportunity during favorable periods and significant challenges during unfavorable ones.
Success requires treating refinance as a strategically managed vertical rather than an opportunistic side business. This means monitoring leading indicators that signal rate movements, maintaining relationships and capabilities during low-demand periods, establishing trigger thresholds that prompt predetermined operational responses, and integrating refinance with complementary verticals that smooth portfolio volatility.
The next favorable refinance cycle will arrive eventually – the question is whether organizations will be positioned to capture the opportunity or scrambling to build capabilities while competitors with established positions capture available demand. The preparation work happens during unfavorable periods; the returns materialize when conditions shift.