The linear sales funnel dominated commercial strategy for over a century. In 2025, that model is fundamentally broken. Here’s how revenue operations, flywheel thinking, and integrated lead management are replacing the funnel – and why operators who cling to linear thinking are leaving money on the table.
The funnel metaphor made sense when buyers followed predictable paths. They saw an ad, considered the product, made a purchase, and either returned or didn’t. Marketing generated awareness at the top, sales converted interest in the middle, and customer success handled the bottom. Clean. Linear. Manageable.
That world no longer exists.
Today’s B2B purchase involves an average of 6-10 stakeholders. Buyers complete 70% of their research before contacting sales. They enter and exit consideration multiple times, gathering information across 27+ touchpoints before making decisions. They consult peer reviews, ask AI assistants, seek community validation, and loop back to earlier stages repeatedly.
The funnel can’t map this behavior. It assumes gravity – prospects naturally flow downward through stages. But modern buyers move sideways, upward, and in circles. They stall for months, then accelerate in days. They bring new stakeholders into consideration at the final stage. They restart the entire process after near-purchase.
What replaces the funnel? A revenue engine – a circular, synchronized system where marketing, sales, and customer success operate as integrated components rather than sequential handoffs. Where customer advocacy feeds lead generation. Where data flows bidirectionally. Where revenue optimization happens continuously, not stage-by-stage.
This guide covers the evolution from funnel to flywheel, how revenue operations (RevOps) integrates previously siloed functions, the mechanics of modern lead management within the revenue engine framework, and practical implementation strategies for operators transitioning from linear to circular models.
The Funnel’s Fatal Flaw
The sales funnel, attributed to E. St. Elmo Lewis in 1898, was revolutionary for its time. AIDA – Awareness, Interest, Desire, Action – provided the first systematic framework for understanding buyer psychology. Marketers could finally visualize the customer journey and allocate resources accordingly.
For a century, it worked. Mass media delivered awareness. Sales teams cultivated interest. Closing techniques converted desire to action. The model scaled from door-to-door sales to television advertising to early digital marketing.
Then three simultaneous shifts broke the model.
Shift 1: Buyer Empowerment
The internet transferred information asymmetry from sellers to buyers. Before 2000, salespeople controlled product information. Buyers needed to engage sales to learn pricing, features, and competitive positioning.
Today, buyers access unlimited information without seller involvement. Product reviews, pricing comparisons, feature matrices, competitor analyses, and community discussions are all available before first contact. Research indicates that B2B buyers now complete 70-80% of their purchase journey independently.
The top of the funnel didn’t disappear – it became invisible to sellers. Awareness and interest happen in dark social, peer conversations, and AI-assisted research that never touches your analytics.
Shift 2: Committee Decisions
The solo buyer making swift decisions has become the exception. Gartner research shows that B2B purchasing now involves 6-10 stakeholders across multiple functions. Each stakeholder has different priorities, information needs, and decision criteria.
The funnel assumes a single buyer moving through linear stages. Reality involves a buying group where different stakeholders are at different stages simultaneously – with each capable of restarting the process if their concerns aren’t addressed.
Shift 3: Post-Purchase Revenue
The original funnel ended at purchase. Customer success was an afterthought – handle support tickets and hope for renewal.
Today, expansion revenue – upsells, cross-sells, and account growth – often exceeds new acquisition revenue for mature companies. Net revenue retention above 100% means existing customers generate more revenue than churn removes. Customer success isn’t post-funnel; it’s revenue generation.
The funnel’s endpoint is actually a midpoint in customer value creation.
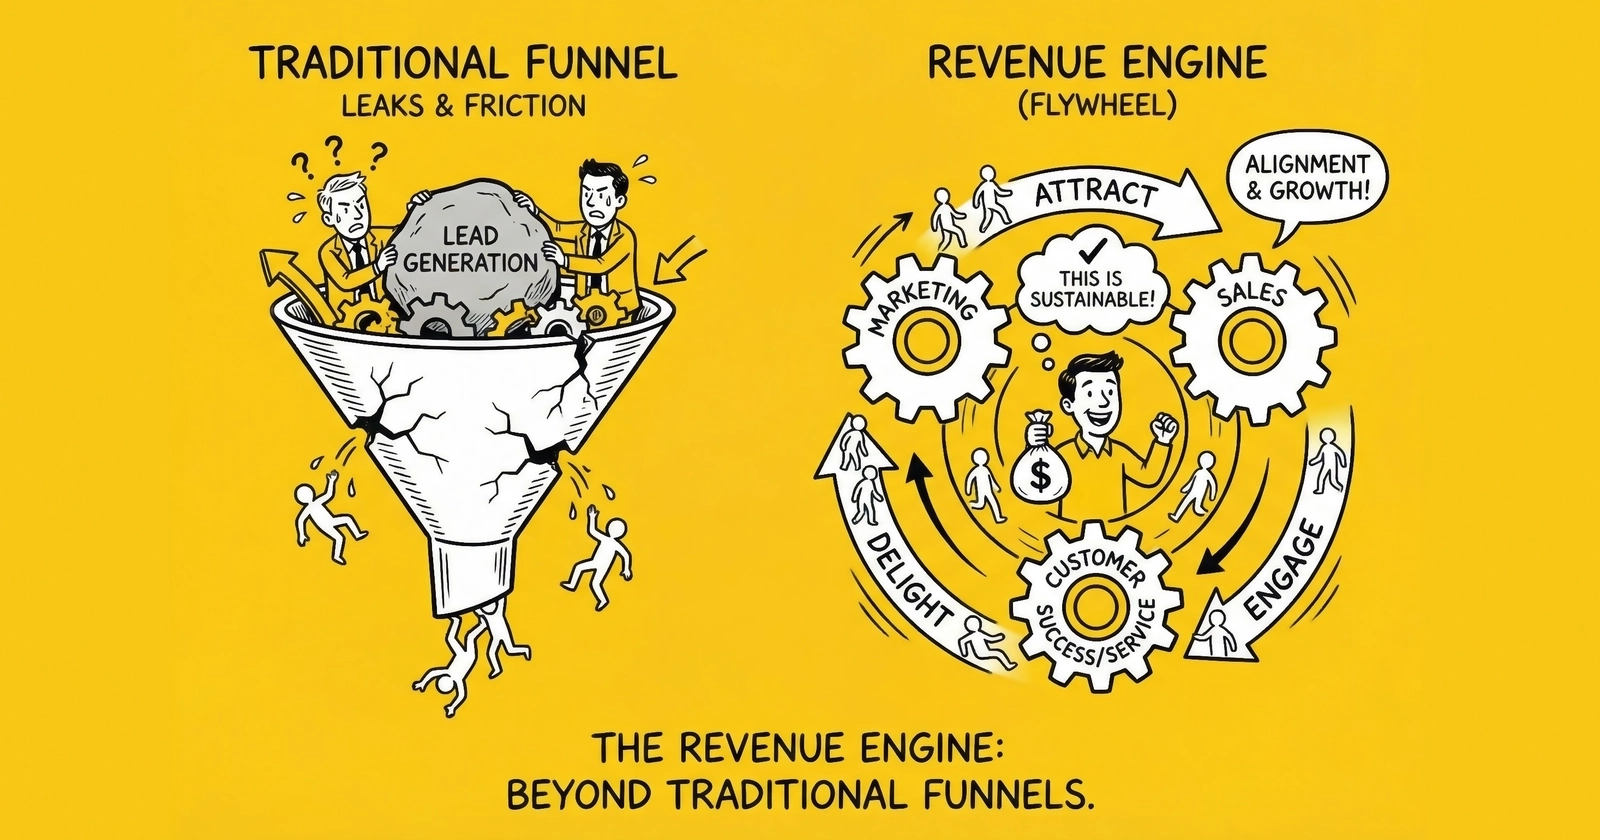
The Flywheel Model: Momentum Over Gravity
HubSpot popularized the flywheel metaphor in 2018, though the concept emerged from physics via Jim Collins’ work on organizational momentum.
The flywheel operates on fundamentally different principles than the funnel. A funnel relies on gravity – input at the top, output at the bottom. Energy is expended pushing prospects down. A flywheel relies on momentum – energy stored and released continuously. Each push compounds previous effort.
The core insight: happy customers don’t just renew – they accelerate future growth. Customer advocacy, referrals, case studies, reviews, and word-of-mouth reduce customer acquisition costs while improving conversion rates. The system becomes self-reinforcing.
Flywheel Components
The flywheel has three phases that feed each other:
-
Attract: Drawing potential customers through valuable content, thought leadership, and community presence. This replaces the funnel’s “awareness” stage but operates continuously rather than feeding a linear process.
-
Engage: Creating meaningful interactions through personalized outreach, relevant content, and genuine help. This replaces “interest” and “consideration” but recognizes that engagement happens across multiple channels and stakeholders simultaneously.
-
Delight: Delivering exceptional customer experience that converts buyers into advocates. This replaces “post-sale” but reframes customer success as revenue generation rather than cost center.
The critical difference: delight feeds attract. Satisfied customers create content, leave reviews, make referrals, and participate in communities. Their advocacy attracts new prospects, who engage, become customers, and – if delighted – perpetuate the cycle.
Where Friction Lives
Flywheel thinking obsesses over friction – the forces that slow momentum. Common friction points include:
- Handoff delays: Leads waiting for follow-up, customers waiting for support responses, opportunities waiting for approval
- Information gaps: Sales doesn’t know what marketing communicated, customer success doesn’t know what sales promised, support doesn’t know the customer’s history
- Process bureaucracy: Excessive approvals, redundant data entry, rigid workflows that don’t match buyer behavior
- Poor customer experience: Hard-to-navigate sites, confusing pricing, unresponsive support
Every friction point slows the flywheel. The compounding nature of momentum means small friction reductions create large velocity gains over time.
Revenue Operations: Unifying the Engine
Revenue Operations (RevOps) emerged as the organizational response to flywheel thinking. Where traditional structures siloed marketing, sales, and customer success, RevOps integrates them under unified strategy, shared metrics, and common technology.
The RevOps market has grown substantially in recent years. Research from Boston Consulting Group suggests that companies with aligned revenue operations achieve 10-20% higher revenue growth rates than those with siloed functions. Forrester data indicates that companies with RevOps alignment see 19% faster revenue growth and 15% higher profitability.
The RevOps Function
A mature RevOps function encompasses several domains:
-
Process Optimization: Designing and continuously improving the end-to-end revenue process. This includes lead routing, opportunity management, handoff protocols, and customer lifecycle management.
-
Technology Stack Management: Owning the revenue technology ecosystem – CRM, marketing automation, sales engagement, customer success platforms, and the integrations connecting them. A single team ensures tools work together rather than creating data silos.
-
Analytics and Insights: Providing unified reporting across the revenue engine. This means shared definitions (what exactly is an MQL?), integrated dashboards, and attribution models that span marketing through customer success.
-
Forecasting and Planning: Creating revenue projections that account for the full customer lifecycle, not just pipeline. Including expansion, contraction, and churn in forecasts alongside new business.
-
Data Governance: Establishing single sources of truth for customer data, ensuring consistency across systems, and maintaining data quality.
The Revenue Data Architect Role
A new role has emerged within RevOps: the Revenue Data Architect. This position bridges IT, sales, and marketing to create coherent commercial data schemas.
The Revenue Data Architect owns:
- Data model design across CRM, marketing automation, and customer success platforms
- Integration architecture ensuring consistent data flow
- Definition standardization (what fields mean what, across all systems)
- Data quality monitoring and remediation
- Analytics infrastructure enabling unified reporting
This role recognizes that data fragmentation is the primary obstacle to revenue engine efficiency. Without architectural thinking, each team creates their own fields, definitions, and metrics – making integration impossible.
Modern Lead Management Within the Revenue Engine
Lead management looks fundamentally different within a revenue engine framework. The funnel treated leads as raw material entering a manufacturing process. The revenue engine treats leads as relationships to develop over time.
Lead Lifecycle Stages
Modern lead management uses lifecycle stages rather than funnel stages:
-
Subscriber: Opted in for content but hasn’t expressed purchase intent. The relationship is nascent – they’ve consented to communication but haven’t indicated business need.
-
Lead: Demonstrated some interest beyond content consumption. Visited pricing page, attended webinar, downloaded product-specific content. The signal suggests potential fit.
-
Marketing Qualified Lead (MQL): Meets defined criteria indicating readiness for sales engagement. The criteria should be based on predictive models – not assumptions – identifying behaviors that correlate with conversion.
-
Sales Qualified Lead (SQL): Sales has verified budget, authority, need, and timeline. The opportunity is real, not theoretical.
-
Opportunity: Active deal with defined scope, stakeholders, and timeline. Movement through opportunity stages reflects genuine progress, not administrative compliance.
-
Customer: Closed won. But unlike the funnel, this isn’t the endpoint – it’s the beginning of expansion potential.
-
Advocate: Actively promotes your solution through referrals, reviews, case studies, or community participation. The highest-value segment of your customer base.
Lead Scoring Evolution
Traditional lead scoring assigned point values based on assumptions: job title worth X points, company size worth Y points, content download worth Z points. The approach was better than no scoring but suffered from fundamental flaws.
The assumptions were often wrong. A VP title might score highly, but analysis might reveal that Directors at specific company types convert better. Content downloads might add points, but some content correlates with research-only behavior, not purchase intent.
Modern lead scoring uses machine learning trained on actual conversion data. The system identifies patterns – including non-obvious combinations and temporal sequences – that predict conversion probability for your specific business.
Effective scoring models include:
-
Behavioral signals: Not just page visits, but engagement depth, sequence patterns, and recency-weighted activity
-
Firmographic fit: Company size, industry, technology stack, and growth trajectory matched against ideal customer profiles
-
Intent data: Third-party signals indicating active research in your category
-
Engagement velocity: Acceleration in activity often predicts imminent decision
-
Negative indicators: Behaviors that predict non-conversion – perhaps extensive documentation downloads without demo requests, or repeat visits without deepening engagement
Companies implementing predictive lead scoring report focusing sales effort on 20% of leads generating 80% of revenue – a distribution manual scoring rarely achieves.
Lead Routing in the Revenue Engine
Lead routing connects the right lead with the right person at the right time. In the revenue engine, routing becomes more sophisticated than simple round-robin assignment.
-
Skills-based routing: Matching lead characteristics to rep expertise. Enterprise leads to enterprise-experienced reps. Technical evaluators to technically fluent reps. Industry-specific leads to vertical specialists.
-
Account-based routing: When leads arrive from target accounts, routing to the assigned account executive regardless of territory. The relationship context matters more than geographic convenience.
-
Buying group routing: Recognizing when new leads belong to existing opportunities and routing to the engaged rep. Buying group detection requires identity matching across form fills to connect stakeholders.
-
Capacity-based routing: Distributing leads based on current rep capacity, not just territory. A rep with 40 active opportunities shouldn’t receive the same lead flow as one with 15.
-
SLA-driven routing: Automatic escalation when leads aren’t actioned within defined timeframes. Speed-to-lead remains critical – research shows 78% of customers buy from the first responder, and leads contacted within one minute convert at 391% higher rates.
The Revenue Engine Tech Stack
The technology supporting the revenue engine has consolidated and integrated. Best-of-breed point solutions gave way to platforms, and platforms are giving way to unified revenue intelligence systems.
Core components include:
-
CRM (Customer Relationship Management): The central repository for customer data. Salesforce, HubSpot, and Microsoft Dynamics dominate, with vertical-specific solutions in regulated industries.
-
Marketing Automation: Orchestrating multi-channel campaigns, lead nurturing, and scoring. The line between marketing automation and CRM has blurred as platforms expand.
-
Sales Engagement: Tools enabling systematic outreach – sequences, cadences, templates, and analytics. Outreach, SalesLoft, and similar platforms structure sales activity.
-
Customer Success Platforms: Managing customer health, driving adoption, and identifying expansion opportunities. Gainsight, Totango, and ChurnZero lead this category.
-
Revenue Intelligence: AI-driven analysis of conversation data, email patterns, and engagement signals to predict outcomes and guide actions. Gong, Chorus, and Clari represent this layer.
-
Data Infrastructure: CDPs (Customer Data Platforms), data warehouses, and integration platforms ensuring consistent data across systems.
The trend is toward consolidation. Buyers increasingly seek fewer vendors covering broader functionality. The integration burden of 15+ point solutions has made platforms attractive despite feature depth trade-offs.
Integration Strategies: Building Your Revenue Engine
Transitioning from funnel thinking to revenue engine operation requires organizational, process, and technology changes. The transformation doesn’t happen overnight – expect 18-36 months for full maturity.
Phase 1: Foundation (Months 1-6)
Unified Definitions: Establish shared language across marketing, sales, and customer success. What exactly is an MQL? When does an opportunity reach each stage? What defines a healthy customer? Without common definitions, measurement becomes meaningless.
Data Architecture: Create single sources of truth for customer data. This typically means CRM as the system of record, with integrations ensuring other systems stay synchronized. Clean historical data before building on it.
Attribution Model: Implement multi-touch attribution that spans the full lifecycle. The model should connect marketing activities to revenue outcomes, including expansion revenue from existing customers.
Process Documentation: Map current processes before redesigning them. Understanding handoff points, SLAs, and approval workflows provides the baseline for improvement.
Phase 2: Integration (Months 6-12)
Unified Reporting: Build dashboards that span marketing through customer success. Revenue leaders should see the complete picture – pipeline, conversion rates, customer health, expansion opportunities – in integrated views.
Lifecycle Marketing: Implement nurturing programs that span the full lifecycle, not just pre-sale. Customer education, adoption campaigns, and expansion messaging should flow through the same automation systems as lead nurturing.
Revenue Process Design: Redesign processes to minimize friction. Focus on handoff points – where leads wait, where information gets lost, where buyers experience delays.
Tech Stack Rationalization: Audit tools for redundancy and integration gaps. Consolidate where possible. Ensure remaining tools integrate properly.
Phase 3: Optimization (Months 12-24)
Predictive Analytics: Deploy machine learning models for lead scoring, churn prediction, and expansion identification. Models trained on your data outperform generic algorithms.
Intelligent Automation: Automate routing, task creation, and escalation based on data triggers. Reduce manual steps that slow the engine.
Revenue Orchestration: Coordinate cross-functional plays – ABM campaigns targeting accounts, multi-stakeholder engagement for buying groups, coordinated outreach for expansion opportunities.
Continuous Improvement: Establish regular analysis of friction points. Monitor velocity at each stage. A/B test process changes. The revenue engine is never finished – optimization is ongoing.
Phase 4: Intelligence (Months 24+)
AI-Driven Insights: Implement revenue intelligence analyzing conversations, emails, and engagement patterns. Surface risks and opportunities automatically.
Predictive Forecasting: Move from pipeline-based forecasting to AI-driven predictions incorporating engagement signals, historical patterns, and market factors.
Customer 360: Complete customer views integrating product usage, support interactions, marketing engagement, and financial data. Customer success teams should know everything relevant before every conversation.
The Metrics That Matter
Revenue engine thinking requires different metrics than funnel thinking. Stage-based conversion rates still matter, but additional measures capture the circular, momentum-based nature of the system.
Velocity Metrics
-
Lead-to-Revenue Velocity: Total time from first touch to closed deal. Shortening this velocity accelerates cash flow and capacity.
-
Stage Velocity: Time spent in each lifecycle stage. Identifying where deals stall enables targeted friction reduction.
-
Speed-to-Lead: Time from form submission to first meaningful response. Best-in-class operations respond in under five minutes.
-
Cycle Time by Segment: Velocity broken down by deal size, industry, or customer type. Different segments move at different speeds – understand your baseline by segment.
Efficiency Metrics
-
Customer Acquisition Cost (CAC): Total cost to acquire a customer, including marketing, sales, and onboarding. The denominator should be customers, not leads.
-
CAC Payback Period: Months required to recoup acquisition cost through gross margin. Shorter payback reduces risk and improves unit economics.
-
LTV:CAC Ratio: Lifetime value divided by acquisition cost. Healthy SaaS businesses target 3:1 or higher. Ratios below 3:1 indicate unsustainable acquisition spending.
-
Marketing Efficiency Ratio (MER): Total revenue divided by total marketing spend. A blunt but useful measure of overall marketing productivity.
Flywheel Metrics
-
Net Revenue Retention (NRR): Revenue from existing customers after expansion, contraction, and churn. NRR above 100% means existing customers generate net growth.
-
Customer Advocacy Rate: Percentage of customers who actively refer, review, or participate in marketing. Advocacy indicates flywheel momentum.
-
Referral Revenue Contribution: Percentage of pipeline sourced from customer referrals. Higher percentages indicate a stronger flywheel effect.
-
Customer Health Score: Composite measure predicting renewal and expansion probability. Healthy customers become advocates; unhealthy customers churn.
Attribution Metrics
-
Multi-Touch Attribution: Credit distributed across all touchpoints influencing revenue, weighted by influence model.
-
First-Touch Attribution: Source that initiated the relationship. Useful for understanding awareness channels.
-
Last-Touch Attribution: Source immediately preceding conversion. Useful for understanding closing channels.
-
Full-Funnel Attribution: Credit distributed across pre-sale and post-sale touchpoints, including expansion revenue. The full picture of revenue source.
Account-Based Revenue Engines
For companies targeting enterprise accounts, the revenue engine operates at the account level rather than the lead level. Account-Based Marketing (ABM) has evolved into Account-Based Experience (ABX) – orchestrating coherent journeys for entire buying committees.
The ABX Difference
Traditional ABM focused on marketing to accounts. ABX integrates sales and customer success into account orchestration. The entire revenue team coordinates around account strategy.
Key ABX capabilities:
-
Account Intelligence: Aggregating signals across all stakeholders – engagement, intent data, technographic changes, news events – into account-level views.
-
Buying Group Detection: Identifying when multiple leads belong to the same opportunity. Connecting stakeholders enables coordinated engagement.
-
Orchestrated Engagement: Coordinating marketing, sales, and customer success activities. When marketing sends a campaign, sales knows and aligns outreach. When customer success identifies expansion opportunity, marketing supports with targeted content.
-
Account Health Scoring: Composite scores incorporating engagement across all stakeholders, product usage, support interactions, and renewal indicators.
Buying Group Dynamics
B2B purchasing involves committees, and committees have politics. Understanding buying group dynamics improves conversion:
-
Champion: The internal advocate who pushes your solution. Champions need ammunition – content, ROI models, competitive positioning – to sell internally.
-
Decision Maker: The person with signature authority. Often not the most engaged stakeholder. May only appear late in the process.
-
Influencers: Stakeholders whose opinions matter. Technical evaluators, end users, finance reviewers – each has concerns requiring attention.
-
Blockers: Stakeholders who can stop deals. Perhaps invested in status quo, perhaps favoring competitors, perhaps skeptical of change. Identifying blockers early enables proactive engagement.
-
Procurement: Often appears late, focused on contract terms rather than solution fit. Procurement can delay or derail deals if not handled properly.
The revenue engine must engage the full buying group – not just the champion. Research indicates 78% of single-threaded deals stall. Deals with multiple engaged stakeholders close at higher rates.
The Customer Success Revenue Connection
In the revenue engine, customer success is revenue generation – not just retention. Expansion revenue from existing customers often exceeds new acquisition for mature companies.
Expansion Revenue Models
-
Upsell: Selling higher-tier products or additional capacity. Upsells typically happen at renewal or when usage approaches limits.
-
Cross-Sell: Selling additional products to existing customers. Effective cross-sell requires understanding customer needs beyond current usage.
-
Expansion within Account: Selling to additional departments, divisions, or geographies within enterprise accounts. Land-and-expand strategies depend on this motion.
Customer Success as Lead Generation
Satisfied customers become lead sources through several mechanisms:
-
Referrals: Direct introductions to peers. Referred leads convert at higher rates and shorter cycles than other sources.
-
Reviews: Public endorsements on G2, Capterra, TrustRadius, and similar platforms. Reviews influence research-phase buyers who never contact sales.
-
Case Studies: Detailed success stories providing proof points. Case studies serve as mid-funnel content accelerating consideration.
-
Community Participation: Customers active in user groups, forums, and events. Community engagement builds awareness and trust simultaneously.
-
Speaking and Content: Customers willing to speak at events or contribute to content. Authentic customer voices outperform vendor messaging.
The revenue engine deliberately cultivates these behaviors. Customer success teams identify advocates, marketing equips them with content and opportunities, and sales leverages their relationships.
Customer Health and Churn Prediction
Preventing churn preserves revenue. Predicting churn enables proactive intervention before customers decide to leave.
Customer health scoring combines:
-
Product Usage: Feature adoption, login frequency, depth of engagement. Declining usage predicts churn.
-
Support Interactions: Ticket volume, sentiment, resolution satisfaction. Rising support burden indicates frustration.
-
Stakeholder Engagement: Contact with success managers, event attendance, content consumption. Disengagement predicts churn.
-
Business Context: Company changes, market conditions, budget cycles. External factors affect renewal likelihood.
AI-driven churn prediction identifies at-risk accounts before obvious signals emerge. Patterns in usage data, support interactions, and engagement often predict churn 90-180 days before renewal.
Technology Trends Reshaping Revenue Engines
Several technology shifts are transforming revenue engine operations.
AI-Powered Revenue Intelligence
Revenue intelligence platforms analyze conversations, emails, and engagement patterns to surface insights. Applications include:
-
Deal Risk Prediction: Identifying opportunities likely to slip or lose based on engagement patterns, stakeholder dynamics, and historical similarities.
-
Coach Recommendations: Suggesting talk tracks, content, or actions based on successful similar deals.
-
Forecast Intelligence: Improving forecast accuracy by incorporating engagement signals beyond rep judgment.
-
Relationship Mapping: Automatically identifying stakeholders and their connections based on communication patterns.
Companies using revenue intelligence report 15-30% improvements in forecast accuracy and 10-20% increases in win rates from better coaching and prioritization.
Server-Side Data Infrastructure
Privacy changes – cookie deprecation, iOS tracking restrictions, GDPR enforcement – have disrupted traditional marketing measurement. Server-side tracking has emerged as the primary response.
Server-side tracking routes data through company servers before sending to advertising and analytics platforms. This approach survives browser restrictions, improves match rates with ad platforms, enables enhanced data governance, and provides more complete attribution data.
Operators implementing server-side tracking report 20-40% recovery of previously lost conversion data. For revenue engines dependent on attribution, this data recovery directly improves optimization capability.
Composable Technology Architectures
The all-in-one platform approach is giving way to composable architectures – best-of-breed components connected through integration layers and data warehouses.
The composable stack typically includes:
-
Customer Data Platform (CDP): Central repository for customer data from all sources.
-
Data Warehouse: Analytics layer enabling custom reporting across systems.
-
Integration Platform: Connecting applications and synchronizing data.
-
Best-of-Breed Applications: Specialized tools for specific functions – sales engagement, customer success, revenue intelligence.
This architecture trades simplicity for flexibility. Operations gain ability to swap components without full stack replacement. Vendors compete on specific capabilities rather than platform lock-in.
Generative AI Applications
Generative AI is transforming revenue operations across several applications:
-
Content Generation: Creating personalized outreach, proposal content, and follow-up communications at scale.
-
Conversation Intelligence: Summarizing calls, extracting action items, and generating coaching insights.
-
Data Enrichment: Completing customer profiles through research automation.
-
Predictive Analytics: Improving lead scoring, churn prediction, and forecasting through deeper pattern recognition.
-
Process Automation: Handling routine tasks – scheduling, data entry, status updates – freeing sellers for relationship building.
The productivity gains are substantial. Sales reps using AI assistance report 20-40% time savings on administrative tasks, translating to more selling time.
Common Mistakes in Revenue Engine Transformation
The transition from funnel to revenue engine fails in predictable ways.
Mistake 1: Technology Before Process
Buying new tools before fixing broken processes automates dysfunction. The revenue engine depends on clean handoffs, consistent data, and aligned incentives. Technology can’t fix misalignment.
The Fix: Map and redesign processes before selecting technology. Technology should enable designed processes, not compensate for broken ones.
Mistake 2: Metrics Without Definitions
Shared dashboards with different definitions create worse confusion than siloed reporting. If marketing and sales disagree on what constitutes an MQL, shared metrics mean nothing.
The Fix: Establish definitions first. Document in a shared glossary. Enforce through system configuration.
Mistake 3: Ignoring Cultural Change
The revenue engine requires collaboration across traditionally siloed teams. Marketing and sales have decades of tension. Customer success feels separate from “revenue” teams. RevOps struggles for authority.
The Fix: Executive sponsorship, shared incentives, and deliberate culture building. The organizational change is harder than the technical change.
Mistake 4: Neglecting Customer Success
The flywheel depends on customer delight driving advocacy. Operations that optimize acquisition while underinvesting in customer success break the feedback loop.
The Fix: Measure and resource customer success proportionally. Track advocacy metrics alongside acquisition metrics.
Mistake 5: Over-Engineering Early
Attempting to implement predictive analytics, AI-driven orchestration, and advanced automation before basic processes work wastes resources and creates complexity.
The Fix: Follow the phased approach. Foundation before optimization. Crawl, walk, run.
Frequently Asked Questions
1. What exactly is a revenue engine and how does it differ from a sales funnel?
A revenue engine is a circular, synchronized system where marketing, sales, and customer success operate as integrated components rather than sequential handoffs. Unlike the linear funnel where prospects flow from awareness to purchase, the revenue engine recognizes that customer advocacy feeds lead generation, data flows bidirectionally, and revenue optimization happens continuously. The funnel assumes gravity pulling prospects down; the revenue engine builds momentum where each customer success accelerates future growth.
2. What is Revenue Operations (RevOps) and why has it become essential?
RevOps integrates marketing, sales, and customer success under unified strategy, shared metrics, and common technology. It emerged because the traditional siloed structure created friction – leads waited at handoffs, data stayed trapped in departmental systems, and no one owned the complete customer journey. Research suggests companies with RevOps alignment achieve 10-20% higher revenue growth and 15% higher profitability. RevOps has become essential because the complexity of modern buying behavior requires coordinated response.
3. How does the flywheel model create compounding growth?
The flywheel stores and releases energy continuously. Each delighted customer creates referrals, reviews, case studies, and word-of-mouth that attract new prospects. These prospects engage, convert, and – if also delighted – perpetuate the cycle. Unlike the funnel where acquisition is the only growth lever, the flywheel accelerates as customer base grows. Companies with strong flywheels achieve lower customer acquisition costs over time because customer advocacy supplements paid acquisition.
4. What metrics should we track in a revenue engine versus traditional funnel metrics?
Traditional funnel metrics – MQLs, SQLs, opportunities, conversion rates – still matter but don’t capture the full picture. Revenue engine operations add velocity metrics (lead-to-revenue time, stage velocity, speed-to-lead), flywheel metrics (net revenue retention, customer advocacy rate, referral revenue contribution), and full-lifecycle attribution. The most important shift: measuring customer success as revenue generation through expansion revenue, referrals, and advocacy impact.
5. How do we handle lead scoring differently in a revenue engine?
Revenue engine lead scoring uses machine learning trained on actual conversion data rather than assumed point values. The system identifies patterns – including non-obvious combinations and temporal sequences – that predict conversion for your specific business. Scoring incorporates behavioral signals, firmographic fit, intent data, engagement velocity, and negative indicators. Effective scoring enables sales to focus on the 20% of leads generating 80% of revenue.
6. What role does customer success play in generating revenue, not just retaining it?
Customer success drives expansion revenue through upsells, cross-sells, and land-and-expand motions. For mature companies, expansion revenue often exceeds new acquisition revenue. Additionally, customer success cultivates advocacy – referrals, reviews, case studies, and community participation – that feeds lead generation. Net revenue retention above 100% means existing customers generate net growth. Customer success is the flywheel’s primary momentum generator.
7. How long does it take to transition from funnel thinking to a revenue engine?
Expect 18-36 months for full maturity. Phase 1 (months 1-6) establishes foundations: unified definitions, data architecture, and attribution. Phase 2 (months 6-12) integrates reporting, lifecycle marketing, and processes. Phase 3 (months 12-24) optimizes with predictive analytics and intelligent automation. Phase 4 (months 24+) adds AI-driven insights and predictive forecasting. The organizational change often takes longer than the technical implementation.
8. What technology stack supports modern revenue engines?
Core components include CRM as the customer data hub, marketing automation for campaign orchestration, sales engagement for systematic outreach, customer success platforms for health and expansion management, and revenue intelligence for AI-driven insights. Data infrastructure – CDPs, data warehouses, integration platforms – connects these systems. The trend is toward composable architectures with best-of-breed components connected through integration layers, providing flexibility without platform lock-in.
9. How does account-based experience (ABX) fit into the revenue engine framework?
For enterprise-focused operations, the revenue engine operates at the account level rather than the lead level. ABX integrates marketing, sales, and customer success into coordinated account orchestration. Key capabilities include account intelligence aggregating signals across all stakeholders, buying group detection connecting related leads, orchestrated engagement across functions, and account health scoring. ABX recognizes that B2B decisions involve 6-10 stakeholders requiring coordinated, not siloed, engagement.
10. What are the biggest mistakes companies make when implementing revenue engines?
The five most common mistakes are: (1) buying technology before fixing processes, which automates dysfunction; (2) creating shared dashboards without shared definitions, creating confusion; (3) ignoring cultural change required for cross-functional collaboration; (4) neglecting customer success while over-investing in acquisition, breaking the flywheel loop; and (5) over-engineering early before basic processes work. Success requires the discipline to build foundations before optimization.
Key Takeaways
-
The traditional sales funnel is fundamentally broken for modern buying behavior, where B2B purchases involve 6-10 stakeholders completing 70% of research before contacting sales across 27+ touchpoints.
-
The revenue engine replaces linear handoffs with circular, synchronized operations where customer advocacy feeds lead generation and revenue optimization happens continuously.
-
The flywheel model creates compounding growth: delighted customers generate referrals, reviews, and word-of-mouth that attract new prospects, reducing acquisition costs over time.
-
Revenue Operations (RevOps) integrates marketing, sales, and customer success under unified strategy, shared metrics, and common technology – companies with RevOps alignment achieve 10-20% higher revenue growth.
-
Modern lead management uses lifecycle stages rather than funnel stages, with predictive scoring trained on conversion data enabling focus on the 20% of leads generating 80% of revenue.
-
Customer success is revenue generation, not just retention – expansion revenue often exceeds new acquisition for mature companies, and advocacy is the flywheel’s primary momentum generator.
-
Velocity metrics matter as much as conversion metrics: lead-to-revenue time, stage velocity, and speed-to-lead directly impact revenue capacity.
-
Account-based experience (ABX) orchestrates engagement across entire buying committees, recognizing that 78% of single-threaded deals stall.
-
Technology supports but doesn’t create revenue engines – process redesign and cultural change are prerequisites for successful implementation.
-
The transformation takes 18-36 months for full maturity; attempting to skip phases by over-engineering early wastes resources and creates complexity.
Statistics and frameworks current as of December 2025. Revenue operations practices continue to evolve as technology and buyer behavior change.