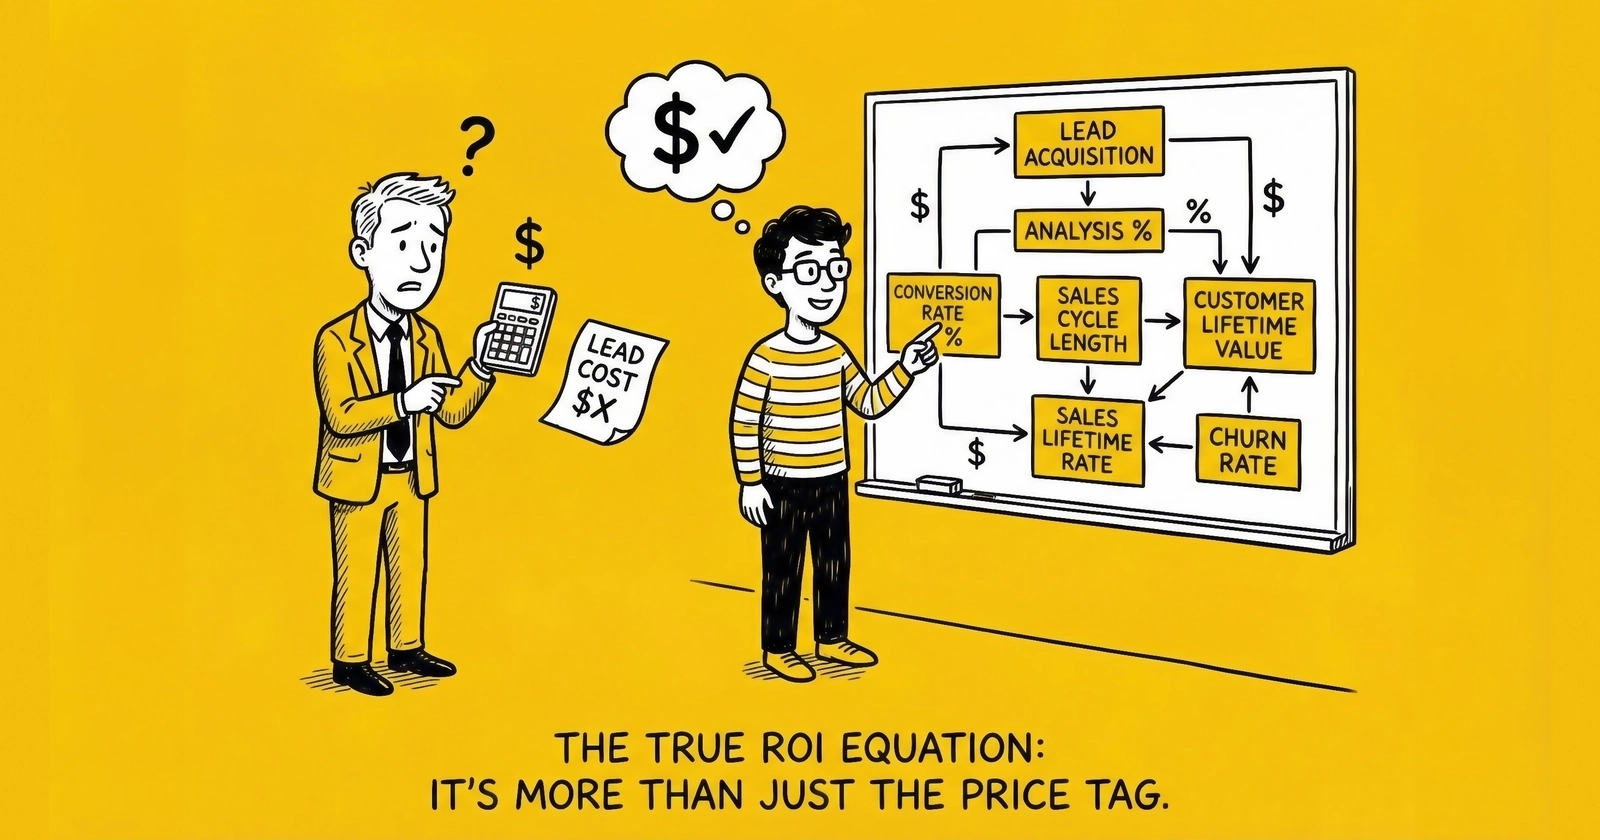
Your dashboard says you’re profitable. Your bank account disagrees. The gap between reported ROI and actual profitability is where lead generation businesses go to die. This guide shows you how to measure what actually matters.
The Measurement Problem That Bankrupts Operators
The spreadsheet looks beautiful. Last month’s campaign report shows a 3.5:1 return on ad spend. Your cost per lead came in at $72 against a $95 average sale price. The numbers suggest $23 profit per lead times 2,000 leads equals $46,000 monthly profit.
But when you reconcile with your accountant, the picture changes. Cash flow is tighter than projections. Your buyer keeps returning leads. Your veteran reps complain that “quality isn’t what it used to be.” The metrics say one thing; the bank account says another.
Welcome to the measurement challenge that breaks more lead generation businesses than any competitive threat. According to Forrester research, companies using advanced ROI measurement and attribution achieve 15-30% improvement in marketing efficiency. Not because they spend less, but because they finally understand what actually works versus what merely appears to work in dashboards.
The gap between reported ROI and actual profitability grows wider as operations scale. A 10,000 lead-per-month operation can absorb some measurement error. At 100,000 leads monthly, that same percentage error represents hundreds of thousands of dollars in misallocated capital. Those who master true measurement build sustainable businesses. Those who trust surface metrics optimize their way into bankruptcy.
This article confronts the measurement problem directly. You will learn to calculate true ROI by including every cost most practitioners forget. You will understand why attribution complexity matters and how to navigate it. You will see worked examples with real numbers that survive contact with your actual P&L. And you will walk away with the frameworks and benchmarks that separate profitable operations from revenue-generating money-losers.
The math is not complicated. The discipline to apply it consistently is what separates operators who build wealth from those who burn through capital wondering what went wrong.
What Surface Metrics Actually Measure (And What They Miss)
The Standard ROI Calculation Everyone Uses
Most lead generation businesses calculate ROI the same way: divide revenue by marketing spend, subtract one, express as a percentage. A $100,000 campaign that generates $400,000 in lead sales shows 300% ROI.
Standard ROI Formula:
ROI = (Revenue - Marketing Spend) / Marketing Spend x 100If you spend $50,000 on marketing and generate $200,000 in lead sales, your ROI is 300%. Simple. Clean. Dangerously incomplete.
That calculation captures maybe half the costs involved in generating those leads. The rest disappear into general operating expenses, never attributed to the campaigns that consumed them.
The 15 Cost Categories Most Operators Ignore
Your dashboard CPL excludes at least fifteen cost categories that fall into five major buckets.
Traffic Acquisition Costs Beyond Media
The media spend your dashboard tracks represents only a fraction of what you pay to acquire traffic. Creative production consumes real dollars as designers, copywriters, and video producers build the assets that drive conversions. Agency fees add 10-20% of media spend for campaign management. Testing spend on failed campaigns before finding winners represents investment, not waste, but it never appears on winning campaign reports. Platform access fees including setup costs, minimums, and technology premiums further inflate true acquisition costs. And affiliate payouts often include components beyond basic media commissions that get buried in reconciliation.
Technology and Infrastructure Costs
Every lead you generate touches multiple platforms before reaching a buyer. Lead distribution platform fees from providers like boberdoo, LeadsPedia, or Phonexa include both base subscriptions and per-lead charges. CRM subscriptions with per-user costs scale with your team. Dialers and call tracking systems enable contact but add recurring expense. Integration middleware and APIs connect your systems at a price. Analytics and reporting platforms complete the stack, each extracting its share of margin.
Compliance and Documentation Costs
Regulatory requirements have made compliance a meaningful cost center. TrustedForm certificates run $0.15-$0.50 per lead depending on your agreement. Jornaya TCPA Guardian fees add another layer. Phone, email, and address validation services cost $0.05-$0.25 per lead combined. Legal review and compliance counsel represent ongoing expense whether retained or hourly. And prudent practitioners set aside 1-3% of revenue as TCPA litigation reserves against potential exposure.
Operational Labor Costs
Someone has to run your operation. Campaign management and optimization require skilled attention. Lead processing and quality review consume hours daily. Buyer relationship management, from integration support to return dispute resolution, demands dedicated focus. Compliance monitoring and documentation round out a labor overhead that rarely gets attributed to specific leads.
Financial Costs
Money moves slowly through lead generation operations, and each delay carries cost. Return and refund processing requires investigation, credit issuance, and relationship management. Bad debt from non-paying buyers erodes revenue you already counted. Float cost, the working capital carrying cost between paying for leads and collecting from buyers, compounds monthly. Payment processing fees at 2.8% plus $0.30 per transaction typical represent yet another extraction point.
Every one of these categories takes money between “lead generated” and “revenue collected.” Every one gets ignored in dashboard CPL.
How Much Higher Is True Cost Than Dashboard Cost?
True CPL runs 30-60% higher than dashboard CPL for most lead generation operations. A campaign showing $75 dashboard CPL typically carries $98-120 true CPL when all costs are allocated.
The gap widens at smaller scale. Fixed costs (platforms, labor, compliance) spread across fewer leads. A 10,000 lead-per-month operation has proportionally higher per-lead overhead than a 100,000 lead-per-month operation running identical campaigns.
Consider the practical implications:
| Scale | Dashboard CPL | Typical True CPL | Gap |
|---|---|---|---|
| 5,000 leads/month | $75 | $115-130 | 53-73% |
| 25,000 leads/month | $75 | $95-110 | 27-47% |
| 100,000 leads/month | $75 | $88-100 | 17-33% |
Those who fail to account for this gap make systematically wrong decisions about which campaigns to scale and which to cut.
The Complete True ROI Formula
Revenue: What You Actually Collect
Start with what you actually receive, not what you invoice:
True Net Revenue = Gross Lead Sales - Returns - Refunds - Bad Debt - Chargebacks
Gross lead sales is your starting point, but it is not your ending point. Every downstream reduction must be accounted for before you can calculate true profitability.
Returns and refunds vary dramatically by vertical:
| Vertical | Typical Return Rate | High-Quality Sources | Poor Sources |
|---|---|---|---|
| Auto Insurance | 8-15% | 5-8% | 20-30% |
| Mortgage | 10-18% | 6-10% | 25-35% |
| Solar | 15-25% | 10-15% | 30-40% |
| Legal | 20-35% | 15-20% | 40-50% |
| Home Services | 12-20% | 8-12% | 25-35% |
A solar campaign generating $200,000 in gross lead sales with an 18% historical return rate actually generates $164,000 in net revenue. Using gross revenue inflates ROI by 22%.
Bad debt from buyers who do not pay runs 1-3% for well-managed operations with proper credit controls. Without credit controls, this figure can spike to 5-10% during market downturns when marginal buyers fail.
Costs: The Complete Picture
True Total Cost = Media Spend + Creative Production + Agency Fees + Testing Costs + Platform Fees + Per-Lead Technology Fees + Allocated Labor + Compliance Costs + Return Processing Labor + Float Cost
Let me break down realistic ranges for each component:
Media Spend: Your dashboard CPL baseline. This is the one cost everyone tracks accurately.
Creative Production: $0.50-3.00 per lead when amortized. That $8,000 landing page video divided across 3,000 monthly leads over 12 months costs $0.22 per lead. Add display ad design, copywriting, and testing variants, and creative overhead accumulates quickly.
Agency Fees: 10-20% of media spend for external management. If you spend $100,000 monthly with a 15% agency fee, that is $15,000 in costs that never appear on ad platform dashboards.
Testing Costs: 15-25% of media spend goes to campaigns that fail before you find winners. That learning investment is real cost, not disappeared expense. Allocate testing spend to the winners it enabled.
Platform Fees: Distribution platforms charge $0.10-$0.50 per lead processed plus base subscriptions of $450-5,000 monthly depending on features and scale. At 10,000 leads monthly, expect $0.20-0.50 per lead in distribution platform costs alone.
Per-Lead Technology Fees: Validation, consent documentation, and integration services accumulate quickly. TrustedForm certificates run $0.15-0.50 per lead. Phone validation costs $0.01-0.05. Email validation adds $0.005-0.02. Address standardization contributes $0.01-0.03. IP and device intelligence services add $0.02-0.10. A comprehensive stack runs $0.30-0.75 per lead before you account for CRM, dialer, and analytics allocations.
Allocated Labor: This is where operators most consistently undercount. Someone runs those campaigns. Someone monitors performance. Someone handles buyer relationships and troubleshoots integrations.
A fully loaded campaign manager (salary + benefits + overhead) costs $60,000-120,000 annually. If that manager handles 20,000 leads monthly, labor allocation is $0.25-0.50 per lead just for campaign management. Add operations coordinators, compliance analysts, and sales support, and labor often represents 15-25% of total operating costs.
Compliance Costs: Beyond per-lead fees, compliance requires ongoing investment. Legal review and TCPA counsel runs $3,000-10,000 annually. TCPA insurance costs $5,000-25,000 annually depending on scale and risk profile. Compliance staff, even if shared across functions, requires proportional salary allocation. And prudent practitioners set aside 1-3% of revenue as litigation reserves for potential exposure.
Return Processing: Each returned lead requires investigation, documentation, credit issuance, and buyer relationship management. At 15 minutes per return with $25 fully-loaded labor cost, processing 500 monthly returns costs $3,125 in labor alone.
Float Cost: You pay for leads when you acquire them. You get paid when buyers pay invoices, typically 30-45 days later. That gap requires capital. Capital has cost.
Monthly Float Cost = Average Receivables Outstanding x (Annual Cost of Capital / 12)
At $500,000 monthly media spend with 30-day float and 12% cost of capital, monthly float cost is $5,000. This represents $0.50-1.00 per lead that never appears in any marketing dashboard. Understanding this concept is essential for any lead generation operator, as detailed in the 60-day float rule.
The True ROI Calculation
Bringing it together:
True ROI = (True Net Revenue - True Total Cost) / True Total Cost x 100
An operation reporting 250% ROI using the simple calculation typically shows 80-120% ROI when all costs are properly attributed. Still profitable, but requiring very different strategic decisions about scaling, pricing, and margin management.
Worked Example: From Dashboard Profit to Actual Loss
Scenario Parameters
Consider a realistic auto insurance lead operation spending $75,000 monthly on media at an average CPC of $4.66. The landing page converts at 5%, generating 806 leads per month at a dashboard CPL of $93.05. Each lead sells for $100, and historical data shows a 12% return rate.
The dashboard view looks healthy: $75,000 spend generates 806 leads at $93.05 CPL, selling at $100 each for $5,606 gross profit. But the complete picture tells a different story.
Step 1: Calculate True Net Revenue
Gross Lead Sales: 806 leads x $100 = $80,600
Returns (12%): 97 leads returned = $9,700 refunded
Bad Debt (2%): $1,612 uncollectible
True Net Revenue: $80,600 - $9,700 - $1,612 = $69,288
Already, we have lost $11,312 that the dashboard did not account for.
Step 2: Calculate All True Costs
Media Spend: $75,000
Creative Production (amortized monthly):
- Landing page video: $8,000 / 12 months = $667
- Display ad design: $2,400 / 12 months = $200
- Copywriting and variants: $1,200 / 12 months = $100
- Total: $967
Agency Fees (15% of media): $11,250
Testing Spend (20% of media for failed campaigns): $15,000
Platform and Technology:
- Distribution platform: $1,200 base + $0.15/lead = $1,321
- CRM (5 users at $100): $500
- Dialer allocation: $750
- Call tracking: $300
- Total: $2,871
Compliance Costs:
- TrustedForm ($0.25 x 806): $202
- Validation stack ($0.10 x 806): $81
- Legal counsel (amortized): $500
- TCPA insurance (amortized): $833
- Total: $1,616
Labor Allocation:
- Campaign manager (50% allocation): $4,000
- Operations coordinator: $3,500
- Buyer relations (25% allocation): $1,500
- Total: $9,000
Return Processing:
- 97 returns x 15 minutes x $25/hour labor: $606
Float Cost:
- Capital deployed: $75,000
- Float period: 35 days
- Annual rate: 12%
- Monthly cost: $875
Step 3: Sum All Costs
| Cost Category | Monthly Amount |
|---|---|
| Media Spend | $75,000 |
| Creative Production | $967 |
| Agency Fees | $11,250 |
| Testing Spend | $15,000 |
| Platform/Technology | $2,871 |
| Compliance Costs | $1,616 |
| Labor Allocation | $9,000 |
| Return Processing | $606 |
| Float Cost | $875 |
| Total True Costs | $117,185 |
Step 4: Calculate True ROI
True ROI = ($69,288 - $117,185) / $117,185 x 100 = -40.9%
Dashboard said: $5,606 profit (7% ROI)
Reality: -$47,897 loss (-41% ROI)
This campaign loses money on every lead despite the dashboard showing profitability. Understanding true cost per lead calculation prevents this common mistake.
Step 5: Identify Intervention Points
This example is not unusual. It is representative of what happens when operators trust dashboard metrics. Here is how to fix it.
Improve Conversion Rate from 5% to 7%
Landing page optimization that lifts conversion rate from 5% to 7% drops CPL from $93.05 to $66.57. The same spend now generates 1,128 leads instead of 806, a revenue increase of $32,200 monthly.
Reduce Returns from 12% to 8%
Improved lead quality and buyer alignment that reduces returns from 12% to 8% means returns drop to 90 leads instead of 97. Combining refund savings with reduced processing labor saves $4,070 monthly.
Negotiate Sale Price from $100 to $115
A 15% price increase to $115 per lead generates an additional $17,940 monthly. This requires either improved quality justifying higher prices or better buyer identification.
Bring Agency Management In-House
Eliminating the 15% agency fee by bringing campaign management in-house saves $11,250 monthly. This requires hiring capable staff but often makes sense at scale.
Combined, these four changes transform a -$47,897 loss into approximately $17,500 profit. The difference between bankruptcy and sustainability lies in understanding true costs well enough to identify intervention points.
Attribution: Which Marketing Actually Deserves Credit
Why Attribution Complexity Matters
Even with complete cost accounting, you face the fundamental attribution question: which marketing activities deserve credit for conversions?
Consider a typical customer journey: A consumer sees your Facebook ad three times, clicks it, does not convert. Three days later they search for your brand, click a Google ad, land on your site, and submit a lead. Which channel gets credit? First-touch attribution credits Facebook. Last-touch credits Google. Neither is fully accurate because both touches contributed.
Misattribution leads to misallocation. You shift budget from Facebook to Google, starving the awareness channel that created the demand your brand search captured. Within 60 days, brand search volume drops because you cut the source feeding it.
According to a 2025 industry analysis, over half of brands and agencies now use multi-touch attribution despite its complexity. Our multi-touch attribution guide covers implementation approaches. Companies implementing advanced attribution achieve 15-30% improvement in marketing efficiency by allocating spend to what actually works rather than what merely claims credit.
Attribution Models Explained
First-Touch Attribution
First-touch gives 100% credit to the initial marketing interaction that introduced the consumer to your brand. The logic is straightforward: without that first touch, nothing else would have happened. The consumer needed to discover you before they could be retargeted, nurtured, or converted.
This model works well when you are measuring brand awareness and demand generation, when sales cycles are short at under 7 days, and when your business is new and growth depends on expanding reach. First-touch struggles when customer journeys span weeks or months, when retargeting and nurture play significant conversion roles, and when you are optimizing for efficiency rather than just reach.
In practice, first-touch attribution typically overvalues awareness channels like social, display, and content marketing while undervaluing conversion channels like search and retargeting.
Last-Touch Attribution
Last-touch assigns 100% credit to the final interaction before conversion. The logic follows that whatever happened last was the decisive factor. The consumer had many opportunities to convert earlier but did not. The final touch closed the deal.
This model works well when decision processes are impulse-driven, when you are optimizing for immediate conversions, and when budget constraints require prioritizing proven closers. The danger is that last-touch often credits channels that merely capture existing demand rather than create it. Brand search campaigns that harvest consumers you would have reached anyway look spectacular while actually adding minimal incremental value.
Multi-Touch Attribution Models
Multi-touch distributes credit across all touchpoints in the customer journey, acknowledging that conversions rarely result from a single interaction.
Linear attribution splits credit equally across all touches, so five touchpoints means each gets 20%. The approach is simple to understand but treats a fleeting impression the same as an engaged click. Time-decay attribution weights recent touchpoints more heavily, with the conversion-proximate touch getting perhaps 40% credit and diminishing weights backward through the journey. Position-based attribution, also called U-shaped, emphasizes first and last touches at typically 40% each with the remaining 20% spread across middle interactions. This honors both introduction and closing while acknowledging the nurture path. W-shaped attribution adds weight to the lead creation moment, distributing perhaps 30% to first touch, 30% to lead creation, 30% to conversion, and 10% across other touchpoints.
Data-Driven/Algorithmic Attribution
Algorithmic attribution uses machine learning to assign credit based on actual conversion patterns in your data. Rather than applying predetermined rules, it analyzes which touchpoint sequences actually correlate with conversions versus which correlate with non-conversion.
Effective algorithmic attribution requires sufficient conversion volume at typically 600+ monthly conversions, consistent tracking infrastructure across all touchpoints, historical data spanning multiple months, and technical resources for implementation and interpretation. When it works, algorithmic attribution reveals counterintuitive patterns. That creative that looked weak in last-touch might be an essential assist player.
The Challenge of Privacy-Era Attribution
Attribution complexity has increased dramatically since 2023. Safari’s Intelligent Tracking Prevention, Chrome’s evolving cookie policies, and consumer opt-outs create data gaps. Server-side tracking can recover 20-40% of signals lost to client-side blocking, but complete visibility no longer exists.
Cross-device journeys fragment attribution. A consumer researches on mobile during commute, considers on work laptop, and converts on home desktop. Without robust identity resolution, you see three different people rather than one journey.
Walled gardens compound the problem. Facebook knows what happened on Facebook. Google knows what happened on Google. Neither tells the other, and neither tells you the complete picture.
The practical response: accept that precision has limits. Build the best measurement infrastructure you can. Use incrementality testing to validate attribution assumptions. Make decisions based on directional accuracy rather than false precision.
Incrementality Testing: The Gold Standard
The limitations of all attribution models drive growing interest in incrementality testing, the practice of measuring what actually changes when you turn marketing on or off.
The concept is simple: create comparable test and control groups, expose only the test group to marketing, and measure the difference in outcomes. The gap represents true incremental lift.
Several methods enable incrementality testing. Geo experiments compare regions where you advertise versus similar regions where you do not. If sales increase 15% in test markets but only 2% in control markets, you have 13% incremental lift. Holdout tests randomly exclude a portion of your audience from campaigns and compare their conversion rates to exposed audiences. Platform lift studies from Meta and Google handle randomization and measurement within their ecosystems, reporting incremental conversions attributable to platform campaigns.
A 2025 industry report showed that 52% of brands and agencies now use incrementality testing, up significantly from prior years. Companies implementing proper incrementality measurement have achieved 10-20% improvements in marketing efficiency by reallocating spend from campaigns that look good to campaigns that actually work.
The uncomfortable truth: That retargeting campaign showing 800% ROAS in platform reporting might show 20% incremental lift when properly tested, because most of those conversions would have happened anyway.
Lead-Level P&L: Where Margin Actually Lives
Why Aggregate Metrics Hide Reality
True ROI measurement at the campaign level tells part of the story. But campaigns contain multitudes. Some lead sources within a profitable campaign destroy value while others generate extraordinary returns.
Aggregate metrics can mask dramatic internal variation. A campaign showing 50% overall margin might contain sources running 80% margin and sources running -20% margin. Without lead-level visibility, you scale both equally, diluting returns with every growth investment.
Lead-level P&L analysis breaks performance down to individual records, revealing which specific sources, audiences, creatives, and placements actually make money.
Building Lead-Level Visibility
For each lead, you need to capture revenue attribution, direct cost attribution, and indirect cost allocation.
Revenue Attribution
Track the complete revenue picture for every lead. Gross sale price reflects what the buyer paid. Net revenue adjusts for any refunds or adjustments after delivery. Extended revenue captures additional value when leads are sold to multiple buyers.
Direct Cost Attribution
Direct costs tie directly to individual leads. Media cost represents what you paid for the click that generated this specific lead. Per-lead validation fees from phone, email, and address verification services attach to each record. Consent certification costs from TrustedForm or similar providers are inherently per-lead. Commission paid to affiliates, if applicable, completes the direct cost picture.
Indirect Cost Allocation
Indirect costs require allocation methodologies. Platform fees spread across leads processed based on volume. Labor allocates by time spent on specific sources or campaigns. Compliance overhead distributes by volume proportionally. Creative costs amortize across impressions served.
Document your allocation methodology. Apply it consistently. Update it when operating patterns change.
Source-Level Profitability Analysis
Aggregating lead-level data to the source level reveals your most and least valuable traffic origins.
A typical analysis might reveal:
| Source | Volume | Gross Margin | Net Margin | Return Rate | True ROI |
|---|---|---|---|---|---|
| Facebook LAL | 5,200 | $78,000 | $41,600 | 8% | 112% |
| Google Brand | 2,100 | $42,000 | $29,400 | 3% | 186% |
| Google Non-Brand | 8,400 | $126,000 | $50,400 | 14% | 67% |
| Affiliate A | 3,800 | $38,000 | $15,200 | 22% | 28% |
| Affiliate B | 1,200 | $24,000 | $16,800 | 5% | 234% |
In this example, Affiliate A delivers the worst margins despite acceptable volume. The 22% return rate destroys profitability. Meanwhile, Affiliate B’s smaller volume delivers exceptional returns, a relationship worth expanding.
Strategic decisions flow from this analysis. You would renegotiate or terminate Affiliate A, potentially imposing quality requirements as a condition of continuation. You would invest in growing Affiliate B’s volume given its exceptional returns. Testing Facebook audience expansion makes sense given solid performance. Google non-brand operates as a volume play rather than a margin play, acceptable for scale if not for efficiency. And brand search deserves protection and monitoring for its conversion efficiency role.
Without lead-level P&L, you would see only aggregate campaign performance, potentially scaling unprofitable sources within profitable campaigns.
ROI Benchmarks by Vertical: What Good Actually Looks Like
Insurance Leads
| Metric | Range | Target |
|---|---|---|
| Dashboard CPL (Google) | $45-100 | $60-75 |
| True CPL (all-in) | $70-150 | $90-110 |
| Return Rate | 8-15% | <10% |
| Contact Rate | 45-55% | >50% |
| Conversion (to policy) | 8-12% | >10% |
| True ROI | 60-120% | >80% |
Auto insurance remains relatively consistent seasonally. Medicare spikes dramatically during AEP (October 15 through December 7) with CPLs doubling or tripling. Health insurance follows open enrollment patterns. Life insurance shows less seasonality but longer sales cycles.
Customer lifetime value in insurance ranges from $800-1,200 for Medicare supplement policies to $1,500-3,000 for auto insurance to $3,000+ for bundled home/auto customers. These LTV figures determine what buyers can sustainably pay for leads.
Mortgage Leads
| Metric | Range | Target |
|---|---|---|
| Dashboard CPL | $50-150 | $75-100 |
| True CPL | $80-200 | $100-140 |
| Return Rate | 10-18% | <12% |
| Contact Rate | 30-40% | >35% |
| Conversion (to funded loan) | 1-2% | >1.5% |
| True ROI | 40-100% | >60% |
Rate sensitivity dominates mortgage economics. When rates rise, volume drops 40-60%. Practitioners who fail to adjust spend during rate cycles either overpay during contractions or miss volume during expansions.
Customer LTV in mortgage ranges from $3,000-8,000 depending on loan size, product type, and refinance probability. Purchase money loans often carry higher LTV than refinances due to repeat business potential.
Solar Leads
| Metric | Range | Target |
|---|---|---|
| Dashboard CPL | $75-200 | $100-150 |
| True CPL | $110-280 | $140-200 |
| Return Rate | 15-25% | <18% |
| Contact Rate | 20-35% | >28% |
| Conversion (to installation) | 4-8% | >6% |
| True ROI | 30-90% | >50% |
Geographic arbitrage defines solar economics. Customer acquisition cost in California averages $1,929 per closed sale. In North Dakota, the same metric runs approximately $225, an 8.5x spread. State-level policy incentives, household incomes, installer competition, and electricity costs all contribute.
Customer LTV in solar ranges from $5,000-15,000 depending on system size, financing structure, and referral value. Battery storage and ongoing maintenance can extend LTV further.
Legal Leads
| Metric | Range | Target |
|---|---|---|
| Dashboard CPL | $200-500 | $250-400 |
| True CPL | $280-700 | $350-500 |
| Return Rate | 20-35% | <25% |
| Contact Rate | 15-25% | >20% |
| Conversion (to signed retainer) | 2-4% | >3% |
| True ROI | 25-80% | >40% |
Case type variation drives dramatic CPL differences. Personal injury runs $200-400. Mass tort can exceed $1,000-2,000. Legal services sit at $50-150. Understanding the specific practice area economics is essential before entering legal lead generation.
Customer LTV depends entirely on case outcomes. Personal injury contingency fees on a $300,000 settlement generate $100,000+ in firm revenue. Mass tort fees compound across case portfolios.
Home Services Leads
| Metric | Range | Target |
|---|---|---|
| Dashboard CPL | $30-100 | $45-70 |
| True CPL | $50-140 | $65-95 |
| Return Rate | 12-20% | <15% |
| Contact Rate | 40-55% | >45% |
| Conversion (to completed job) | 10-20% | >15% |
| True ROI | 60-150% | >90% |
Seasonality varies by trade. HVAC peaks in summer and winter extremes. Roofing follows storm patterns and spring/fall seasons. Landscaping clusters in spring. Understanding seasonal patterns enables media spend timing that matches demand.
Customer LTV in home services ranges from $500 for routine repairs to $5,000+ for major installations. Repeat business potential varies dramatically by trade, with maintenance-intensive services (HVAC, pest control) offering higher recurring revenue than project-based work (roofing, remodeling).
Building Your Measurement Infrastructure
Required Data Sources
Measuring true ROI requires connecting data that typically lives in separate systems. Marketing platforms like Google Ads, Facebook Ads, and TikTok track traffic acquisition. Lead distribution platforms such as boberdoo, LeadsPedia, or Phonexa handle routing and disposition. CRM systems including Salesforce, HubSpot, or industry-specific solutions manage buyer relationships. Finance systems from QuickBooks to NetSuite track actual revenue and expenses. Compliance platforms including TrustedForm, Jornaya, and validation providers document consent and quality. Call tracking through Ringba or CallRail captures phone-based interactions for applicable operations.
The challenge is integration. Marketing tracks leads in one system. Sales tracks conversions in another. Finance tracks revenue in a third. Nobody has unified visibility connecting cost to lead to revenue to margin.
Solving this requires investment in data infrastructure through API connections, data warehouses, or middleware platforms that unify disparate sources. Those who win build single-lead-level visibility connecting every dollar spent to every dollar earned.
The Monthly True ROI Calculation Template
Establish a monthly calculation process:
REVENUE
  Gross Lead Sales                      $_______
  - Returns and Refunds                 $_______
  - Bad Debt / Uncollectable            $_______
  = TRUE NET REVENUE                    $_______

COSTS
  Media Spend                           $_______
  Creative Production (amortized)       $_______
  Agency Fees                           $_______
  Testing/Learning Spend                $_______
  Platform Fees (distribution)          $_______
  Technology Fees (CRM, dialer, etc.)   $_______
  Compliance Costs (TF, Jornaya, legal) $_______
  Labor Allocation                      $_______
  Return Processing Labor               $_______
  Float Cost                            $_______
  = TRUE TOTAL COSTS                    $_______

METRICS
  Net Leads Delivered                   _______
  True CPL = Total Costs / Net Leads    $_______
  True ROI = (Revenue - Costs) / Costs  _______%
Weekly Monitoring Metrics
You cannot recalculate true ROI daily because many costs are monthly. But you can track leading indicators weekly that signal emerging problems before they compound.
Return rate by source deserves constant attention, with any source exceeding 15% flagged for review. Validation failure rate indicates traffic quality degradation before returns materialize. Contact rate by source serves as a leading indicator of future returns since unreachable leads eventually come back. Speed-to-contact metrics including median and 90th percentile response times reveal operational execution. Buyer acceptance rate trends provide early warning of quality problems that will soon appear in return data.
Dashboard Design Principles
Different audiences need different views, and mixing metrics across contexts creates confusion rather than clarity.
Executive Dashboards
Executive dashboards should answer a single question: Is the business healthy? Surface true ROI trends on a monthly basis alongside revenue versus target comparisons. Include net margin by source to show where profit originates. A quality composite score weighting return rate, contact rate, and conversion rate provides a single health metric for quick assessment.
Operational Dashboards
Operational dashboards should enable daily decisions. Source-level performance showing volume, CPL, and return rate by traffic origin enables tactical adjustments. Real-time campaign pacing reveals whether spend is on track. Buyer acceptance rates signal quality issues requiring immediate attention. Anomaly alerts flag deviations from expected patterns before they compound.
Source-Level Views
Source-level views should reveal optimization opportunities. True CPL by source including returns shows actual acquisition economics. Conversion rate trends highlight improving or degrading performance. Quality metrics broken down by sub-source enable surgical interventions rather than wholesale changes.
Never mix metrics that require different contexts. A dashboard showing volume alongside margin percentage confuses priority. Include comparison periods, because today’s number means nothing without yesterday’s, last week’s, and last month’s context.
Frequently Asked Questions
Q1: What is a healthy ratio between dashboard CPL and true CPL?
Dashboard CPL should be 60-75% of true CPL in a well-optimized operation. If dashboard CPL is $60 and true CPL is $80-100, your hidden cost management is reasonable.
If dashboard CPL is less than 50% of true CPL, you have structural cost problems requiring immediate attention. Either hidden costs are too high or your operation lacks scale efficiency. Both situations demand investigation.
Q2: Which cost category offers the highest optimization opportunity?
Returns, for most practitioners. A 5-percentage-point improvement in return rate (from 15% to 10%) saves more per lead than eliminating most other cost categories entirely.
Returns compound because every returned lead carries its full acquisition cost with zero revenue. Cutting returns improves margin more than cutting any comparable line item.
The second-highest leverage point is conversion rate. A 2-percentage-point improvement in landing page conversion (5% to 7%) reduces CPL by approximately 28%. No other single change offers comparable economics impact.
Q3: How do I calculate ROI when leads are sold to multiple buyers?
For shared lead distribution, calculate ROI based on total revenue generated per lead:
Total Lead Revenue = (Buyer 1 Price + Buyer 2 Price + … + Buyer N Price) - Returns from all buyers
If you sell a lead to 4 buyers at $25 each for $100 total revenue, but 1 buyer returns it, your net revenue is $75.
Your true ROI calculation uses this aggregate revenue figure against all costs to generate that lead. The key is tracking all revenue streams and all return events against the original acquisition cost.
Q4: How does true ROI change at different scales?
Per-lead costs for platforms, compliance, and labor drop 40-60% between 10,000 and 100,000 monthly leads. Specific efficiency thresholds:
- Platform volume discounts: 10,000-25,000 leads
- In-house team efficiency: 15,000-30,000 leads
- Buyer negotiating power: 25,000+ leads
A 100,000 lead-per-month operation might pay $0.15 per lead in platform costs versus $0.43 for a 10,000 lead operation. That is $0.28 saved per lead, or $28,000 monthly margin improvement purely from scale.
Q5: Should I include opportunity cost in ROI calculations?
Yes, particularly for float cost. Capital tied up in working capital could earn returns elsewhere. If you are using $500,000 in working capital that could otherwise earn 8% in investments, that is $40,000 annual opportunity cost that should flow into your ROI calculation.
For most practitioners, using actual cost of capital (credit line rate, investor return expectations) provides a practical proxy without requiring complex opportunity cost analysis.
Q6: What return rate should trigger source termination?
Establish tiered thresholds based on your margin tolerance. A yellow alert at 10-15% returns should trigger increased monitoring and quality filter review. A red alert at 15-20% returns warrants volume reduction and direct communication with the source. Termination should follow when returns exceed 20% for two or more consecutive weeks, requiring immediate source pause.
Track returns on 7-day and 30-day rolling windows. A single bad day should not trigger termination, but sustained poor quality should. The cost of carrying a bad source for an extra week often exceeds the cost of being overly aggressive on cuts.
Q7: How do I factor compliance costs into ROI after recent regulatory changes?
Though the FCC’s one-to-one consent rule was vacated by the Eleventh Circuit in January 2025 and subsequently repealed, this does not eliminate compliance requirements. Regardless of current enforcement status, best practice includes TrustedForm or equivalent consent documentation at $0.15-0.50 per lead, validation services at $0.05-0.25 per lead, legal review budget at $0.05-0.10 per lead when amortized, and litigation reserves at 1-3% of revenue.
These costs should be included in all ROI calculations. TCPA settlements average $6.6 million. A $0.30 per lead compliance investment is cheap insurance against seven-figure liability.
Q8: What LTV:CAC ratio should lead buyers target?
Standard benchmarks vary by buyer type. Direct carriers and lenders typically target 3:1 LTV:CAC for sustainable acquisition. Agents and brokers operate at 2:1 to 3:1 with faster payback requirements given their capital constraints. Call centers and aggregators require 4:1 to 5:1 ratios to account for their operational overhead layers.
If your buyers’ LTV:CAC falls below 2:1, they will eventually reduce lead spend or exit. Understanding buyer economics helps you predict pricing pressure and identify buyers who can sustainably afford premium lead prices.
Q9: How often should I recalculate true ROI?
Complete calculation should happen monthly. Component monitoring should happen weekly. Strategic review should happen quarterly.
True ROI shifts gradually. Monthly recalculation catches trend shifts. Weekly component monitoring catches emerging problems before they compound. Quarterly reviews enable strategic adjustments based on sufficient data.
Those who review true ROI only annually are always surprised by how much margin evaporated. Those who track monthly catch problems while they are still fixable.
Q10: How do I model true ROI before launching a new vertical?
Build a pro forma true ROI model before investing. Start by researching vertical-specific media CPL benchmarks from Google Ads and Facebook industry data. Then research vertical return rates from industry data and buyer conversations. Apply your known cost structure including platforms, compliance, and labor. Model at conservative conversion rates below industry average to build in margin of safety. Finally, calculate true CPL and compare to achievable sale prices in that market.
If the model shows marginal or negative unit economics at conservative assumptions, do not launch. Wait until you can improve conversion rates, negotiate better sale prices, or identify efficiency opportunities that change the math.
Key Takeaways
-
Dashboard ROI understates true costs by 30-60%. Every dollar your ad platform reports excludes 15+ cost categories that erode margin before cash hits your bank account. An operation showing 250% dashboard ROI typically runs 80-120% true ROI.
-
The complete formula includes 10 cost categories. Media spend, creative production, agency fees, testing costs, platform fees, technology fees, labor allocation, compliance costs, return processing, and float cost. Miss any category and your ROI is fiction.
-
Returns are the silent margin killer. A 12% return rate on $100 leads adds $12-15 to true CPL. Track returns by source, pause underperformers within days, and treat return rate as seriously as conversion rate.
-
Conversion rate is the highest-leverage variable. A 2-percentage-point improvement in conversion can transform unprofitable campaigns into profitable ones. Every other optimization is secondary to landing page performance.
-
Attribution complexity demands sophisticated measurement. Multi-touch attribution and incrementality testing reveal which marketing actually works. Companies using advanced attribution achieve 15-30% efficiency improvements by allocating spend accurately.
-
Lead-level P&L reveals where margin actually lives. Aggregate metrics hide that certain sources, geographies, or buyer combinations generate profit while others destroy it. Source-level visibility is not optional for sustainable operations.
-
Float requires real capital. The 60-day working capital rule is not optional. Undercapitalized operators fail not from unprofitable campaigns but from timing gaps between paying suppliers and collecting from buyers.
-
Vertical benchmarks vary dramatically. Solar leads support $100-200 CPLs. Insurance runs $25-100. Legal can exceed $500. Know your vertical’s economics before entering or scaling.
-
The gap between reported ROI and bank balance is where businesses fail. Close that gap through comprehensive cost tracking, proper attribution, and lead-level analysis. Those who master measurement build sustainable businesses. Those who trust surface metrics discover reality too late.
Statistics and benchmarks based on 2024-2025 industry data from Forrester, WordStream, Google Ads benchmarks, and vertical-specific research. Platform pricing and regulatory information current as of late 2025. Validate benchmarks against your specific vertical, geography, and buyer relationships before making material investment decisions.