Apply Dave McClure’s AARRR framework to lead generation operations – from acquisition through referral, with metrics, bottleneck identification, and optimization strategies.
The lead generation industry burns through businesses at an alarming rate. Most operations that fail don’t collapse because of bad leads or inadequate volume – they fail because operators never build systematic visibility into where their funnel breaks down.
Dave McClure developed the AARRR framework in 2007 while running marketing at PayPal, long before “growth hacking” became a buzzword. The framework has since become the dominant analytical tool for SaaS companies tracking customer lifecycle economics. What McClure understood – and what most lead gen operators still miss – is that sustainable growth requires measuring the right things at the right stages, then directing limited resources toward the single biggest bottleneck.
For lead generation businesses, AARRR offers something traditional lead tracking doesn’t: a complete view of operational health across acquisition, activation, retention, revenue, and referral. The operators who master this framework don’t just generate leads. They build businesses that compound.
What Is the AARRR Framework and Why Does It Matter for Lead Gen?
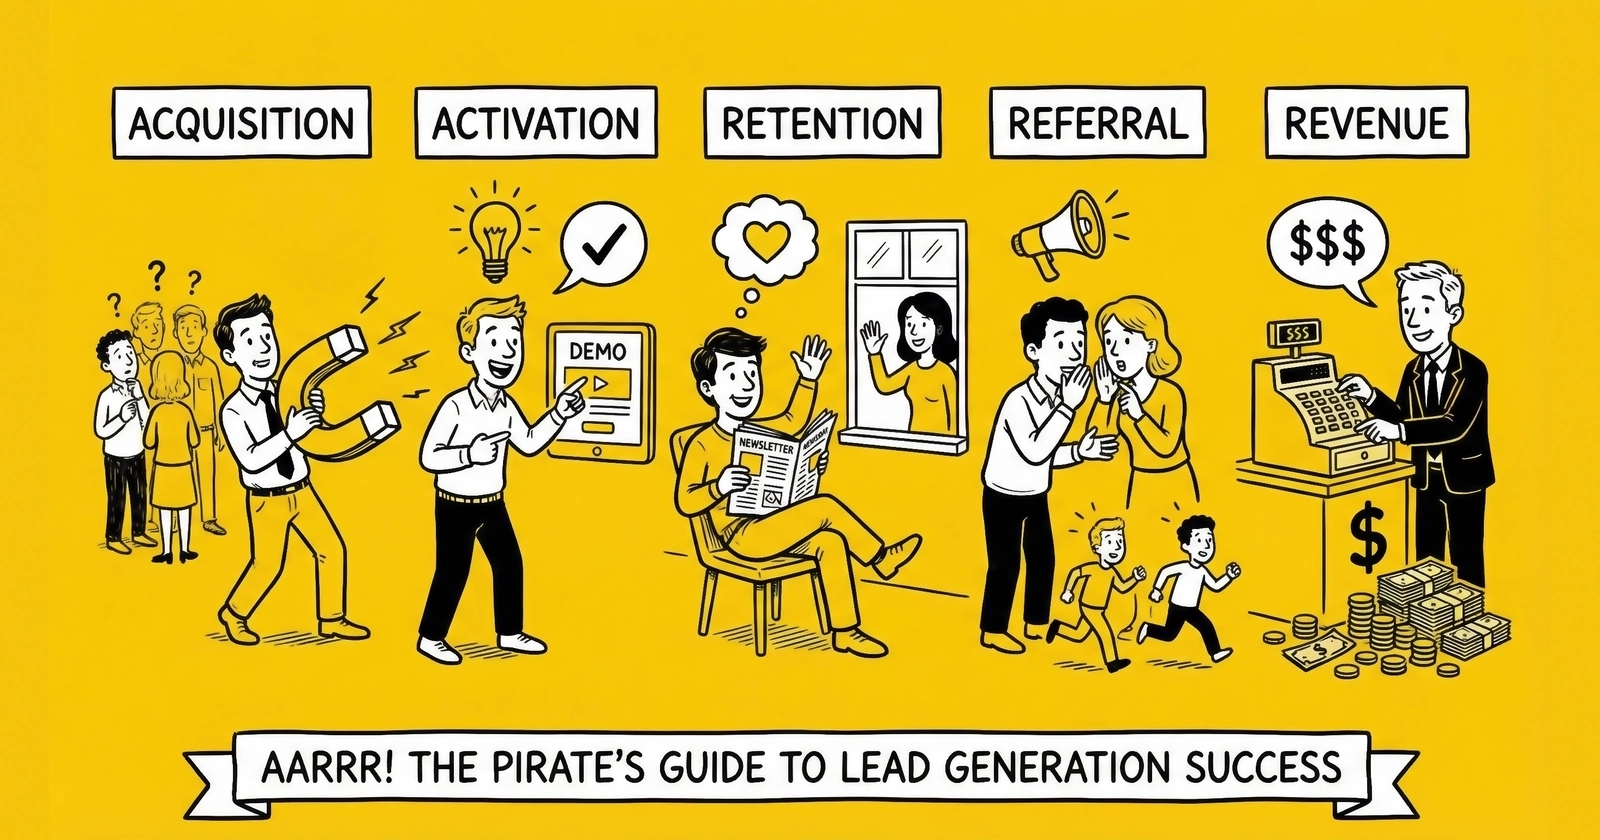
The AARRR framework – sometimes called “Pirate Metrics” because the acronym sounds like a pirate’s exclamation – divides any business’s customer lifecycle into five discrete stages:
- Acquisition: How do potential customers discover you?
- Activation: How do new customers experience their first moment of value?
- Retention: How do you keep customers coming back?
- Revenue: How do you monetize customer relationships?
- Referral: How do satisfied customers bring you new customers?
McClure designed this framework specifically for startups and SaaS businesses, where customer acquisition costs and lifetime value determine survival. The core insight was simple: most companies waste resources optimizing stages that aren’t actually constraining growth, while ignoring the single bottleneck that caps everything else.
For lead generation operators, the framework requires translation. Your “customers” are lead buyers – the insurance agents, mortgage brokers, solar installers, and home service companies who purchase leads from your operation. Your product is the lead itself. Your challenge is building buyer relationships that generate recurring revenue at margins that sustain growth.
The lead gen industry’s traditional metrics – cost per lead, lead volume, buyer count – tell you almost nothing about operational health. They’re what McClure called “vanity metrics.” They feel important but don’t indicate whether your business is actually improving or declining. Understanding the metrics that actually matter requires looking beyond surface-level numbers.
AARRR forces different questions:
- How many new buyer prospects enter your pipeline each month, and from which channels? (Acquisition)
- What percentage of new buyers complete their first successful campaign? (Activation)
- How many buyers from six months ago are still actively purchasing? (Retention)
- What’s your average margin per lead across different verticals and buyer segments? (Revenue)
- How many new buyers came from referrals by existing buyers? (Referral)
When you map these questions to your operation and measure the conversion percentages between stages, patterns emerge. Maybe you’re excellent at acquiring new buyer leads but terrible at activating them into paying customers. Maybe your activation is strong but retention craters after 90 days. Maybe you retain buyers well but they never refer other buyers to you.
Each pattern points to a specific operational problem with specific solutions. The framework eliminates guesswork about where to focus.
The AARRR Funnel Applied to Lead Generation Operations
Stage 1: Acquisition – Where Do Your Buyers Come From?
In traditional AARRR applications, acquisition tracks how users discover a product. For lead gen operations, acquisition has two layers: how you acquire leads (the product) and how you acquire buyers (the customers).
Most operators obsess over lead acquisition while underinvesting in buyer acquisition. This is backwards. Your lead sources are commoditized – anyone can buy traffic, build high-converting landing pages, or purchase aged leads. Your buyer relationships are not commoditized. They’re the defensible moat that determines long-term survival.
Buyer acquisition channels for lead gen typically include:
- Direct outreach to agents, brokers, and businesses that purchase leads
- Referrals from existing buyers
- Industry conferences and trade shows
- Content marketing targeting buyer pain points
- Aggregator platforms and exchanges
- Partner networks and white-label arrangements
Critical acquisition metrics to track:
- Cost per qualified buyer prospect across each channel
- Channel velocity: How many qualified prospects can each channel produce per month?
- Channel quality: What percentage of prospects from each channel eventually activate?
- Time to contact: How quickly do prospects from each channel move to first conversation?
The Bullseye Framework, developed by Gabriel Weinberg of DuckDuckGo, provides useful structure here. It identifies 19 potential acquisition channels and systematically tests which ones produce traction for your specific business. In lead gen, the winning channels vary dramatically by vertical. Insurance buyer acquisition looks different from home services buyer acquisition.
The acquisition bottleneck appears when:
- You have capacity to deliver more leads than you have buyers to accept them
- Your buyer prospect pipeline is thin or inconsistent
- New buyer acquisition costs are rising faster than buyer lifetime value
- You’re overly dependent on one or two acquisition channels
If acquisition is your bottleneck, no amount of lead quality improvement or pricing optimization will solve your growth problem. You need more buyer relationships before anything else matters.
Stage 2: Activation – The First Moment of Value
Activation measures whether new buyers actually experience value from your operation. In SaaS, this is often called the “aha moment” – the point where users understand why the product exists and why it matters to them.
For lead gen, the activation moment occurs when a buyer’s first batch of leads converts into real business. Not when they sign a contract. Not when they fund their account. Not when they receive their first lead. Activation happens when leads turn into closed deals or scheduled appointments on the buyer’s end.
The brutal reality of lead gen activation:
Most lead gen operations have no visibility into buyer activation. They deliver leads and hope for the best. This blindness creates massive churn risk. Buyers who don’t see conversion signals within their first 30-50 leads typically become detractors or cancel outright – often without telling you why.
Activation metrics that actually matter:
- Time to first conversion: How long from first lead delivery until the buyer closes their first deal?
- First-campaign conversion rate: What percentage of leads in the first campaign generate contact with prospects?
- Onboarding completion rate: What percentage of new buyers complete all setup steps (integrations, filters, caps, billing)?
- First 30-day NPS: Would new buyers recommend you after their first month?
- Drop-off analysis: Where in the onboarding process do new buyers abandon?
Strategies that improve activation:
-
Structured onboarding sequences: Don’t just deliver leads. Guide new buyers through account setup, CRM integration, filter configuration, and first-campaign optimization.
-
Proactive quality monitoring: Track early buyer campaigns for conversion signals. If a buyer’s first 20 leads show zero contact rate, intervene before they conclude you’re selling garbage.
-
Success benchmarking: Show new buyers what “good” looks like. If experienced buyers in their vertical see 12% contact rates, communicate that benchmark so new buyers know what to expect.
-
Feedback loops within the first week: Call new buyers after their first 48 hours of lead delivery. Ask what’s working, what’s not, and what they expected versus what they’re experiencing.
-
Lead credit policies for genuine quality issues: Nothing activates a skeptical buyer faster than a responsive quality guarantee. If early leads have data problems, fix them immediately.
The activation bottleneck appears when:
- You sign new buyers who never become regular purchasers
- Buyer churn is highest in the first 30-60 days
- New buyers consistently underperform experienced buyers on the same lead sources
- You have no data on what happens to leads after delivery
If activation is your bottleneck, improving lead sources or adding buyer prospects won’t help. You’re pouring water into a leaky bucket. Fix the onboarding and early success experience first.
Stage 3: Retention – Keeping Buyers Coming Back
Retention separates lead gen businesses that survive from those that compound. The economics are stark: acquiring a new buyer costs 5-7x what retaining an existing buyer costs. Every buyer who churns represents not just lost revenue but wasted acquisition and activation investment.
Lead gen retention operates differently than SaaS retention. Buyers don’t “subscribe” in the traditional sense. They purchase leads on an ongoing basis as long as your leads generate ROI. The moment your leads stop converting – or a competitor offers better conversion at comparable prices – buyers leave.
What drives lead gen retention:
-
Consistent quality: Not perfect quality, but predictable quality. Buyers can work with leads that convert at 8% if that rate stays stable. They can’t plan around sources that swing from 15% to 3% month to month.
-
Responsive service: When quality dips or delivery issues occur, how quickly do you address them? Buyers forgive problems. They don’t forgive being ignored.
-
Competitive pricing: Not necessarily the lowest price, but pricing that reflects value delivered. Buyers constantly compare your leads to alternatives.
-
Operational reliability: Leads arrive when promised, in the format expected, to the systems configured. Technical friction drives churn faster than quality issues.
-
Relationship investment: Do buyers feel like partners or transaction units? Regular check-ins, performance reviews, and proactive optimization suggestions build retention.
Retention metrics to track:
- Monthly retention rate: What percentage of buyers active 30 days ago are still active today?
- Cohort retention curves: How does retention evolve over 3, 6, 12, and 24 months? Where does the curve flatten?
- Revenue retention: Even if buyer count holds, is revenue per buyer increasing, stable, or declining?
- Churn reasons: When buyers leave, why? Exit interviews reveal patterns.
- Net Promoter Score by tenure: Are long-term buyers more or less likely to recommend you?
The retention bottleneck appears when:
- Monthly churn exceeds 5-8% (highly dependent on vertical and buyer segment)
- Cohort curves show sharp drops after 90-120 days
- Your buyer base is mostly new – few buyers from 12+ months ago remain active
- Revenue per buyer declines over time instead of expanding
If retention is your bottleneck, adding more buyers only accelerates the treadmill. You need to understand why buyers leave and fix the underlying causes.
Stage 4: Revenue – Unit Economics and Margin Optimization
Revenue in AARRR isn’t just “how much money you make.” It’s understanding the economics of your business at the unit level – per lead, per buyer, per vertical, per source.
Lead gen revenue optimization requires segmentation. Not all leads generate equal margin. Not all buyers deserve equal service investment. Not all verticals scale the same way.
Revenue metrics that drive decisions:
- Average revenue per lead by vertical, source, and buyer segment
- Gross margin per lead after accounting for traffic, data, and compliance costs
- Customer lifetime value (LTV) by buyer cohort
- LTV to customer acquisition cost (CAC) ratio – healthy operations maintain 3:1 or better (see how to calculate true ROI for accurate methods)
- Revenue concentration: What percentage of revenue comes from your top 10% of buyers?
- Expansion revenue: Are existing buyers purchasing more leads over time?
Calculating lead gen LTV:
A simplified formula for buyer lifetime value:
LTV = (Average monthly revenue per buyer) × (1 / monthly churn rate)
If a buyer averages $5,000/month and your monthly churn is 5%, LTV = $5,000 × 20 = $100,000.
This means you can theoretically spend up to $33,333 acquiring and activating that buyer and still maintain a 3:1 LTV:CAC ratio. In practice, you want significant cushion, but the calculation shows how retention improvements compound revenue dramatically.
Revenue optimization strategies:
-
Vertical focus: Identify which verticals generate the highest margins after all costs. Double down there; reduce exposure to margin-thin segments.
-
Buyer tiering: Not every buyer deserves white-glove service. Segment by LTV and allocate support resources accordingly.
-
Price testing: Lead gen pricing is often set arbitrarily and never revisited. Test price increases on new buyers; test volume discounts on high-value accounts.
-
Source portfolio optimization: Track margin by lead source. Eliminate sources that generate volume but not profit.
-
Exclusive vs. shared lead economics: Exclusive leads command premium prices but require premium sources. Model the margin difference to set appropriate pricing.
The revenue bottleneck appears when:
- Gross margins are thin or declining despite volume growth
- LTV:CAC ratio is below 2:1
- Revenue is concentrated in a few large buyers (concentration risk)
- Price pressure from buyers or competitors is compressing economics
If revenue is your bottleneck, generating more leads or adding more buyers won’t help – you’ll just lose more money faster. Fix unit economics first.
Stage 5: Referral – The Organic Growth Engine
Referral is the most undervalued stage in lead gen operations. Most operators never build referral engines because they’re too focused on paid acquisition and direct sales.
This is a strategic error.
Referral creates the only truly defensible competitive advantage in lead generation. Anyone can buy more traffic. Anyone can hire more sales reps. But when buyers voluntarily recommend your operation to other buyers in their network, you’ve built something that can’t be replicated with budget.
The mechanics of lead gen referral:
Lead buyers talk to each other. Insurance agents know other insurance agents. Mortgage brokers attend industry events with other mortgage brokers. Home service operators compare notes with competitors in adjacent territories.
When your leads convert and your operation runs smoothly, these conversations become referral channels:
“Who are you using for leads? They any good?” “I’ve been working with [your operation] for six months. Leads are solid. I can connect you.”
This word-of-mouth operates invisibly. Most operators never measure it, so they never optimize it.
Referral metrics to track:
- Referral rate: What percentage of new buyers came from referrals by existing buyers?
- Referral source tracking: Which buyers refer most frequently? What do they have in common?
- Referred buyer performance: Do referred buyers have higher activation rates, better retention, or greater LTV than non-referred buyers?
- Net Promoter Score: Would buyers recommend you? Promoters (9-10) generate referrals. Detractors (0-6) generate warnings.
- Viral coefficient: On average, how many new buyers does each existing buyer generate through referral?
Building referral engines:
-
Formal referral programs: Offer incentives for successful referrals – credits, discounts, or cash bonuses when referred buyers activate.
-
Ask for referrals explicitly: Most satisfied buyers never refer because nobody asks. Build referral requests into success conversations.
-
Make referral easy: Provide shareable assets – testimonial templates, performance summaries, introduction scripts – that reduce friction.
-
Recognize referrers: Public acknowledgment, tier upgrades, or exclusive access reward referral behavior and encourage more of it.
-
Fix detractors before they spread: Unhappy buyers don’t just leave – they warn others. Address complaints aggressively to prevent negative referral.
The referral bottleneck appears when:
- Nearly all new buyers come from paid acquisition or direct sales
- NPS is low or negative
- Satisfied buyers don’t spontaneously mention your operation to peers
- You have no mechanism to track or incentivize referral
If referral is your bottleneck after you’ve optimized acquisition, activation, retention, and revenue, you’re likely leaving significant growth on the table.
Finding Your Bottleneck: The AARRR Analysis Process
The power of AARRR lies in bottleneck identification. At any given time, one stage constrains your entire operation. Improving other stages won’t accelerate growth until you address the constraint.
Step 1: Map Your Funnel Quantitatively
Gather data for each stage. For a lead gen operation, this might look like:
| Stage | Metric | Current Value |
|---|---|---|
| Acquisition | New buyer prospects/month | 40 |
| Activation | Prospects → Active buyers | 25% |
| Retention | 90-day buyer retention | 65% |
| Revenue | Avg. margin per buyer/month | $1,200 |
| Referral | % new buyers from referral | 8% |
Step 2: Calculate Stage-to-Stage Conversion
The lowest conversion percentage identifies your bottleneck:
- Acquisition → Activation: 25% of prospects become active buyers (10 out of 40)
- Activation → Retention: 65% of new buyers remain active at 90 days
- Revenue per retained buyer: $1,200/month margin (evaluate against LTV target)
- Referral contribution: 8% of new buyers (3-4 per month from existing buyers)
In this example, activation at 25% stands out. Three-quarters of qualified prospects never become paying buyers. This is the bottleneck.
Step 3: Diagnose the Bottleneck
Once identified, the bottleneck requires qualitative investigation:
- Why aren’t prospects activating? Interview recent non-converters. Survey buyers who dropped during onboarding.
- Where do prospects fall off? Map the activation journey and identify the specific step with highest abandonment.
- What do activated buyers do differently? Compare behaviors of successful activators vs. non-activators.
Step 4: Focus Resources on the Bottleneck
The “One Metric That Matters” (OMTM) concept means concentrating on a single KPI until it’s no longer the constraint. If activation is your bottleneck, your OMTM might be “first 30-day conversion rate for new buyers.”
Every initiative, every experiment, every resource allocation should aim at improving that metric. When it improves sufficiently that another stage becomes the new constraint, shift focus.
Step 5: Repeat
AARRR analysis isn’t a one-time exercise. As you fix each bottleneck, new constraints emerge. The process is continuous.
Common AARRR Mistakes in Lead Generation
Mistake 1: Optimizing Non-Bottlenecks
An operation with 25% activation and 95% retention shouldn’t invest in retention improvement. The math is clear: doubling activation (25% → 50%) would double active buyer count. Improving retention (95% → 97%) would increase active buyer count by ~2%.
Yet operators routinely optimize things that feel important rather than things that are actually constraining.
Mistake 2: Tracking Vanity Metrics
“We generated 50,000 leads this month” tells you nothing about business health. Neither does “we have 200 buyers” or “revenue grew 15%.”
These metrics are vanity metrics unless contextualized within AARRR stages. How many of those leads came from sources that generate margin? How many of those 200 buyers are actually active? Is revenue growth coming from new buyer acquisition or expansion of existing relationships?
Mistake 3: Ignoring Referral
Most lead gen operations put zero effort into referral because it feels uncontrollable. This is false. Referral responds to systematic investment like any other stage. The operations that build referral engines outperform those that rely entirely on paid acquisition.
Mistake 4: Short-Term Revenue Focus
Raising prices or squeezing margins today might boost quarterly revenue while destroying retention and referral. AARRR demands systems thinking. Revenue optimization that damages other stages isn’t optimization – it’s extraction.
Mistake 5: Measurement Gaps
You can’t optimize stages you don’t measure. Many operations have detailed lead analytics but no buyer activation tracking, no cohort retention analysis, and no referral attribution. The framework only works with complete data.
AARRR in Practice: Case Patterns from Lead Gen Operations
Pattern 1: The Acquisition-Heavy Operation
Profile: Strong sales team, aggressive outreach, consistent new buyer flow. But churn is high, and buyer count plateaus despite continuous acquisition.
Diagnosis: Acquisition is strong. Activation or retention is the bottleneck. Buyers arrive but don’t experience value or don’t stick around.
Fix: Shift resources from sales to onboarding and account management. Measure time-to-first-conversion. Build early-warning systems for buyers not seeing results.
Pattern 2: The Quality-Obsessed Operation
Profile: Exceptional lead quality, high buyer satisfaction, strong retention. But growth is slow. New buyer acquisition can’t keep pace with market opportunity.
Diagnosis: Activation, retention, and revenue are healthy. Acquisition is the bottleneck. The product is good but nobody knows about it.
Fix: Invest in buyer acquisition channels. Launch referral programs to capitalize on satisfied buyers. Increase visibility in buyer markets.
Pattern 3: The Churn Machine
Profile: Good acquisition, acceptable activation, then buyers disappear after 60-90 days. Constant treadmill of replacing lost buyers.
Diagnosis: Retention is the bottleneck. Something happens after activation that drives buyers away.
Fix: Exit interviews with churned buyers. Cohort analysis to identify churn triggers. Proactive outreach before typical churn windows. Address quality consistency issues.
Pattern 4: The Low-Margin Operation
Profile: Healthy buyer count, reasonable retention, but profitability is thin. Every dollar of revenue costs ninety cents to generate.
Diagnosis: Revenue/unit economics is the bottleneck. The operation works but doesn’t generate sustainable margin.
Fix: Price testing with new buyers. Source portfolio review to eliminate margin-thin leads. Buyer tiering to reduce service costs for low-LTV accounts. Vertical focus on high-margin segments.
Beyond the Funnel: Growth Loops in Lead Gen
The traditional AARRR funnel is linear – acquisition flows to activation flows to retention flows to revenue flows to referral. But mature operations build growth loops where outputs from one stage feed inputs to another.
The Referral Loop: Retained, satisfied buyers refer new buyers who activate and retain, generating more referrals. This loop reduces acquisition cost over time and creates compounding growth.
The Revenue Reinvestment Loop: Revenue margin funds acquisition spend, which brings buyers who generate more revenue. Operations with healthy unit economics can outspend competitors on acquisition and still remain profitable.
The Data Quality Loop: More lead volume generates more performance data, which enables quality optimization, which improves buyer activation and retention, which enables more volume purchase from sources.
Building loops requires sequential command of AARRR stages. You can’t build referral loops without retention. You can’t build retention without activation. The framework provides the progression path.
Key Takeaways
-
AARRR segments your entire operation into five measurable stages: Acquisition (lead sources), Activation (first successful conversion), Retention (repeat buyer relationships), Revenue (margin per transaction), and Referral (organic growth from satisfied buyers). Each stage has distinct metrics and optimization levers.
-
Most lead gen businesses have exactly one bottleneck strangling growth at any given time. The framework forces you to identify whether you’re losing value at source acquisition, buyer activation, relationship retention, pricing/margin, or referral generation – then fix that single constraint before moving on.
-
Activation in lead gen means the “aha moment” where a buyer realizes your leads convert. This typically happens within the first 30-50 leads delivered. If buyers don’t see conversion signals by then, your activation rate will tank regardless of lead quality.
-
Retention economics dominate lead gen profitability. Acquiring a new buyer costs 5-7x more than retaining an existing one. A 5% improvement in buyer retention can increase lifetime value by 25-95%.
-
Revenue optimization requires understanding unit economics across segments. Not all lead verticals generate equal margin, and not all buyers deserve equal service levels. AARRR helps you identify which revenue sources compound and which drain resources.
-
Referral from satisfied buyers creates the only sustainable competitive advantage in lead gen. When buyers voluntarily recommend your operation to other buyers in their network, you’ve built something that competitors can’t easily replicate with more ad spend.
-
The framework exposes vanity metrics that mislead operators. Total leads generated, gross volume, and buyer count are meaningless without understanding conversion through each AARRR stage. A smaller operation with better stage-to-stage conversion often outperforms larger competitors.
-
Bottleneck identification requires honest data across all five stages. Most operators have visibility into one or two stages and make decisions based on incomplete information. AARRR demands measurement infrastructure across the complete lifecycle.
-
The “One Metric That Matters” at any given time emerges from AARRR analysis. Rather than tracking dozens of KPIs, focus resources on improving the single stage with the worst conversion percentage until it’s no longer the constraint.
-
Lead gen operations that implement AARRR systematically typically see 15-40% efficiency gains within six months. The gains come from eliminating wasted spend on non-bottleneck optimization and concentrating effort where it actually moves the needle.
Frequently Asked Questions
What exactly does AARRR stand for and where did it come from?
AARRR stands for Acquisition, Activation, Retention, Revenue, and Referral. Dave McClure, then at PayPal, introduced the framework in 2007 during a five-minute talk at Ignite Seattle. The name “Pirate Metrics” comes from the acronym’s resemblance to a pirate’s exclamation. Some practitioners add “Awareness” as an initial stage (making it AAARRR), though the original five stages remain the core framework.
How does the AARRR framework apply differently to lead generation versus SaaS?
In SaaS, the “customer” is typically the end user of software. In lead generation, the “customer” is the lead buyer – the agent, broker, or business purchasing leads. This distinction matters because lead gen operators have two products: the leads themselves (which must perform) and the buyer relationship (which must be nurtured). AARRR helps track both the buyer lifecycle and lead quality signals that drive buyer success.
What’s the most common bottleneck in lead generation businesses?
Based on patterns across the industry, activation is frequently the biggest bottleneck. Many operations excel at acquiring buyer prospects but fail to convert them into actively purchasing, satisfied buyers. This happens because operators focus on lead generation mechanics while underinvesting in buyer onboarding, success measurement, and early intervention when new buyers struggle.
How do I calculate customer lifetime value for lead buyers?
A simplified formula: LTV = (Average monthly revenue per buyer) × (1 / monthly churn rate). If a buyer generates $3,000/month in margin and your monthly churn rate is 4%, LTV = $3,000 × 25 = $75,000. This calculation helps determine appropriate customer acquisition cost limits and prioritize retention investments.
How often should I run AARRR analysis on my operation?
Full AARRR analysis should occur quarterly at minimum. However, tracking key metrics for each stage should be continuous. Monthly dashboards showing stage-to-stage conversion rates let you spot emerging problems before they become critical. After making significant changes to address a bottleneck, analyze impact within 60-90 days.
What’s the difference between acquisition for leads versus acquisition for buyers?
Lead acquisition means securing lead sources – traffic, data providers, publisher relationships. Buyer acquisition means developing relationships with agents, brokers, and businesses who purchase leads. Both matter, but buyer acquisition is typically more defensible. Lead sources can be replicated; buyer relationships built on trust and consistent performance cannot.
How do I track activation if I don’t know what happens to leads after delivery?
This is a common problem that requires solving before you can optimize activation. Methods include: buyer surveys about conversion rates, CRM integration showing lead disposition, callback from leads confirming contact, and conversion feedback tied to credits or bonuses. Without downstream visibility, you’re flying blind on the most critical success indicator.
What’s a healthy retention rate for lead generation buyers?
This varies significantly by vertical and buyer segment. Generally, monthly retention above 92% (annual retention above 35%) indicates healthy operations. Rates below 85% monthly suggest serious retention problems. More important than absolute numbers is the trend – improving retention month over month matters more than hitting arbitrary benchmarks.
Why is referral often neglected in lead generation?
Operators tend to focus on scalable, controllable acquisition channels like paid advertising and direct sales. Referral feels unpredictable and difficult to influence. In reality, referral responds to systematic effort – formal programs, explicit asks, easy sharing mechanisms, and attention to detractor recovery. Operations that ignore referral leave significant growth and margin on the table.
How does AARRR connect to the concept of “North Star Metric”?
The North Star Metric is your primary indicator of business health – the single number that, if improved, indicates everything else is working. AARRR helps identify which stage contains your current bottleneck, which then becomes your “One Metric That Matters” (OMTM) focus area. The North Star might be something like “monthly active buyers generating positive ROI,” while OMTM shifts based on which stage currently constrains growth.
Can I use AARRR for lead quality optimization, not just buyer management?
Yes. AARRR can apply to lead lifecycle as well as buyer lifecycle. Acquisition becomes lead source diversification, activation becomes lead qualification/validation, retention becomes source consistency, revenue becomes margin per lead by source, and referral becomes source partnerships and referral traffic. This dual application helps operators optimize both sides of their marketplace.
What tools help implement AARRR tracking for lead generation?
Analytics platforms like Mixpanel, Amplitude, or Google Analytics can track stage progression with proper configuration. Lead management systems should capture activation and retention data. CRM integration enables disposition tracking. NPS and survey tools measure referral potential. The key isn’t any single tool – it’s building the data infrastructure that provides visibility across all five stages.
Conclusion
The AARRR framework offers lead generation operators something rare in an industry dominated by volume metrics and short-term thinking: a systematic approach to understanding what actually drives sustainable growth.
Most lead gen businesses fail not from bad leads or insufficient volume, but from blindness about where their operations break down. They pour resources into acquisition while activation languishes. They obsess over quality while retention craters. They optimize revenue per lead while ignoring the referral engine that would reduce acquisition cost to zero.
AARRR forces clarity. Measure each stage. Calculate the conversion percentages. Find the bottleneck. Fix it. Repeat.
The operators who internalize this framework don’t just survive the industry’s brutal economics – they compound. Their buyer relationships deepen. Their unit economics improve. Their referral engines generate growth that competitors can’t replicate by outspending.
The framework is simple. Implementation requires discipline. The results separate businesses that scale from businesses that stall.
Sources
- McClure, Dave. “Startup Metrics for Pirates: AARRR!” Ignite Seattle, 2007.
- Amplitude - Pirate Metrics Framework
- McGaw - AARRR Pirate Metrics for Startups
- First Round Review - Startup Metrics That Matter
- Y Combinator - Startup School Lectures on Metrics