Platform dashboards claim credit for conversions that would have happened anyway. Incrementality testing reveals the truth: which marketing dollars actually generate new business versus which ones merely harvest existing demand. This guide provides the frameworks, methodologies, and implementation blueprints to measure true marketing impact.
Your Facebook Ads manager shows 400% ROAS. Your Google Ads dashboard claims 2,000 conversions last month. Your retargeting campaigns report 800% return on spend. The numbers look spectacular.
But here is the question nobody wants to ask: How many of those conversions would have happened without the advertising?
That brand search campaign claiming credit for 500 conversions might be capturing consumers who were already navigating to your site. That retargeting campaign with impressive ROAS might be showing ads to people who had already decided to buy. That Facebook prospecting campaign could be reaching consumers who would have found you through organic search anyway.
Platform-reported metrics measure correlation, not causation. They answer “what touchpoints were present before conversion?” but not “what touchpoints actually caused the conversion?”
Incrementality testing answers the causation question. It reveals which marketing spend genuinely creates new demand versus which spend merely captures demand that already existed. For lead generation businesses operating on 15-25% net margins, the difference between 400% platform-reported ROAS and 40% true incremental lift determines whether scaling makes you rich or drives you into bankruptcy.
This article provides the complete framework for implementing incrementality testing in lead generation operations. You will learn the core methodologies, understand when each approach works best, see worked examples with real numbers, and develop the operational infrastructure to make incrementality measurement a competitive advantage.
The math will be uncomfortable. Some of your best-looking campaigns will prove far less valuable than dashboards suggest. But uncomfortable truths beat comfortable lies. Let us find out what actually works.
What Is Incrementality Testing?
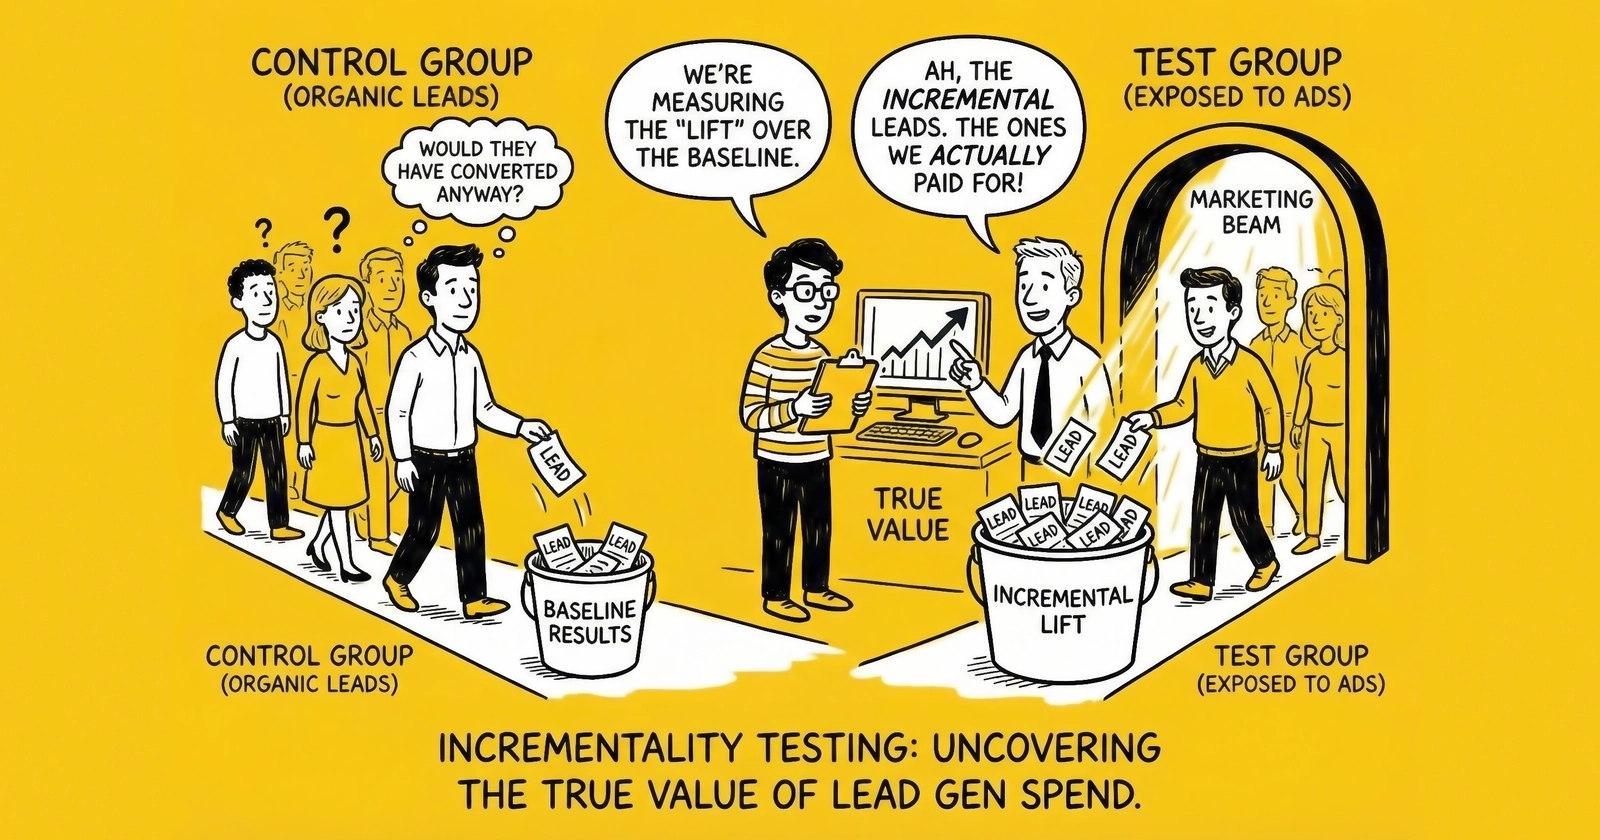
Incrementality testing measures the true causal impact of marketing by comparing outcomes between groups exposed to advertising versus groups that were not exposed.
The fundamental question: What would have happened if we had not run this campaign?
Traditional attribution models cannot answer this question. They operate retrospectively, assigning credit to touchpoints that preceded conversion. But presence before conversion does not prove causation. A consumer who saw your retargeting ad and then converted might have converted anyway. The ad was present, but was it causal?
Incrementality testing creates controlled experiments that isolate marketing’s true effect. By holding back advertising from a comparable control group and measuring the difference in outcomes, you observe the actual lift generated by your spend.
The Core Concept
Consider a simplified example. You run a retargeting campaign reaching 100,000 website visitors. Platform reporting shows 2,000 attributed conversions at $50 CPA. That looks like strong performance.
Now run an incrementality test by randomly splitting your audience. Show ads to 50,000 people in the test group while holding back ads from 50,000 in the control group.
The results tell a different story. Your test group that saw ads generates 1,200 conversions for a 2.4% conversion rate. Your control group that saw no ads still generates 900 conversions for a 1.8% conversion rate. The incremental conversions equal just 300, not 1,200. The incremental lift is 33%, calculated as the difference in rates divided by the control rate.
Your platform reported 1,200 attributed conversions from the test group. But only 300 were truly incremental. The other 900 would have happened anyway. True CPA equals ad spend divided by incremental conversions, making it four times higher than the platform-reported CPA. This changes everything about how you evaluate and allocate budget.
Why Incrementality Matters for Lead Generation
Lead generation economics amplify the importance of accurate measurement.
Consider the typical unit economics. You pay $30 to acquire a lead and sell it for $50. That $20 gross margin erodes to $8-12 after returns, compliance costs, float, and overhead. At 16-24% net margin, budget allocation mistakes compound quickly. Understanding the key metrics in lead generation helps contextualize incrementality findings.
If you scale a campaign that appears to generate 300% ROAS but actually delivers 50% incremental lift, you are destroying margin while believing you are printing money. The platform shows profit; your bank account shows losses. This gap has killed more lead generation businesses than any competitive threat.
According to industry research, companies implementing proper incrementality measurement achieve 10-20% improvements in marketing efficiency through reallocation from low-lift to high-lift activities. On a $1 million annual marketing budget, that represents $100,000-$200,000 in recovered spend or improved outcomes.
The stakes extend beyond efficiency. Incrementality testing reveals which channels create demand versus which ones capture it. This understanding shapes strategic decisions about brand building, market expansion, and sustainable growth.
The Attribution Problem: Why Platform Metrics Mislead
Before diving into incrementality methodologies, understand why traditional attribution systematically overstates performance.
Last-Touch Attribution Inflates Closers
Last-touch attribution, the default in most analytics platforms, gives 100% credit to the final interaction before conversion. This systematically overvalues channels that reach consumers late in the decision journey.
Consider a typical lead generation conversion path. A consumer first sees a Facebook ad but does not click. Later, they search “[problem] solutions” on Google and click an organic result. They read your comparison content. A few days later, they see a retargeting ad on a news site. Finally, they search your brand name, click your paid ad, and fill out the lead form.
Last-touch credits the brand search ad for the entire conversion. But that consumer was already navigating to you. The brand search ad intercepted existing intent rather than creating it.
Brand search campaigns routinely show 400-600% ROAS in last-touch reporting. Incrementality tests typically reveal 20-50% incremental lift. The gap represents captured demand versus created demand.
Platform Self-Attribution Creates Conflicts
Every major advertising platform has a financial incentive to show strong performance. Facebook wants you to spend more on Facebook. Google wants you to spend more on Google. Their measurement methodologies optimize for their revenue, not your truth.
Platform-specific attribution windows compound the problem. Facebook might claim credit for any conversion within 7 days of a view or 28 days of a click. Google might claim credit for different windows. When a consumer saw ads on both platforms before converting, both claim the conversion. Your total “attributed” conversions exceed actual conversions.
A 2024 industry analysis found that aggregating platform-reported conversions across channels overstated actual conversions by 30-50% for typical multi-channel advertisers. Someone is claiming credit for conversions they did not cause.
View-Through Attribution Debates
Did that impression someone saw but did not click actually contribute to conversion?
Platform self-attribution says yes. A consumer who saw a Facebook ad and converted within the attribution window gets attributed to Facebook, regardless of whether they clicked or even consciously noticed the ad.
Independent research consistently shows that view-through conversions inflate platform-reported performance. Some view-through impressions contribute genuine influence. Many do not. Platform measurement treats them all as causal.
Incrementality testing resolves this debate empirically rather than philosophically. You do not argue about whether impressions matter. You measure whether outcomes change when impressions are present versus absent.
Cross-Device and Privacy Fragmentation
Modern attribution faces structural data challenges beyond platform incentives.
A consumer researching on mobile during their commute, considering options on a work laptop, and converting on a home desktop appears as three separate users in most tracking systems. Without robust identity resolution, the mobile touchpoints receive no credit for the desktop conversion.
Privacy restrictions compound fragmentation. Safari blocks third-party cookies entirely. Chrome is deprecating third-party cookies. Apple’s App Tracking Transparency requires explicit opt-in for cross-app tracking. Current estimates suggest 30-40% of web traffic uses privacy-first settings that limit attribution tracking. Server-side tracking provides one response to these challenges.
Attribution models built on fragmented data produce fragmented insights. Incrementality testing, by measuring aggregate outcomes rather than individual journeys, sidesteps many fragmentation challenges.
Incrementality Testing Methodologies
Four primary methodologies enable incrementality measurement. Each suits different contexts, budgets, and data environments.
Geographic (Geo) Experiments
Geo experiments compare advertising regions against control regions where you do not advertise. The approach works by identifying comparable geographic markets with similar demographics and baseline conversion rates, then randomly assigning markets to either receive advertising or serve as controls. After running the experiment for four to eight weeks to accumulate sufficient data, you compare conversion rates between test and control markets and calculate incremental lift as the percentage difference in performance.
Consider how a solar lead generator might measure the incrementality of their Facebook prospecting campaigns. They select Phoenix, Las Vegas, Denver, and Portland as test markets to receive Facebook ads, while Tucson, Albuquerque, Salt Lake City, and Seattle serve as control markets with no Facebook advertising. Markets are selected for demographic and solar adoption similarity. The test runs for six weeks, with two weeks of baseline measurement beforehand to verify market comparability.
The results reveal the truth. Test markets generate 4,200 leads, averaging 1,050 per market. Control markets generate 2,800 leads, averaging 700 per market. Assuming matched market sizes, the incremental leads equal 1,400. Incremental lift comes to 50%. With $84,000 in Facebook ad spend across test markets, the true incremental CPL is $60. Compare that to the platform-reported CPL of $20 based on attributed conversions. True incremental cost runs three times higher.
Geo experiments offer significant advantages. They measure real-world impact without platform bias and control for external factors affecting both regions equally. Results work across channels rather than just individual platforms, and the methodology produces transparent, auditable findings.
The challenges are equally real. You need sufficient volume in each market for statistical significance. Geographic selection affects validity because markets must be genuinely comparable. Cross-market contamination from travelers and spillover effects dilutes measurement. Longer test periods are required for reliable results, and you bear the opportunity cost of not advertising in control markets.
Geo experiments work best for large advertisers with sufficient volume across markets, for testing channel-level effectiveness across all Facebook or all Google spend, for measuring offline and online conversions together, and for building baseline incrementality benchmarks.
Holdout Tests (Audience Holdbacks)
Holdout tests randomly exclude a portion of your target audience from campaigns, comparing their conversion rates to exposed audiences. The methodology starts with defining your target audience, whether website visitors, email subscribers, or lookalike audiences. You randomly split them into test groups that see ads and control groups that do not. After running campaigns exclusively to the test group for the defined period, you compare conversion rates and calculate incremental lift from the difference.
An auto insurance lead generator testing their retargeting campaign incrementality illustrates the approach. They take 200,000 website visitors from the past 30 days and split them into a test group of 180,000 (90%) who receive retargeting ads and a control group of 20,000 (10%) held back from ads. The test runs for four weeks, measuring lead form submissions as the conversion event.
The test group converts 5,400 visitors for a 3.0% conversion rate. The control group converts 480 visitors for a 2.4% conversion rate. Incremental lift equals 25%. Platform-reported attributed conversions from the test group show 5,400, but true incremental conversions equal 5,400 minus the 4,320 conversions that would have happened anyway, leaving just 1,080 incremental leads. Retargeting spend of $27,000 produces a platform-reported CPA of $5.00 but a true incremental CPA of $25.00. The retargeting campaign delivers value, but at five times the cost platform reporting suggests. Budget allocation decisions shift accordingly.
Holdout tests provide precise audience targeting that enables clean test and control splits. They deliver faster results than geo tests because there is no geographic variance, with lower opportunity cost since smaller holdout percentages suffice. The methodology works within platform tools, as Facebook offers conversion lift studies natively.
The challenges include requiring platform cooperation for implementation. Control group members may still see ads through other channels. Smaller holdout samples need longer test periods for significance, and the methodology cannot measure cross-channel effects since it captures only in-platform impact.
Holdout tests work best for retargeting and remarketing campaigns, for testing specific audiences within broader campaigns, on platforms offering native holdout capabilities like Meta and Google, and for campaigns with sufficient conversion volume for statistical power.
Platform Lift Studies
Major platforms offer native incrementality measurement through structured lift studies.
Meta’s conversion lift studies randomize users into test groups that see ads and control groups that do not within your defined audience. Meta handles randomization, measurement, and statistical analysis, reporting incremental conversions and cost per incremental conversion. Running these studies requires minimum $5,000-10,000 test budgets depending on market, campaigns running at least two weeks before measurement, sufficient conversion volume for statistical significance (typically 500 or more conversions), and properly configured conversion tracking.
Google offers similar lift measurement for YouTube and Display campaigns. The methodology randomizes users and measures the difference in conversion behavior between exposed and unexposed groups. Google typically requires significant spend levels of $20,000 or more for YouTube studies, two to four week test periods, and conversion tracking across Google properties.
TikTok provides brand lift studies measuring awareness and consideration rather than direct conversions. These prove useful for upper-funnel measurement but less applicable to direct response lead generation.
Platform lift studies offer turnkey implementation where the platform handles complexity, large sample sizes from platform audience scale, integration with existing campaigns, and statistical rigor built into the methodology.
The challenges are significant. Platform-conducted studies may still favor platform performance. Limited transparency exists into methodology details. Measurement restricts to single platforms. Budget minimums exclude smaller advertisers, and results prove difficult to audit or replicate.
Platform lift studies work best for initial incrementality benchmarking, for large advertisers with substantial platform spend, for campaigns where platform measurement aligns with your goals, and for validating platform-reported performance claims.
Time-Based Toggle Tests
Time-based tests turn campaigns off for defined periods and measure the impact on conversions. The methodology establishes baseline conversion volume with campaigns running, pauses campaigns for a defined period of typically two to four weeks, measures conversion volume during the pause, calculates the drop attributable to campaign absence, then reactivates campaigns and verifies recovery.
A mortgage lead generator testing Google Non-Brand search incrementality demonstrates the approach. They establish a baseline over four weeks with Google Non-Brand running, generating 1,200 leads per week on average. They pause Google Non-Brand for three weeks while tracking lead volume, then reactivate campaigns and monitor the return to baseline.
Baseline weekly leads of 1,200 drop to 880 during the pause, a 27% decline. Weekly incremental leads from Google equal 320. Platform-reported weekly attributed leads showed 600, meaning true incremental performance is 53% of attributed. Weekly spend of $18,000 produces a platform-reported CPA of $30 but a true incremental CPA of $56.25.
Time-based tests offer simplicity since you just pause campaigns. They measure true bottom-line impact without requiring holdout audience configuration and work for any channel or campaign type.
The challenges include confounding pause effects with organic trends. Seasonality and external factors affect results. You lose revenue during the pause period. Delayed effects may not appear within the test window, and reactivation may not return to baseline immediately.
Time-based tests work best for quick directional reads on channel value, for channels where geo or holdout testing is impractical, for initial hypothesis testing before rigorous experiments, and for small advertisers without resources for complex studies.
Implementation Framework: Building an Incrementality Program
Moving from understanding incrementality to practicing it requires systematic implementation.
Phase 1: Audit Current Attribution
Before running incrementality tests, understand what your current measurement shows.
Start by documenting platform-reported performance for each major channel. Capture attributed conversions from the last 90 days, platform-reported CPA and ROAS, the attribution window used, and the conversion definition explaining what counts as a conversion.
Next, identify discrepancies by comparing total platform-reported conversions to actual conversions. If Facebook reports 3,000 and Google reports 2,500 but you only had 4,000 actual leads, significant overlap exists.
Calculate theoretical incrementality based on industry benchmarks to estimate likely incremental performance. Brand search typically shows 10-25% incremental lift with attribution inflation of 4-10x. Retargeting runs 20-40% incremental lift with 2.5-5x inflation. Non-brand search delivers 40-60% incremental lift with 1.5-2.5x inflation. Social prospecting shows 30-50% incremental lift with 2-3x inflation. Display prospecting produces 15-35% incremental lift with 3-7x inflation. These ranges reflect industry patterns, but your actual results will vary based on brand strength, market position, and competitive dynamics.
Prioritize testing starting with channels where you have the highest spend for the largest potential reallocation impact, where you see the widest gap between reported and suspected incremental performance, and where the cleanest test implementation is possible.
Phase 2: Design Your First Test
Select one channel for your initial incrementality test and keep it simple.
Match your methodology to your situation. High-volume, multi-market operations should use geo experiments. Strong retargeting programs fit audience holdouts. Major platform spend aligns with platform lift studies. Limited resources point to time-based toggles.
Define success metrics with incrementally conversions and incremental CPA as primary measures, incremental conversion rate lift and cost per incremental percentage point as secondary measures, and a statistical significance threshold of typically 95% confidence for validation.
Calculate sample size requirements based on your baseline conversion rate and the minimum detectable effect you care about. Detecting 20% or greater lift requires 400-600 conversions per group. Detecting 10-20% lift requires 800-1,200 conversions per group. Detecting 5-10% lift requires 2,000-3,000 conversions per group. For lead generation with conversion rates of 2-5%, this translates to audience sizes of 20,000-100,000 or more depending on test sensitivity requirements.
Determine test duration recognizing that most incrementality tests require four to eight weeks. The first two weeks establish baseline and verify test and control comparability. Weeks three through six form the core measurement period. Weeks seven and eight provide extended observation for delayed effects. Shorter tests risk insufficient sample size while longer tests risk external factors contaminating results.
Phase 3: Execute and Monitor
Launch your test with monitoring protocols in place.
Pre-test verification confirms that randomization worked and test and control groups are comparable, verifies tracking functions correctly, and establishes baseline metrics for both groups.
Weekly monitoring tracks conversion volumes in both groups, watches for external factors like competitors, seasonality, and news events, and documents any anomalies or changes.
Avoid mid-test changes at all costs. Do not adjust campaigns during the test period. Changes invalidate the experiment by introducing variables beyond the test condition.
Document everything including test parameters, implementation details, any issues encountered, and observations. This documentation enables replication and interpretation.
Phase 4: Analyze Results
After test completion, conduct rigorous analysis.
Calculate incremental metrics. Incremental conversions equal test conversions minus control conversions adjusted for group sizes. Incremental lift equals the difference in rates divided by the control rate. Incremental CPA equals ad spend divided by incremental conversions. Incremental ROAS equals incremental revenue divided by ad spend.
Assess statistical significance using standard statistical tests to determine whether observed differences exceed chance variation. Online calculators and spreadsheet formulas can compute confidence intervals and p-values. The typical threshold is 95% confidence with a p-value less than 0.05, meaning there is less than 5% probability the observed difference occurred by chance.
Compare to attribution by calculating the inflation factor as platform-reported conversions divided by incremental conversions. An inflation factor of 3 means platform reporting claims three times the conversions that actually resulted from the advertising.
Contextualize results by considering external factors that may have influenced outcomes including seasonality differences between test and control periods, competitor actions during the test window, economic or market changes, and product or pricing changes.
Phase 5: Act on Findings
Incrementality insights drive budget reallocation.
Recalculate true ROI for each tested channel by applying incremental metrics. True ROI equals incremental revenue minus ad spend, divided by ad spend, times 100. Compare to platform-reported ROI. The gap indicates misallocation potential.
Reallocate budget by shifting spend from low-incremental to high-incremental activities. A channel showing 500% platform ROAS but only 80% incremental ROAS warrants reducing spend by 40%. A channel showing 400% platform ROAS with 120% incremental ROAS deserves maintenance and optimization. Social prospecting at 180% platform ROAS but 160% incremental ROAS justifies increasing spend by 25%. Non-brand search at 250% platform ROAS with 200% incremental ROAS warrants a 15% spend increase. Shifting budget from brand search despite its high reported performance to prospecting despite its lower reported performance improves actual returns.
Update forecasting models by replacing platform-reported metrics with incremental metrics in your planning. Use incremental CPA for budget planning, incremental conversion rates for volume forecasting, and incremental ROAS for revenue projection.
Establish ongoing measurement recognizing that incrementality changes over time. Brand strength, competitive dynamics, and market conditions affect how much advertising creates versus captures demand. Build an annual testing calendar with major channels tested annually, testing before and after significant spend changes, new channels tested within the first 90 days, and strategy shifts tested to validate impact.
Advanced Incrementality Concepts
Beyond basic lift measurement, sophisticated practitioners apply advanced concepts.
Marginal Incrementality
Not all spend within a channel delivers equal incrementality. The first $10,000 in a channel might generate 60% incremental lift. The next $10,000 might generate 40%. The next $10,000 might generate 20%.
Marginal incrementality measures the incremental value of additional spend, not average incrementality across all spend.
This matters because a channel with 50% average incrementality might deliver 80% incrementality on the first half of budget, 40% on the next 30%, and just 10% on the final 20%. Optimal budget allocation requires understanding where marginal returns decline below threshold. You might achieve higher total incrementality by capping high-volume channels and redistributing to emerging opportunities.
Measuring marginal incrementality requires running multiple tests at different spend levels. Test at 50% of current spend, then at 100%, then at 150%. Plot incremental conversions against spend to identify the curve shape. Where the curve flattens, marginal incrementality declines.
Incrementality by Audience Segment
Aggregate incrementality masks segment-level variation.
Your retargeting campaign might show 30% average incremental lift, but segment performance varies dramatically. Cart abandoners might deliver 60% incremental lift while product page viewers show 35% and homepage-only visitors produce just 10%.
Segment-level incrementality reveals optimization opportunities. Reduce spend on low-lift segments and increase spend on high-lift segments.
Implement this by running holdout tests at the segment level. Compare incrementality across funnel stage from awareness to consideration to decision, time since last visit at one day, seven days, and 30 days, engagement level measured by pages viewed and time on site, and previous purchase behavior. Reallocate retargeting budget to highest-lift segments.
Cross-Channel Incrementality
Most incrementality tests measure single-channel impact, but channels interact.
Cutting Facebook prospecting might reduce retargeting audience size, lowering retargeting conversions. Google Brand search incrementality might depend on awareness driven by display advertising. The true incrementality of any channel includes its effects on other channels.
Measuring cross-channel effects requires sequential tests. First measure Channel A incrementality with Channel B running. Then measure Channel A incrementality with Channel B paused. Compare the results.
If Channel A incrementality drops when Channel B is paused, Channel B contributes to Channel A outcomes even if Channel B’s direct incrementality is low. This reveals “assist” value that single-channel tests miss.
Incrementality and Lifetime Value
Incrementality measures conversion impact, but conversions are not equal. An incremental lead that becomes a high-LTV customer is worth more than an incremental lead that returns or never converts downstream.
LTV-weighted incrementality counts incremental conversions by their expected lifetime value rather than equally. Incremental value equals the sum of incremental conversions times expected LTV per segment.
A channel generating incremental leads with 20% higher LTV delivers more value than raw incremental count suggests. Track LTV by acquisition channel and apply weights to incrementality calculations. This prevents optimizing for incremental volume at the expense of incremental value.
Common Incrementality Pitfalls
Avoid these mistakes that invalidate incrementality testing.
Insufficient Sample Size
The most common error occurs when testing with too few conversions produces noisy results that fluctuate randomly rather than revealing true effects.
Symptoms include results flipping direction between weeks, wide confidence intervals showing incremental lift between -10% and +50%, and small changes in data producing dramatically different conclusions.
Prevention requires calculating required sample size before testing, running tests long enough to accumulate sufficient conversions, and extending test duration or increasing test budget when conversion volume is low.
Contaminated Control Groups
Control groups must be genuinely unexposed to the tested advertising.
Common contamination sources include control users seeing ads through other devices when you test on mobile but they view on desktop, control users seeing organic brand content influenced by advertising, control users being influenced by exposed users through word of mouth, and technical errors allowing ads to reach control groups.
Prevention involves using platform-native holdout features that enforce true exclusion, auditing control group ad exposure through spot checks, and accepting that some contamination is unavoidable while interpreting results as lower bounds.
Ignoring External Factors
Incrementality tests measure differences between test and control groups. If external factors affect both groups equally, the test remains valid. If external factors affect groups differently, results are contaminated.
Risk factors include seasonality from holiday timing and weather, competitor actions through new campaigns and pricing changes, PR or news coverage, product or pricing changes during the test, and economic shifts.
Prevention requires documenting external events during test periods, running longer tests to average out short-term fluctuations, using multiple test periods to validate findings, and considering waiting to test during stable periods.
Over-Interpreting Single Tests
One incrementality test provides one data point. Marketing conditions change. A test conducted in Q1 may not represent Q4 reality.
Prevention means building ongoing testing into operations, validating critical findings with repeat tests, and using incrementality as input to decisions rather than the sole determinant.
Acting Too Aggressively on Results
When an incrementality test reveals Brand Search has only 15% incremental lift versus 500% platform-reported ROAS, the temptation is to slash Brand Search spend immediately.
The risk is that brand search might protect against competitor conquesting. Reducing spend might cede traffic to competitors. The 15% incremental lift from your brand search exists in a context where you are defending your brand. The counterfactual of no brand search might include competitor capture.
Prevention requires reducing spend incrementally and measuring competitive impact, considering brand defense value separately from direct response incrementality, and testing response to spend changes before committing fully.
Incrementality for Lead Generation Verticals
Incrementality patterns vary by vertical. Typical benchmarks help calibrate expectations.
Insurance Lead Generation
Insurance lead generation shows distinct incrementality patterns. Brand search typically delivers 15-25% incremental lift because heavy brand advertising from national carriers creates baseline awareness. Non-brand search runs 50-70% incremental due to high intent and less platform inflation. Facebook prospecting shows 35-50% incremental lift reflecting moderate consideration cycles. Retargeting produces 25-40% incremental lift given comparison shopping behavior.
Important context shapes these patterns. Insurance has high brand advertising saturation with national carriers spending billions on awareness. This creates baseline demand that lead generators capture but did not create. Lower-brand-awareness generators see higher incrementality because they have less existing awareness to capture. Understanding insurance lead CPL benchmarks provides context for these incrementality findings.
Seasonal effects matter significantly. AEP (Annual Enrollment Period) for Medicare creates natural demand that would exist without advertising. Incrementality during AEP is typically lower than off-season. Our guide to insurance lead seasonality explores these patterns in detail.
Mortgage Lead Generation
Mortgage lead generation follows its own patterns. Brand search typically shows 10-20% incremental lift because rate-sensitive consumers shop actively. Non-brand search delivers 55-75% incremental performance from high intent and rate comparison behavior. Display prospecting runs 20-35% incremental given longer consideration cycles. Retargeting produces 30-45% incremental lift since multi-session research is common.
Critical considerations include that mortgage demand is rate-driven. When rates drop, demand spikes independent of advertising. Incrementality tests during rate changes produce unreliable results as external factors dominate.
Long consideration cycles of 30-90 days require extended measurement windows. Short tests miss downstream conversions influenced by early touchpoints.
Solar Lead Generation
Solar lead generation presents another distinct pattern. Brand search shows 20-35% incremental lift in a less saturated market than insurance. Non-brand search delivers 45-65% incremental performance from high intent and location-specific targeting. Facebook prospecting runs 30-45% incremental because the visual product benefits from creative. Native advertising produces 25-40% incremental lift through content-driven consideration.
Geography dramatically affects solar incrementality. In saturated markets like California, incrementality runs lower as consumers actively research regardless of advertising. In emerging markets, advertising creates awareness that would not exist otherwise, producing higher incrementality.
Installer relationships affect measurement. If your leads go to multiple installers, incrementality at the lead level may differ from incrementality at the installation level. Track downstream outcomes where possible.
Legal Lead Generation
Legal lead generation follows its own dynamics. Brand search shows 10-20% incremental lift because advertising primes awareness of need. Non-brand search delivers 60-80% incremental performance from high urgency and active search. TV and radio produce 25-40% incremental lift through awareness building for future need. Display runs 15-30% incremental given lower intent audiences.
The fundamental consideration is that legal need often arises from life events like accidents, divorces, and arrests independent of advertising. Incrementality for awareness channels is about being remembered when need arises, not creating the need.
Long attribution windows are necessary. Someone who saw your ad today may not need a lawyer for months. Short-term incrementality tests understate true impact.
Building the Business Case for Incrementality Testing
Implementing incrementality testing requires investment. Build the business case to secure resources.
Quantifying the Opportunity
Calculate potential value from improved measurement through a structured approach.
Start by estimating current misallocation. Assume platform attribution overstates incrementality by 2-3x, a conservative industry estimate. If you spend $1,000,000 annually on marketing and believe you are achieving 200% ROAS, true incremental ROAS might be 65-100%.
Then estimate reallocation potential. If 40% of current spend goes to low-incremental activities, reallocation could shift $400,000 to higher-incremental uses.
Calculate the improvement. If reallocation improves average incrementality by 30% on shifted spend, $400,000 times 0.30 equals $120,000 in additional value annually.
Compare to investment. Incrementality testing program costs might include platform lift study fees of $10,000-30,000 annually, testing budget representing holdout opportunity cost of $20,000-50,000, and analysis time whether internal or agency of $15,000-30,000. Total investment runs $45,000-110,000. Expected return exceeds $120,000. Payback occurs in less than one year.
Stakeholder Alignment
Different stakeholders care about different aspects of incrementality.
For CFOs and finance leaders, focus on true ROI versus reported ROI. Emphasize margin protection and cash flow impact. Show how misattribution leads to cash destruction.
For CMOs and marketing leaders, focus on strategic budget optimization. Emphasize competitive advantage from better measurement. Show the path to scaling profitably.
For media buyers and practitioners, focus on making their work more valuable. Emphasize that incrementality reveals their true impact, which is often higher than currently credited for prospecting. Show how measurement enables justified budget requests.
For executives, focus on business sustainability. Connect measurement accuracy to growth trajectory. Position incrementality as table stakes for sophisticated practitioners.
Implementation Roadmap
In Quarter 1, build the foundation by auditing current attribution setup, documenting platform-reported metrics, designing your first incrementality test, and securing budget and stakeholder buy-in.
In Quarter 2, execute your first test by running your initial incrementality study on your largest spend channel, analyzing results and documenting findings, presenting to stakeholders, and developing reallocation recommendations.
In Quarter 3, expand and validate by testing your second major channel, validating first test findings with a different methodology, implementing budget reallocations based on learnings, and building incrementality into reporting dashboards.
In Quarter 4, institutionalize the program by establishing an annual testing calendar, integrating incremental metrics into planning processes, training your team on incrementality concepts, and documenting institutional knowledge.
Frequently Asked Questions
Q: How often should I run incrementality tests?
Major channels warrant annual testing at minimum. Test more frequently when spend levels change significantly (increasing or decreasing by more than 30%), when market conditions shift materially, or when you are launching into new channels or audiences. Quarterly testing on your highest-spend channel provides ongoing validation. Avoid over-testing, which consumes budget and creates measurement fatigue.
Q: What is the minimum budget needed for incrementality testing?
Meaningful incrementality testing requires sufficient conversions for statistical significance. As a rough guide, you need 400-600 conversions per group (test and control) to detect 20%+ lift with 95% confidence. For lead generation with 2-5% conversion rates, this means audience sizes of 20,000-40,000+ per group. At typical CPLs of $30-100, you need $6,000-40,000+ in test spend to generate enough conversions. Platform lift studies typically require $5,000-20,000 minimum budgets. Geo tests require sufficient volume across multiple markets, typically $50,000+ monthly spend.
Q: How long should incrementality tests run?
Most incrementality tests require 4-8 weeks for reliable results. Factors extending test duration include lower conversion volume (need more time to accumulate conversions), longer consideration cycles (leads need time to convert), higher variance in baseline metrics (need more data to establish significance), and seasonal factors requiring measurement across multiple conditions. Factors shortening test duration include high conversion volume, short sales cycles, and stable baseline metrics.
Q: Can I run incrementality tests on small budgets?
Smaller budgets constrain testing approaches but do not eliminate options. For budgets under $10,000/month, consider time-based toggle tests (pause campaigns and measure impact), or focus on your single largest channel where accumulated data enables faster significance. Accept that confidence intervals will be wider and results more directional than precise. Alternatively, aggregate several months of data through multiple shorter test periods.
Q: How does incrementality testing work with multi-touch attribution?
Incrementality testing and multi-touch attribution answer different questions. Multi-touch attribution distributes credit across touchpoints in the observed conversion path. Incrementality testing measures whether those touchpoints caused conversions that would not have happened otherwise. Use both: Multi-touch attribution guides within-channel optimization (which audiences, creatives, placements). Incrementality testing guides across-channel budget allocation (how much total to invest in each channel). Periodically validate multi-touch attribution assumptions with incrementality testing to ensure attribution credit aligns with causal impact.
Q: What if my incrementality results conflict with platform-reported metrics?
Conflict is expected. Platform-reported metrics systematically overstate performance due to attribution methodology and business model incentives. When incrementality shows lower performance than platform reporting, trust the incrementality results. They measure causal impact while platform reporting measures correlation. Use the gap to recalibrate expectations and reallocate budget. Document the inflation factor (platform-reported / incremental) for ongoing planning.
Q: How do privacy changes affect incrementality testing?
Privacy restrictions (cookie deprecation, tracking prevention, ATT) reduce platform attribution accuracy, which actually increases the importance of incrementality testing. As attribution tracking becomes less reliable, experimentally measured incrementality becomes more valuable as ground truth. Geo experiments are relatively unaffected by individual-level tracking restrictions. Platform holdout studies continue to work within walled gardens. Time-based tests require no user-level tracking. Invest in incrementality capabilities as attribution coverage degrades.
Q: Should I test during peak seasons or avoid them?
Test during peak seasons if your business is primarily seasonal and peak represents material portion of annual revenue. Peak season incrementality is what matters most for annual planning. Avoid testing during peak if you cannot afford the opportunity cost of holdouts or pauses during your highest-revenue period, or if peak-specific factors (competitor behavior, demand spikes) would contaminate results. Ideally, test during both peak and off-peak to understand how incrementality varies with demand conditions.
Q: How do I handle incrementality for brand advertising versus direct response?
Brand advertising incrementality operates on longer time horizons and indirect effects. A TV campaign today may not generate measurable conversions for months. Approaches for brand incrementality testing include matched market testing over extended periods (6-12 months), brand lift studies measuring awareness and consideration, and correlating regional brand investment with regional conversion performance over time. Expect brand incrementality measurement to be less precise than direct response. Focus on directional findings and order-of-magnitude estimates rather than exact lift percentages.
Q: What is the relationship between incrementality and LTV (Lifetime Value)?
Incrementality measures whether marketing causes conversions. LTV measures the value of those conversions over time. Optimal marketing combines both: seek incrementality-positive channels that generate high-LTV customers. A channel might show 50% incremental lift but attract low-LTV leads that return or never convert downstream. Another channel might show 30% incremental lift but attract high-LTV leads worth 2x the average. Weight incrementality by LTV to identify true value creation: Incremental Value = Incremental Conversions x LTV. This prevents optimizing for incremental volume at the expense of incremental value.
Key Takeaways
-
Platform-reported metrics overstate true marketing impact by 2-5x on average. Platforms have financial incentives to claim credit for conversions. Attribution measures correlation, not causation. Incrementality testing reveals which marketing actually causes conversions versus which captures existing demand.
-
Four primary methodologies enable incrementality measurement. Geographic experiments compare advertising versus non-advertising regions. Holdout tests exclude audience segments from campaigns. Platform lift studies use native randomization tools. Time-based toggles pause campaigns to measure impact. Each suits different contexts, budgets, and data environments.
-
Retargeting and brand search typically show the largest gaps between reported and incremental performance. Retargeting campaigns showing 800% ROAS often deliver 30-50% true incremental lift. Brand search claiming 500% ROAS may show 15-25% incrementality. These channels capture demand other channels created.
-
Prospecting channels often deliver higher incrementality than reported. Upper-funnel activities like social prospecting and non-brand search create demand that attribution credits to downstream closers. Incrementality testing reveals their true contribution, often justifying increased investment.
-
Sufficient sample size and test duration are non-negotiable. Reliable incrementality testing requires 400-600 conversions per group for meaningful results. Most tests need 4-8 weeks to accumulate sufficient data. Underpowered tests produce noisy results that fluctuate randomly.
-
Companies implementing incrementality measurement achieve 10-20% efficiency improvements. The gain comes from reallocating spend from low-incremental to high-incremental activities. On a $1 million marketing budget, that represents $100,000-$200,000 in value creation.
-
Build incrementality testing into ongoing operations. Single tests provide snapshots. Ongoing testing reveals how incrementality changes with market conditions, competitive dynamics, and business growth. Annual testing on major channels, with more frequent testing during significant changes, maintains measurement accuracy.
-
Incrementality complements rather than replaces attribution. Attribution guides within-channel optimization. Incrementality guides across-channel allocation. Use both together for complete measurement. Periodically validate attribution assumptions with incrementality ground truth.
Sources
- Harvard Business Review: The Short Life of Online Sales Leads - Research on lead response timing and conversion rate improvements for speed-to-contact
- Meta for Business: Conversion Lift - Platform documentation on Meta’s native incrementality measurement methodology
- Google Marketing Platform - Google’s approach to geographic incrementality testing and measurement tools
- Investopedia: Attribution in Marketing - Definitions of attribution models and their limitations in measuring true impact
- Nielsen: Marketing Mix Modeling - Industry research on marketing effectiveness measurement and incrementality benchmarks
- ActiveProspect - Lead verification and consent documentation platform referenced for compliance tracking
Methodologies and benchmarks based on industry research and practitioner experience current as of late 2025. Incrementality patterns vary by vertical, market position, brand strength, and competitive dynamics. Validate benchmarks against your specific context before making material investment decisions.