Accurate cost per lead data for auto, home, life, health, and Medicare insurance. Real pricing ranges, conversion metrics, and unit economics used by the industry’s top operators.
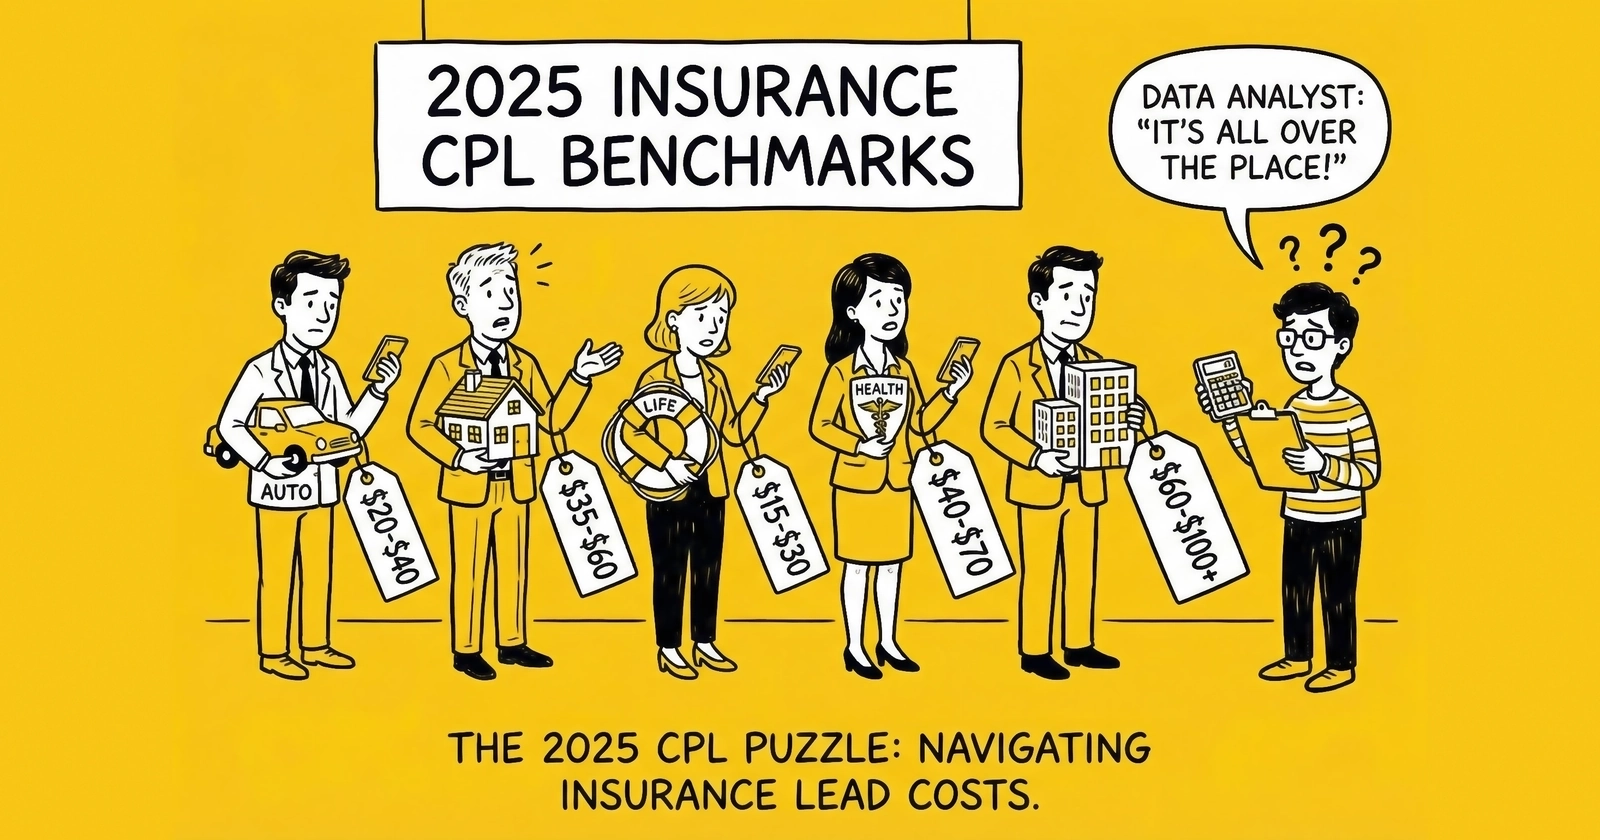
A broker calls offering Medicare leads at $35 each. Are they underselling quality or providing market value? Your competitor claims they pay $45 for auto insurance leads. Are they overpaying or accessing premium inventory you cannot reach? An affiliate network pitches health insurance leads at $120. Is that reasonable for ACA open enrollment or highway robbery?
These questions have answers. But finding accurate CPL benchmarks requires cutting through vendor marketing, outdated industry reports, and the deliberate opacity that serves those selling at inflated prices. This guide provides the real numbers – current 2025 pricing ranges across every major insurance sub-vertical, with the context necessary to understand what drives price variation.
Insurance leads represent the bellwether vertical of the lead generation industry. With an estimated $5.2-6.8 billion in annual transaction value, insurance sets the benchmarks for technology, compliance, and unit economics that ripple across mortgage, solar, legal, and home services. When Progressive spent $3.5 billion on advertising in 2024 – nearly tripling from $1.22 billion the prior year – they fueled an ecosystem that touches every corner of performance marketing.
Understanding CPL benchmarks by sub-vertical enables three critical capabilities: budget planning with realistic acquisition cost projections, performance evaluation against industry standards, and negotiation leverage when buying or selling leads. These benchmarks come from platform research, public company filings, operator experience, and industry intermediary data. Where figures conflict or uncertainty exists, the ranges reflect that reality.
How Insurance CPL Benchmarks Are Determined
Before examining specific sub-vertical pricing, understanding the factors that create CPL variation prevents misinterpreting the numbers.
Customer Lifetime Value Drives Acceptable CPL
Insurance carriers and agents calculate maximum acceptable lead prices based on customer lifetime value and conversion rates. A retained auto insurance customer generates $1,500-$3,000 in lifetime value across 3-5 policy years. A Medicare Advantage enrollment pays agents $600+ in first-year commission with ongoing renewal payments. A life insurance policy can generate $3,000-$10,000 in commission over its lifetime.
Higher LTV verticals support higher CPL. This explains why life insurance leads often cost more than auto insurance leads despite lower conversion rates – the math works because each converted customer generates substantially more revenue.
Conversion Rates Compress CPL Tolerance
Conversion rate directly determines cost per acquisition. A $50 lead converting at 10% yields $500 CPA. The same $50 lead converting at 5% yields $1,000 CPA. Buyers with strong sales operations, competitive products, and rapid response infrastructure tolerate higher CPL because their conversion rates justify it.
This creates pricing differentiation. The same lead might sell for $35 to a call center with 8% conversion and $55 to an agency achieving 15% conversion. Both buyers operate profitably at their respective price points.
Distribution Model Creates Price Tiers
Lead distribution model fundamentally shapes pricing:
Exclusive leads sell to exactly one buyer, eliminating competition for the prospect. Exclusive distribution commands 2-3x the pricing of shared leads. An auto insurance lead selling at $25 shared might sell for $60-80 exclusive.
Shared leads sell to 3-7 buyers simultaneously. Lower per-lead prices reflect competitive dynamics – multiple buyers race to contact the same consumer. Shared leads work for operations with call center infrastructure optimized for speed; they fail for agents who check leads periodically.
Live transfers connect consumers directly to agents while still engaged. Premium pricing ($100-200+) reflects near-certain contact and pre-qualification. Conversion rates of 15-25% often make live transfers the most cost-effective acquisition method despite highest nominal CPL.
Seasonality Shifts Pricing Windows
Insurance demand follows predictable seasonal patterns that shift CPL by 20-60% depending on vertical and timing:
- Medicare AEP (October 15-December 7) creates 40-60% CPL increases
- Auto insurance peaks in January with 15-25% premiums
- Health insurance concentrates during Open Enrollment (November-January)
- Home insurance follows real estate cycles with spring/summer peaks
sophisticated practitioners time campaigns to off-peak periods when possible, capturing volume at reduced CPL before seasonal spikes.
Auto Insurance Leads: The Largest Sub-Vertical
Auto insurance represents the highest-volume insurance lead sub-vertical, with an estimated $3-4 billion in annual transaction value. The combination of high shopping frequency, standardized quoting, and aggressive carrier spending creates consistent year-round demand.
Auto Insurance CPL Ranges
| Lead Type | CPL Range | Characteristics |
|---|---|---|
| Shared leads | $15-35 | Sold to 3-7 buyers; speed determines success |
| Exclusive leads | $40-100 | Single buyer; no competition for prospect |
| Live transfers | $100-200+ | Consumer on phone; pre-qualified; immediate engagement |
| Aged leads (30-90 days) | $3-15 | Reduced contact rates; systematic nurture required |
Understanding Auto Insurance Price Variation
Geography significantly affects auto insurance CPL. Coastal urban markets (California, Florida, New York) command 20-35% premiums over rural areas. State regulatory environments, competition density, and average premium levels all contribute to geographic variation.
Driver demographics create additional price tiers. Leads for preferred risks (clean records, good credit, multiple vehicles) command premium pricing. Non-standard leads (young drivers, accidents, DUIs) price lower but require specialized carrier relationships.
The $40-100 exclusive range reflects quality differentiation. A $40 exclusive lead might include basic verification and slightly delayed delivery. A $100 exclusive lead typically includes real-time API delivery, TrustedForm certification, verified contact information, and enhanced demographic filtering.
Auto Insurance Conversion Benchmarks
| Metric | Shared Leads | Exclusive Leads | Live Transfers |
|---|---|---|---|
| Contact rate | 45-55% | 50-60% | Near certain |
| Conversion rate (of contacts) | 8-12% | 12-15% | 15-25% |
| Overall lead-to-sale | 4-7% | 6-9% | 15-25% |
Speed-to-contact determines success in auto insurance more than almost any other factor. Research shows leads contacted within one minute convert 391% higher. For shared leads, 78% of customers buy from the first responder – making call center infrastructure and real-time delivery essential.
Auto Insurance Unit Economics Example
Consider an agency purchasing 100 auto insurance leads monthly:
Shared Lead Scenario ($25/lead):
- 100 leads at $25 = $2,500 spend
- 50% contact rate = 50 conversations
- 10% conversion = 5 sales
- Cost per sale: $500
- Customer LTV: $2,000
- ROI: 4:1
Exclusive Lead Scenario ($70/lead):
- 100 leads at $70 = $7,000 spend
- 55% contact rate = 55 conversations
- 14% conversion = 7.7 sales
- Cost per sale: $909
- Customer LTV: $2,000
- ROI: 2.2:1
The exclusive model produces more sales but at higher cost per acquisition. The optimal choice depends on capacity constraints, capital availability, and speed-to-contact capabilities.
Home Insurance Leads: Bundling Economics
Home insurance operates at lower volumes than auto but with higher average lead values. The close connection to real estate transactions creates seasonal patterns and geographic concentration distinct from auto.
Home Insurance CPL Ranges
| Lead Type | CPL Range | Characteristics |
|---|---|---|
| Shared leads | $20-50 | Tied to home purchase or policy renewal |
| Exclusive leads | $50-120 | Single carrier/agent; qualification depth varies |
| Live transfers | $100-175 | Pre-qualified homeowner on phone |
| Aged leads (30-90 days) | $5-20 | Value depends on original lead quality |
Bundling Premium and Cross-Sell Opportunity
Home insurance leads carry implicit cross-sell value. Carriers pursuing “Robinson” households – families with both auto and home coverage – pay premium pricing for home leads from verified homeowners. The bundling opportunity adds 40-60% to customer lifetime value, justifying higher acquisition costs.
Lead forms that capture vehicle information alongside home data command premiums. A home insurance lead that includes auto policy expiration dates, current carrier, and vehicle count may sell for 25-40% above base pricing due to bundle potential.
Geographic and Seasonal Factors
Home insurance CPL varies dramatically by geography:
| Region | CPL Index | Factors |
|---|---|---|
| Coastal Florida | 125-140 | Hurricane exposure; limited carrier appetite |
| California | 130-150 | Fire risk; regulatory environment |
| Texas | 100-115 | Large market; storm exposure |
| Midwest | 85-100 | Lower premium levels; less competition |
Hurricane season (June-November) creates regional CPL spikes as carriers adjust capacity. Coastal market leads may become unavailable entirely during active storm periods as carriers restrict new business.
Spring and summer home-buying seasons increase lead demand and pricing by 15-25% compared to winter lulls.
Home Insurance Conversion Benchmarks
| Metric | Typical Range |
|---|---|
| Contact rate | 40-50% |
| Conversion rate (of contacts) | 7-10% |
| Overall lead-to-sale | 3-5% |
Lower contact rates compared to auto reflect the less urgent nature of home insurance shopping. Many leads originate from real estate transaction processes where timing is determined by closing schedules rather than immediate need.
Life Insurance Leads: Longer Sales Cycles, Higher Lifetime Value
Life insurance presents different dynamics than property and casualty lines. Longer sales cycles, complex underwriting, and the uncomfortable nature of discussing mortality create lower conversion rates but potentially substantial lifetime value per customer.
Life Insurance CPL Ranges
| Lead Type | CPL Range | Characteristics |
|---|---|---|
| Term life (shared) | $25-55 | General interest; qualification varies |
| Term life (exclusive) | $50-125 | Higher quality; specific coverage interest |
| Final expense | $30-70 | Senior demographic; smaller policy amounts |
| Whole/Universal life | $75-200 | Higher premium products; wealth indicators |
| Live transfers | $100-250+ | Pre-qualified; immediate conversation |
Understanding Life Insurance CPL Drivers
Life insurance CPL reflects the fundamental tension between acquisition cost and lifetime value. A term life policy might generate $500-$1,500 in first-year commission with renewal payments continuing for decades. A whole life or universal life policy can generate $3,000-$10,000 in commission over its lifetime.
Higher-premium product leads (whole life, indexed universal life) command premium CPL because each sale generates substantially more revenue. Leads indicating high income, substantial assets, or specific estate planning needs price at the upper end of ranges.
Final expense insurance – targeting seniors for burial cost coverage – operates as a distinct segment. Lower policy values ($5,000-$25,000) compress acceptable CPL, but simpler underwriting and shorter sales cycles improve conversion economics.
Life Insurance Qualification Factors
Life insurance leads derive value from qualification depth:
Basic Qualification (Lower CPL):
- Age and general health status
- Coverage interest (term vs. permanent)
- Contact information verification
Enhanced Qualification (Higher CPL):
- Income and asset indicators
- Existing coverage amounts
- Specific coverage needs documented
- Health history pre-qualification
- Timeline and purchase readiness
Leads with health history pre-qualification enable faster underwriting and reduce policy decline rates. This efficiency justifies 30-50% CPL premiums.
Life Insurance Conversion Benchmarks
| Metric | Term Life | Final Expense | Whole/UL Life |
|---|---|---|---|
| Contact rate | 35-45% | 35-40% | 30-40% |
| Conversion rate | 5-8% | 6-10% | 3-6% |
| Average policy value | $250-500k | $10-25k | $100k-$1M+ |
| Commission per sale | $500-1,500 | $300-800 | $2,000-10,000+ |
Lower conversion rates reflect longer consideration periods. Life insurance purchases often follow major life events (marriage, children, home purchase) and may require multiple conversations across weeks or months.
Health Insurance Leads: ACA and Under-65 Markets
Health insurance for consumers under 65 operates under the Affordable Care Act framework, creating unique seasonal patterns and regulatory considerations distinct from Medicare.
Health Insurance (ACA) CPL Ranges
| Lead Type | CPL Range | Characteristics |
|---|---|---|
| Shared leads (off-season) | $25-50 | Limited enrollment options; SEP-qualified |
| Shared leads (OEP) | $40-80 | Open Enrollment surge pricing |
| Exclusive leads | $60-150 | Single broker/carrier; higher qualification |
| Subsidy-eligible leads | $50-100 | APTC-qualified; premium segment |
| Live transfers | $80-175 | Pre-qualified; immediate enrollment discussion |
Open Enrollment Period Dynamics
The ACA Open Enrollment Period (typically November 1 - January 15, though dates vary by state) concentrates 60-70% of annual health insurance lead demand into a compressed window. This creates significant CPL variation:
| Period | CPL Impact | Notes |
|---|---|---|
| Pre-OEP (September-October) | Baseline | Lead-up marketing; limited enrollment activity |
| Early OEP (November) | +20-35% | Surge demand; carrier budgets flush |
| Peak OEP (December) | +30-50% | Highest demand concentration |
| Late OEP (January) | +15-25% | Trailing demand; budget constraints |
| Off-season (February-October) | -10-20% below OEP | SEP-only; limited carrier appetite |
Special Enrollment Period (SEP) Leads
Outside Open Enrollment, health insurance leads require Special Enrollment Period qualification. Qualifying life events include:
- Loss of other coverage (job change, aging off parents’ plan)
- Marriage or divorce
- Birth or adoption of a child
- Permanent address change to new coverage area
- Income changes affecting subsidy eligibility
SEP leads maintain year-round value but require proper qualification documentation. Forms must capture qualifying event details with sufficient specificity for enrollment verification.
Subsidy Eligibility Premium
Leads indicating subsidy eligibility (income 100-400% of federal poverty level) command 15-30% premiums. Subsidy-eligible consumers can enroll in plans with $0 premiums after Advanced Premium Tax Credit application, creating high conversion potential.
Health Insurance Conversion Benchmarks
| Metric | OEP Period | Off-Season (SEP) |
|---|---|---|
| Contact rate | 35-45% | 30-40% |
| Conversion rate | 8-12% | 5-8% |
| Average commission | $300-600 | $300-600 |
The relatively short sales cycle during OEP (consumers must decide before enrollment deadline) creates urgency that improves conversion rates compared to off-season SEP leads with less time pressure.
Medicare Leads: The Most Regulated, Highest-Value Segment
Medicare represents the most heavily regulated insurance lead vertical, with CMS marketing rules that exceed standard TCPA requirements. The combination of regulatory complexity, senior demographic considerations, and substantial commission values creates unique economics.
Medicare Lead CPL Ranges
| Lead Type | Off-Season CPL | AEP CPL | OEP CPL |
|---|---|---|---|
| Medicare Advantage (shared) | $30-50 | $50-80 | $40-65 |
| Medicare Advantage (exclusive) | $45-70 | $75-125 | $55-90 |
| Medicare Supplement (Medigap) | $40-75 | $60-100 | $50-80 |
| Part D (prescription drug) | $20-40 | $35-55 | $25-45 |
| T65 (Turning 65) | $60-100 | $90-150 | $70-110 |
| Live transfers | $75-150 | $125-200+ | $100-175 |
Enrollment Period Economics
Medicare’s enrollment calendar creates the most pronounced seasonal pricing in insurance lead generation:
Annual Enrollment Period (AEP): October 15 - December 7
The 54-day AEP window accounts for approximately 60-70% of annual Medicare lead volume. During this period, beneficiaries can switch Medicare Advantage plans, change prescription drug coverage, or transition between Original Medicare and Medicare Advantage.
Lead prices spike 40-60% above off-season levels. A Medicare Advantage lead selling at $45 during summer months may command $75-100 during AEP. The economics justify the premium: Medicare Advantage plans pay agents $600+ for initial enrollments with renewal commissions continuing annually.
Open Enrollment Period (OEP): January 1 - March 31
The OEP provides a secondary opportunity with different characteristics. Only Medicare Advantage enrollees can make changes during OEP – those on Original Medicare with standalone Part D cannot switch during this window.
Lead pricing during OEP typically runs 50-75% of AEP levels, reflecting both reduced demand and smaller eligible population. Consumers switching during OEP often have higher purchase intent – they are making active changes to coverage that proved unsatisfactory.
Special Enrollment Periods (SEPs): Year-Round
Outside AEP and OEP, Medicare leads come from Special Enrollment Periods triggered by qualifying life events: moving to a new service area, losing employer coverage, qualifying for Medicaid, or experiencing plan-level changes.
SEP leads maintain relatively consistent pricing year-round at $40-70 for quality exclusive leads, but volume is inherently limited by the frequency of qualifying events.
T65 (Turning 65) Premium Segment
T65 leads – people approaching their 65th birthday – represent the premium segment of Medicare lead generation. These beneficiaries are making Medicare decisions for the first time and have guaranteed-issue rights for Medicare Supplement policies.
T65 premium pricing ($60-150) reflects higher value: first-time decisions (more receptive to guidance), guaranteed-issue Medigap rights (no health underwriting barriers), longer customer lifetimes, and multiple product opportunities (MA, Medigap, Part D, ancillary coverage).
CMS Compliance Impact on Pricing
CMS one-to-one consent requirements fundamentally affect Medicare lead economics. Unlike auto or home insurance where shared leads are standard, Medicare requires beneficiaries to grant explicit consent to be contacted by specific plan sponsors.
This regulatory structure restricts traditional shared lead models in Medicare. Compliant approaches include:
- Exclusive leads with named plan sponsor disclosure
- Consumer-selection comparison models (beneficiary chooses which plans to hear from)
- Separate consent capture for each potential buyer
The compliance burden creates barriers to entry that protect established operators but also increases operational costs reflected in CPL.
Medicare Conversion Benchmarks
| Metric | Medicare Advantage | Medicare Supplement | Live Transfers |
|---|---|---|---|
| Contact rate | 35-45% | 35-45% | Near certain |
| Conversion rate | 6-10% | 5-8% | 12-18% |
| Commission (initial) | $600+ | $400-800 | Varies |
Lower contact rates compared to auto insurance reflect senior communication preferences and higher screening behavior. Phone remains the dominant sales channel – research shows 62-83% of seniors prefer phone contact over digital communication.
Commercial Insurance Leads: B2B Economics
Commercial insurance operates with fundamentally different economics than personal lines. Longer sales cycles, larger policy premiums, and business buyer dynamics create distinct CPL structures.
Commercial Insurance CPL Ranges
| Lead Type | CPL Range | Characteristics |
|---|---|---|
| General liability | $75-200 | Small business focus; broad targeting |
| Workers compensation | $100-300 | Employee count and industry affect pricing |
| Commercial auto | $60-175 | Fleet size and driver count matter |
| Professional liability | $125-350 | Industry-specific; higher qualification |
| Commercial package | $150-400 | Multi-line opportunities; larger accounts |
| Live transfers | $175-400+ | Pre-qualified decision-maker on phone |
B2B Lead Quality Factors
Commercial insurance leads derive value from business qualification:
Basic Qualification:
- Business type and industry
- Employee count range
- Basic contact information
Enhanced Qualification (Premium Pricing):
- Specific coverage needs identified
- Current policy expiration dates
- Premium spend ranges
- Decision-maker verification
- Industry classification (NAICS/SIC)
- Loss history indicators
Decision-maker access fundamentally affects commercial lead value. A lead connecting directly to a business owner or CFO prices 30-50% above leads reaching general inquiries or office managers.
Commercial Insurance Conversion Benchmarks
| Metric | Small Commercial | Mid-Market | Large Accounts |
|---|---|---|---|
| Contact rate | 30-40% | 25-35% | 20-30% |
| Conversion rate | 3-6% | 2-5% | 1-3% |
| Average premium | $5,000-25,000 | $25,000-100,000 | $100,000+ |
| Sales cycle | 2-4 weeks | 4-8 weeks | 8-24 weeks |
Longer sales cycles and lower conversion rates are offset by substantially higher premium values. A 3% conversion rate on $150 leads with $15,000 average premium generates $5,000 cost per acquisition against $2,500+ first-year commission – workable economics despite surface-level CPL appearing high.
Factors That Affect Your Specific CPL
Industry benchmarks provide context, but your specific CPL depends on multiple variables within your control.
Lead Quality and Filtering
Basic leads with minimal qualification price lower but convert at reduced rates. Enhanced filtering – credit tier, property value, current coverage status – increases CPL but often improves unit economics through higher conversion.
| Filter Type | CPL Impact | Conversion Impact |
|---|---|---|
| Geographic targeting | +5-20% | +10-30% |
| Credit score filtering | +10-25% | +20-40% |
| Current coverage verification | +15-30% | +25-50% |
| Real-time delivery | +10-20% | +30-50% |
| TrustedForm certification | +5-15% | Reduces legal risk |
Distribution Model Selection
Your distribution model choice significantly affects both CPL and conversion economics:
| Model | CPL Level | Competition | Best For |
|---|---|---|---|
| Shared (5+ buyers) | Lowest | Highest | Call centers with speed advantage |
| Semi-exclusive (2-3 buyers) | Moderate | Moderate | Balanced operations |
| Exclusive | Highest | None | Relationship-focused agents |
| Live transfer | Premium | None | High-conversion, limited capacity |
Speed-to-Contact Infrastructure
Your ability to respond quickly should influence CPL tolerance. Operations capable of sub-minute response can profitably work shared leads where slower operations cannot. If your response time averages 10+ minutes, exclusive or live transfer leads may prove more economical despite higher nominal CPL.
Volume and Relationship Leverage
Higher volume creates pricing leverage. A buyer purchasing 5,000 leads monthly negotiates better rates than one purchasing 500. Established relationships with multiple performance cycles provide additional leverage – sellers offer preferred pricing to reliable, predictable buyers.
Calculating Your Target CPL
Your acceptable CPL depends on downstream economics, not industry benchmarks alone.
The Buyer’s Math
Maximum CPL = Customer LTV x Conversion Rate x Target ROI Factor
Example for auto insurance:
- Customer LTV: $2,400 (4-year retention at $600 annual premium)
- Lead-to-customer conversion: 5%
- Target 3:1 LTV-to-CAC ratio
Maximum CPL = $2,400 x 0.05 x 0.33 = $39.60
This buyer can pay up to $40 per lead and maintain target economics.
True CPL vs. Dashboard CPL
Dashboard CPL measures media spend divided by leads generated. True CPL includes all costs:
| Hidden Cost | Per-Lead Impact |
|---|---|
| Returns/refunds | 8-15% of CPL |
| Compliance (TrustedForm, validation) | $0.25-0.75 |
| Platform fees | $0.10-0.50 |
| Processing and labor | $0.50-2.00 |
| Float cost (working capital) | $0.10-0.50 |
A $50 dashboard CPL often translates to $65-80 true CPL when all costs are allocated. Plan budgets on true CPL, not dashboard metrics.
Insurance Lead CPL Benchmarks Summary Table
This comprehensive table summarizes CPL benchmarks across all insurance sub-verticals for 2025:
| Sub-Vertical | Shared CPL | Exclusive CPL | Live Transfer | Aged (30-90 days) |
|---|---|---|---|---|
| Auto Insurance | $15-35 | $40-100 | $100-200 | $3-15 |
| Home Insurance | $20-50 | $50-120 | $100-175 | $5-20 |
| Life (Term) | $25-55 | $50-125 | $100-250 | $8-25 |
| Life (Final Expense) | $30-50 | $45-70 | $75-150 | $8-20 |
| Life (Whole/UL) | $50-100 | $75-200 | $150-300 | $15-40 |
| Health (ACA OEP) | $40-80 | $60-150 | $80-175 | $10-30 |
| Health (ACA Off-Season) | $25-50 | $50-100 | $65-125 | $8-20 |
| Medicare Advantage (AEP) | $50-80 | $75-125 | $125-200 | $15-35 |
| Medicare Advantage (Off-Season) | $30-50 | $45-70 | $75-150 | $10-25 |
| Medicare Supplement | $40-75 | $60-100 | $100-175 | $12-30 |
| Medicare T65 | N/A | $60-150 | $125-200 | $20-50 |
| Commercial (Small) | $50-125 | $75-200 | $175-300 | $15-40 |
| Commercial (Mid-Market) | $100-200 | $150-350 | $250-400 | $25-60 |
These ranges represent 2025 pricing through established intermediaries. Actual pricing varies based on geography, qualification depth, seasonality, and buyer relationships.
Frequently Asked Questions
What is the average cost per lead for auto insurance in 2025?
Auto insurance lead pricing ranges from $15-100+ depending on distribution model and quality filters. Shared leads average $15-35, exclusive leads $40-100, and live transfers $100-200+. Pricing varies by geography, driver demographics, and carrier advertising cycles. The 2024 carrier spending surge (Progressive nearly tripled to $3.5 billion) created exceptional demand that continued into 2025, supporting prices at the higher end of historical ranges.
Why do Medicare leads cost more during AEP?
The Annual Enrollment Period (October 15-December 7) concentrates 60-70% of annual Medicare lead demand into 54 days. Carriers and agents aggressively compete for volume during this window because beneficiaries can switch Medicare Advantage plans or change Part D coverage. This compressed demand pushes CPL 40-60% above off-season levels. A Medicare Advantage lead selling at $45 during summer months may command $75-100 during AEP.
How do exclusive leads compare to shared leads on cost per acquisition?
Exclusive leads cost 2-3x more than shared leads but typically convert 50-100% higher. The cost-per-acquisition calculation often favors exclusive distribution despite higher nominal CPL. Example: Shared leads at $25 with 5% conversion yield $500 CPA. Exclusive leads at $70 with 10% conversion yield $700 CPA – 28% higher per acquisition but producing 100% more sales from the same lead volume. The optimal choice depends on capacity constraints and speed-to-contact capabilities.
What factors increase or decrease insurance lead CPL?
Key factors affecting CPL include: geographic targeting (coastal/urban markets cost 20-35% more than rural), demographic filtering (credit score, age, property value filters add 10-30%), distribution model (exclusive costs 2-3x shared; live transfers cost 3-5x shared), seasonality (enrollment periods add 20-60%), qualification depth (enhanced fields add 15-30%), and real-time delivery (adds 10-20% over delayed delivery). Higher CPL often delivers better unit economics through improved conversion rates.
What conversion rates should I expect for insurance leads?
Insurance lead conversion benchmarks vary by sub-vertical and lead type. Auto insurance: 45-55% contact rates, 8-12% conversion of contacts (4-7% overall). Home insurance: 40-50% contact, 7-10% conversion (3-5% overall). Life insurance: 35-45% contact, 5-8% conversion (2-4% overall). Medicare: 35-45% contact, 6-10% conversion (2-4% overall). Live transfers convert at 15-25% because the consumer is already engaged. Speed-to-contact dramatically affects these numbers – leads contacted within one minute convert 391% higher.
How do I calculate if an insurance lead price is profitable?
Calculate maximum acceptable CPL using: Maximum CPL = Customer LTV x Conversion Rate x Target ROI Factor. For auto insurance with $2,400 LTV, 5% conversion, and target 3:1 LTV-to-CAC ratio: Maximum CPL = $2,400 x 0.05 x 0.33 = $39.60. If leads cost less than this threshold, acquisition is profitable at target returns. Remember to calculate true CPL including returns (8-15%), compliance costs ($0.25-0.75), and processing ($0.50-2.00) rather than using dashboard CPL alone.
Are live transfer insurance leads worth the premium price?
Live transfers typically cost $100-250+ compared to $25-80 for data leads, but conversion rates are often 3-5x higher. A $125 live transfer converting at 18% delivers $694 cost-per-acquisition. A $45 data lead converting at 4% delivers $1,125 cost-per-acquisition. The math often favors live transfers despite higher per-lead cost. Live transfers work best for operations with limited capacity and high close rates; data leads work better for high-volume operations with call center infrastructure.
How does carrier advertising spending affect insurance lead CPL?
Carrier advertising budgets directly determine market demand and pricing. When carriers invest aggressively (as Progressive did with $3.5 billion in 2024, up from $1.22 billion in 2023), lead prices rise and inventory sells quickly. When carriers pull back during hard insurance markets with underwriting losses, prices compress. Sophisticated practitioners track carrier combined ratios and quarterly earnings to anticipate market shifts. Combined ratios below 100% indicate profitability and potential advertising expansion; ratios above 100% signal future pullbacks.
What compliance requirements affect insurance lead pricing?
TCPA compliance costs ($0.15-0.50 per lead for TrustedForm/Jornaya certificates) add to effective CPL across all verticals. Medicare faces additional CMS requirements including one-to-one consent (restricting shared lead models), Scope of Appointment rules, and prohibited marketing practices with Civil Monetary Penalties exceeding $100,000 per violation. State insurance regulations vary by jurisdiction, with some states requiring specific disclosures or restricting certain lead generation practices. Compliance infrastructure represents a fixed cost that creates barriers to entry but also protects established operators.
How do I negotiate better insurance lead pricing?
Negotiation leverage comes from volume commitments (5,000+ leads monthly creates 10-20% pricing advantage), performance track record (low return rates, consistent volume, reliable payment), multi-month agreements (quarterly or annual commitments versus month-to-month), and buyer diversification (not being dependent on a single supplier). Understand seller economics: leads that sit unsold lose value rapidly, creating motivation for volume-based discounts. Track source-level performance to demonstrate which suppliers deliver genuine value versus those whose leads underperform.
What is the difference between dashboard CPL and true CPL?
Dashboard CPL measures media spend divided by leads generated. True CPL includes all costs between lead capture and revenue collection: returns/refunds (8-15% of CPL), compliance documentation ($0.25-0.75 per lead), validation services ($0.05-0.25), platform fees ($0.10-0.50), labor allocation ($0.50-2.00), and float cost ($0.10-0.50). A $50 dashboard CPL typically translates to $65-80 true CPL. Planning budgets on dashboard CPL leads to margin erosion; accurate financial modeling requires true CPL calculation.
Key Takeaways
-
Insurance lead CPL ranges from $15 for shared auto insurance leads to $400+ for commercial live transfers, with sub-vertical, distribution model, and seasonality creating systematic price variation. Understanding these factors prevents overpaying for leads and enables effective negotiation.
-
Exclusive leads cost 2-3x more than shared leads but convert 50-100% higher, often delivering better cost-per-acquisition despite higher nominal CPL. The optimal distribution model depends on your speed-to-contact capabilities and sales infrastructure.
-
Medicare AEP creates the most dramatic seasonal pricing swing, with CPL increasing 40-60% during the October 15-December 7 enrollment window. CMS one-to-one consent requirements restrict shared lead models, making Medicare economics fundamentally different from auto or home insurance.
-
Speed-to-contact determines success more than CPL optimization. Leads contacted within one minute convert 391% higher. Investment in response infrastructure often delivers better ROI than equivalent spend on CPL reduction.
-
True CPL exceeds dashboard CPL by 30-60% when returns, compliance, validation, and processing costs are included. Budget planning based on dashboard CPL creates margin erosion; accurate financial modeling requires true CPL calculation.
-
Carrier advertising cycles drive market-wide CPL trends. When Progressive nearly tripled ad spend to $3.5 billion in 2024, lead demand and pricing surged across the ecosystem. Monitoring carrier combined ratios and earnings commentary provides leading indicators for market conditions.
-
Live transfers often deliver the best unit economics despite highest nominal CPL. A $125 live transfer converting at 18% yields lower cost-per-acquisition than a $45 data lead converting at 4%. The decision depends on conversion capabilities and capacity constraints.
-
Geographic, demographic, and qualification filtering increases CPL but often improves overall economics through higher conversion rates. A $70 lead converting at 12% outperforms a $35 lead converting at 4% on cost-per-sale basis despite 100% higher CPL.
Sources
- MediaAlpha Investor Relations - Publicly traded insurance lead exchange reporting transaction volumes and pricing trends
- Allstate Investors - Major carrier financial disclosures and advertising spend data including Progressive’s $3.5B spend
- Insurance Information Institute - Industry statistics on insurance market size and carrier operations
- CMS Medicare Marketing Guidelines - Federal regulations governing Medicare lead generation and enrollment periods
- Kaiser Family Foundation Medicare - Research and statistics on Medicare enrollment, beneficiary demographics, and plan penetration
- Harvard Business Review: The Short Life of Online Sales Leads - Research on lead response timing and conversion rate improvements
CPL benchmarks current as of 2025. Pricing ranges represent market conditions through established intermediaries including MediaAlpha, EverQuote, and comparable platforms. Individual results vary based on geography, qualification depth, buyer relationships, and market timing. Verify current pricing with suppliers before making significant purchasing decisions.