The operational blueprint for structuring services, pricing models, and client relationships that create sustainable agency economics.
Introduction: What Separates Profitable Agencies from Struggling Ones
Every week, someone launches a lead generation agency. Most fail within 18 months. The difference between agencies that build sustainable wealth and those that burn through capital isn’t traffic expertise or buyer connections alone. It’s the ability to structure services and pricing in ways that align incentives, protect margins, and create long-term client value.
This guide covers the operational reality of agency service design and pricing strategy. Not the pitch deck version where everything works perfectly, but the version where clients demand discounts, campaigns underperform for weeks before optimizing, and cash flow timing threatens to sink profitable-on-paper operations.
The lead generation agency model works. Public companies like MediaAlpha process over $1.5 billion in annual transaction value. EverQuote exceeded $500.2 million in 2024 revenue. Thousands of smaller companies build profitable businesses connecting consumer intent with companies ready to pay for that intent. But success requires understanding the mechanics of service delivery and pricing that create sustainable economics, not just the ability to generate leads.
If you finish this guide and restructure your service offerings, you’ll have a framework built on how successful agencies actually operate. If you’re just starting, you’ll avoid the pricing mistakes that destroy margins before you even realize what went wrong.
Core Services Lead Generation Agencies Offer
Lead generation agencies typically offer services across a spectrum from pure performance delivery to managed campaign execution. Understanding where you fit on this spectrum shapes everything else – your pricing, your client relationships, your operational requirements, and your risk profile.
Performance Lead Generation
The foundational service involves generating leads and delivering them to clients at a fixed price per lead. This is the purest form of lead generation agency work, and within it, several distinct models exist.
Exclusive Leads
With exclusive leads, the consumer’s information goes to exactly one client, who has the sole opportunity to convert them. Pricing typically ranges from $50 to over $200 depending on the vertical, reflecting the premium value of unshared access. Clients paying exclusive rates expect higher contact rates since there’s no competition for the prospect’s attention, and conversion rates tend to follow. Your economics benefit from higher revenue per lead, though you need quality buyers willing to pay premium prices. The risk profile is moderate – if your exclusive buyer churns or reduces volume, that excess inventory has no immediate home.
Shared Leads
Shared leads go to multiple buyers, typically three to five in the same vertical. Each buyer knows the lead is being distributed to competitors. Pricing runs lower at $15 to $50 per lead to each buyer, but your total revenue per lead often reaches $45 to $150 when sold across multiple buyers. This model requires complete transparency about the sharing arrangement, but delivers lower risk since multiple buyers provide volume absorption and revenue diversification.
Real-Time Leads
The gold standard for most verticals involves delivering leads within seconds of consumer submission. This commands a premium of 20 to 50 percent over non-real-time delivery. Clients expect immediate delivery and high contact rates. You’ll need robust technology infrastructure to support this, but the premium pricing justifies the investment. The primary risk is technology dependency – system downtime directly impacts revenue.
Live Transfer Services
Live transfers create real-time phone connections between interested consumers and client sales agents. The consumer is already on the phone, pre-qualified, and ready to talk. These eliminate the buyer’s largest cost: speed-to-contact and qualification labor. Research on the lead decay curve shows leads contacted within one minute have 391% higher conversion rates. Live transfers deliver consumers already in conversation.
Inbound Transfers
When consumers call your number from ads, content, or call-back requests, your agents qualify them, then transfer to client sales teams. Pricing typically runs $50 to $200 per successful transfer. Clients expect qualified prospects who meet basic criteria, already warmed up for conversation. You’ll need call center infrastructure, trained agents, and telephony systems to deliver this service. The risk is high – TCPA compliance requirements apply to every call, and labor management presents ongoing challenges.
Outbound Transfers
Your agents call leads you’ve generated, qualify them, then transfer to client sales teams when interest is confirmed. Pricing is higher at $75 to $300 or more per transfer, reflecting the additional outbound effort required. Clients receive pre-qualified prospects actively engaged in conversation. This combines lead generation and call center operations, creating the highest risk profile due to TCPA exposure on outbound calling and complex consent requirements.
Appointment Setting
Appointment setting delivers qualified leads with scheduled appointments. Your team generates the lead, makes contact, qualifies interest, and books a specific time for the client’s sales team. Pricing ranges from $100 to over $500 per scheduled appointment that holds. Clients expect prospects who show up, or at least were genuinely interested when scheduled. This offers the highest value per lead but requires significant labor and process investment. No-show rates directly impact profitability, with industry averages running 20 to 30 percent.
Campaign Management Services
Beyond pure performance delivery, many agencies offer managed services where they handle campaign execution on behalf of clients.
Paid Media Management
Running advertising campaigns on Google, Facebook, TikTok, and other platforms on behalf of clients generates leads for their business while creating recurring revenue for yours. Pricing typically combines a management fee of 10 to 20 percent of ad spend with performance fees or markup. Clients expect professional campaign optimization, regular reporting, and continuous improvement. You’re responsible for campaign performance, and client attribution expectations can create tension – they see what you spend and question what you produce.
Landing Page Development and Optimization
Creating and testing lead capture pages that convert traffic into leads commands $2,500 to $15,000 per page development, plus ongoing optimization retainers. Clients expect high-converting pages with mobile optimization and compliance-ready forms. The project revenue creates opportunities for ongoing optimization fees, though scope creep is common and revision cycles can extend indefinitely without careful management.
Conversion Rate Optimization
Systematic testing and improvement of lead capture experiences generates $3,000 to $10,000 per month in retainer fees, or project-based arrangements. Clients expect measurable improvement in conversion rates over time. This delivers recurring revenue with lower delivery intensity than campaign management, though results take time – clients may not see improvements for 60 to 90 days.
Value-Added Services
These services complement core lead generation and increase revenue per client relationship.
Lead Nurturing
Email and SMS sequences warm leads before delivery or re-engage aged leads that didn’t convert initially. Monthly pricing ranges from $500 to $2,500, or per-lead fees for nurturing sequences. Clients expect higher contact rates and improved conversion from nurtured leads. The relatively low marginal cost improves lead value for both parties.
Data Enhancement
Appending additional data points to leads – income estimates, property values, credit indicators – improves lead quality and routing precision. Per-lead pricing of $0.25 to $2.00 depends on data depth. Clients receive more complete lead profiles for better qualification, and your per-lead revenue grows with low marginal delivery cost.
Compliance Documentation
Providing consent certificates, call recordings, and audit trails beyond standard requirements protects clients from TCPA exposure and provides documentation for disputes. This is often included in lead pricing or offered as a $0.15 to $0.50 per lead add-on. Your cost is largely fixed through TrustedForm and Jornaya subscriptions, while revenue scales with volume.
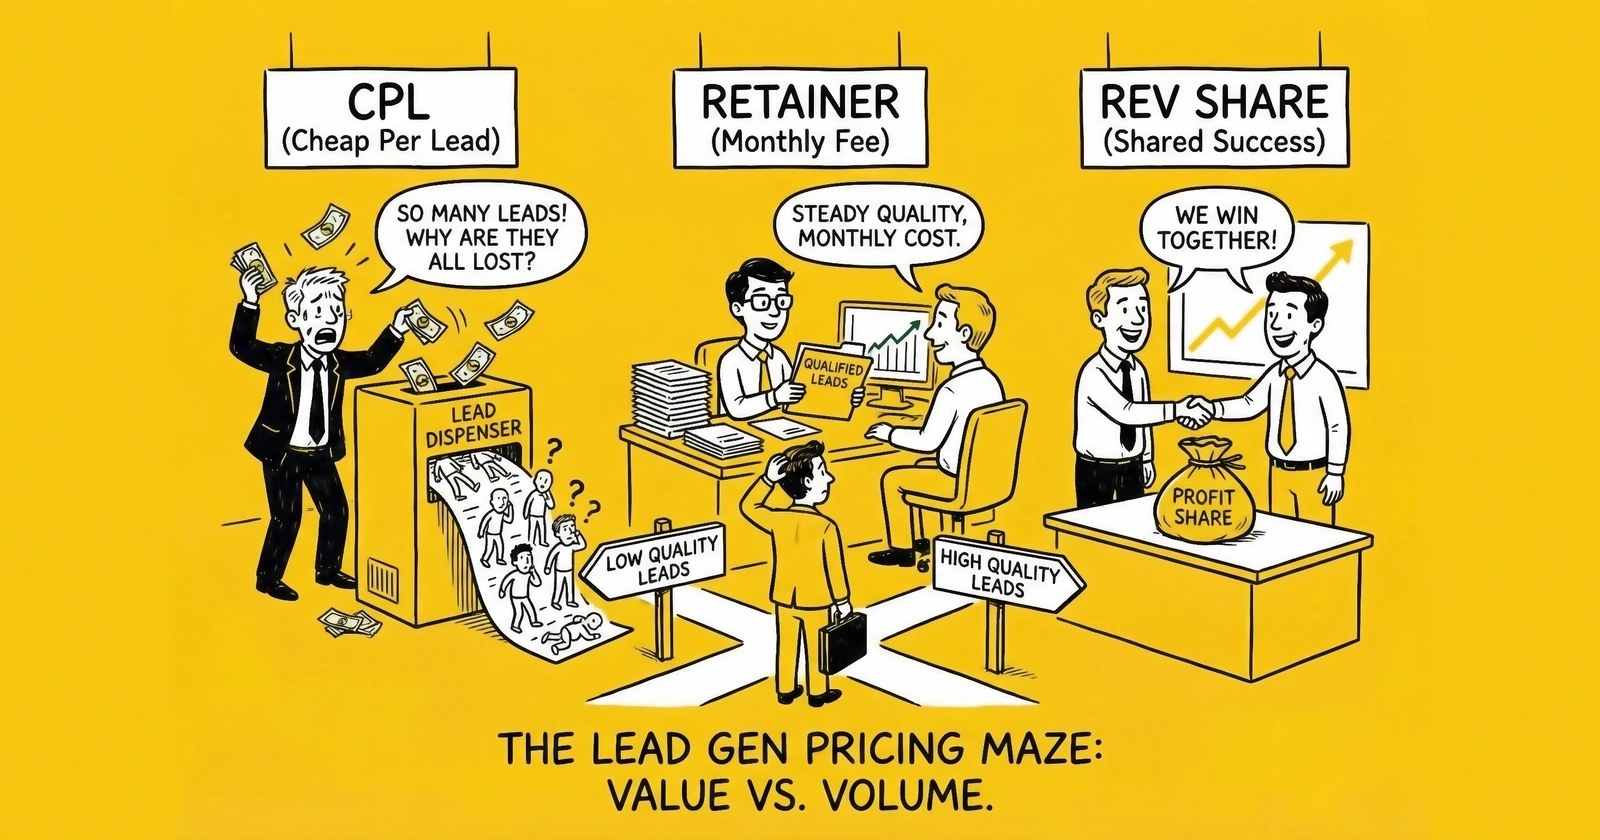
Pricing Models: How Agencies Structure Client Agreements
The pricing model you choose shapes your entire business. Each model has different risk profiles, cash flow characteristics, and client relationships. Most mature agencies use hybrid structures, but understanding the pure models illuminates the trade-offs.
Performance-Based Pricing (Cost Per Lead)
You charge a fixed price per qualified lead delivered. This is the dominant model in lead generation because it aligns incentives: clients pay for results, you earn based on performance.
The mechanics are straightforward. Clients agree to pay a set amount per lead meeting specified criteria. You generate leads, deliver them in real-time or batch, and invoice based on delivery volume minus returns.
Typical structures vary significantly by vertical:
| Vertical | Low CPL | Mid CPL | High CPL |
|---|---|---|---|
| Auto Insurance | $15 | $35 | $65 |
| Medicare | $25 | $50 | $90 |
| Solar | $30 | $75 | $175 |
| Home Services | $20 | $45 | $85 |
| Mortgage | $25 | $75 | $175 |
| Legal (PI) | $100 | $250 | $600+ |
Performance-based pricing aligns your incentives with client results since you only get paid when you deliver. The model scales naturally – more leads equals more revenue without renegotiating contracts. New clients find it easier to accept because they fear commitment without proof of performance, and the value proposition is crystal clear: clients know exactly what they’re paying per opportunity.
The disadvantages are equally clear. You absorb all traffic performance risk – if campaigns don’t convert, you lose money while generating nothing. Revenue becomes volatile with campaign performance, making a bad week translate directly to a bad revenue week. Cash flow forecasting becomes educated guessing, and you receive no compensation for strategy, optimization, or client service time.
This model works best when you have predictable traffic economics and proven ability to generate leads at costs below your CPL. For industry context, see our cost per lead benchmarks by industry. It fits new client relationships where trust hasn’t been established, and commodity verticals where clients can easily compare CPL across vendors.
Retainer-Based Pricing
Clients pay a monthly fee for your services, regardless of specific lead volume. This model provides predictability but shifts risk toward the client.
Under this structure, clients commit to a set amount per month for lead generation services. You commit to best efforts and agreed-upon service levels including campaign management, reporting, and optimization. Actual lead volume may vary but is expected to meet reasonable targets.
Typical structures scale with client size:
| Client Tier | Monthly Retainer | Expected Lead Volume | Effective CPL |
|---|---|---|---|
| Small Business | $3,000-$7,500 | 50-150 leads | $50-$60 |
| Mid-Market | $7,500-$25,000 | 150-500 leads | $50-$50 |
| Enterprise | $25,000-$100,000+ | 500-2,000+ leads | $50-$50 |
Predictable revenue means you know what’s coming each month. Cash flow improves since clients often pay in advance or on consistent schedules. Clients have skin in the game – committed spend increases engagement. The model also covers strategic and service time that pure CPL doesn’t compensate.
However, retainers are harder to sell because clients prefer putting performance risk on you. They create expectations of service beyond lead delivery, including reporting, strategy calls, and optimization. Scope creep becomes common without careful contracts – “I’m paying $10K per month, why can’t you also…” The model requires trust that takes time to build.
Retainer models work best with established client relationships where you’ve proven value. They’re appropriate when significant strategic or management work is required beyond lead delivery, and when clients have budget certainty needs, often the case with corporate or enterprise accounts.
Hybrid Pricing Models
Most mature agencies use hybrid structures that combine predictable base revenue with performance upside.
A retainer plus CPL arrangement has clients pay a monthly management fee plus per-lead costs. The retainer covers your operational overhead and service delivery while CPL reflects direct lead acquisition costs with margin. For example, a client might pay a $5,000 monthly management retainer plus $40 per delivered lead, with a minimum of 100 leads per month and no maximum. This protects your base operations while scaling revenue with performance.
Tiered CPL structures decrease the per-lead cost at volume thresholds, incentivizing clients to increase volume while protecting your margins at lower levels. A typical structure might charge $60 per lead for the first 100, dropping to $55 for leads 101 through 250, $50 for 251 through 500, and $45 for volumes above 500.
Performance bonuses combine a base CPL with additional compensation for leads that convert to sales, aligning incentives with ultimate client outcomes. A $50 base with an additional $25 bonus for each closed lead creates shared interest in quality. The client must provide conversion data for this to work.
Minimum commitments pair performance-based pricing with guaranteed monthly spend, protecting your revenue floor while maintaining performance alignment. A $50 CPL with a $10,000 monthly minimum ensures at least 200 leads worth of revenue, with unused commitment not rolling over.
Revenue Share Models
Revenue share arrangements give agencies a percentage of client revenue generated from leads. These are rare but powerful when trust and data sharing permit.
You generate leads, the client tracks conversions to sales, and you receive a percentage of revenue from converted customers. This requires robust attribution and a trust-based relationship. Examples include insurance agencies offering 10 to 15 percent of first-year premium on policies sold from your leads, solar installers paying $500 to $1,500 per installed system, and legal firms sharing 5 to 10 percent of settlements or judgments.
Maximum alignment means your success is literally client success. Significant upside potential exists since high-converting campaigns generate substantial returns. Client acceptance tends to be high since they only pay when they make money.
The challenges are substantial. You must trust the client’s conversion tracking completely. Payment cycles stretch long – you might wait 60 to 120 days or more to see revenue from lead generation. Complex attribution creates disputes about which leads generated which sales. Cash flow becomes nightmarish as you fund lead generation while waiting for client sales cycles to complete.
Revenue share works only with high-trust, long-term client relationships where you have visibility into their sales process. It’s most viable in verticals with fast, traceable conversion cycles like insurance quotes and mortgage applications, rather than long sales cycles common in enterprise software and complex B2B.
Calculating Your Pricing: The Math That Determines Survival
Pricing isn’t about what the market will bear or what competitors charge. It’s about understanding your costs and building sustainable margin. Get this wrong, and you’ll be profitable on paper while bleeding cash in reality.
Understanding Your True Cost Per Lead
Your cost per lead isn’t just traffic spend divided by leads generated. It’s every dollar that touches a lead from acquisition to delivery.
Direct costs on a per-lead basis break down across several categories:
| Cost Category | Typical Range | Example at $45 CPL |
|---|---|---|
| Traffic acquisition | 50-70% of CPL | $25.00 |
| Validation (phone, email) | $0.10-$0.30 | $0.20 |
| Compliance (TrustedForm) | $0.15-$0.50 | $0.35 |
| Platform fees | $0.10-$0.50 | $0.25 |
| Payment processing | 2.5-3% of revenue | $1.50 |
| Total Direct Cost | $27.30 |
Your fixed costs must also be covered by lead volume. Calculate overhead allocation based on monthly lead volume:
| Monthly Overhead | Cost | At 2,000 leads/month |
|---|---|---|
| Technology stack | $1,500 | $0.75/lead |
| Team salary allocation | $15,000 | $7.50/lead |
| Office/infrastructure | $2,000 | $1.00/lead |
| Insurance, legal, accounting | $1,500 | $0.75/lead |
| Total Overhead | $20,000 | $10.00/lead |
Combining direct costs of $27.30 with overhead allocation of $10.00 gives you a true cost per lead of $37.30. If you’re selling at $45 CPL, your actual margin is $7.70 per lead at 17 percent – not the $17.70 at 39 percent you might calculate by only considering traffic costs.
The Hidden Costs That Destroy Margins
Beyond direct and overhead costs, several factors erode margins that new agencies consistently underestimate.
Return rates run 8 to 15 percent industry-wide depending on vertical and quality. Every returned lead is revenue reversed plus the cost you already incurred to generate it. At a 12 percent return rate on $45 leads with direct costs of $27.30, the return rate adjustment adds $3.28 in average loss per lead sold, pushing effective costs to $30.58.
Float costs emerge from payment timing gaps. If you pay suppliers NET 15 and clients pay you NET 45, you’re financing 30 days of operations. At $100,000 per month in lead purchases with a 30-day float, you carry $100,000 average outstanding. At 8 percent cost of capital, that’s $8,000 per year – $0.80 per lead at 10,000 monthly volume.
Bad debt is inevitable. Not every client pays. Credit-checking and requiring deposits reduces this risk, but some exposure remains. Budget 1 to 2 percent of revenue for uncollectable receivables.
Duplicate and fraud leakage persists even with suppression and validation. Some leads prove invalid post-delivery. Budget 2 to 3 percent for leakage that can’t be monetized.
Margin Targets by Service Type
Different services support different margin structures based on risk, competition, and value delivered:
| Service Type | Target Gross Margin | Target Net Margin |
|---|---|---|
| Shared leads (commodity) | 25-35% | 12-18% |
| Exclusive leads | 35-50% | 20-30% |
| Live transfers | 30-40% | 15-20% |
| Appointment setting | 40-55% | 25-35% |
| Campaign management | 50-70% | 30-45% |
| Retainer services | 60-75% | 40-55% |
These ranges assume mature operations with optimized processes. New agencies typically operate at lower margins while building systems and efficiency.
Pricing Formula
Start with your costs, add target margin, then validate against market reality.
First, calculate your all-in cost per lead by summing traffic and acquisition cost, validation and compliance, platform and processing fees, overhead allocation at expected volume, return rate adjustment, and float and bad debt allowance.
Second, apply your target margin. Divide target margin by one minus target margin to get the markup multiplier. For a 25 percent net margin, that’s 0.25 divided by 0.75, which equals 0.33 or a 33 percent markup. Multiply your all-in cost by 1.33 to get your price.
Third, validate against the market. Research competitor pricing in your vertical. Survey potential clients about price expectations. If your calculated price exceeds market rates, reduce costs or accept lower margins. If your calculated price falls below market rates, capture the additional margin.
Here’s a worked example for insurance leads:
| Component | Value |
|---|---|
| Traffic cost per lead | $22.00 |
| Validation/compliance | $0.55 |
| Platform/processing | $2.00 |
| Overhead (at 3,000 leads/month) | $6.67 |
| Return adjustment (10%) | $2.52 |
| Float/bad debt | $0.60 |
| All-in cost | $34.34 |
| Target net margin | 20% |
| Markup multiplier | 1.25 |
| Calculated price | $42.93 |
| Market range | $35-$55 |
| Set price | $45.00 |
At $45 selling price with $34.34 all-in cost, you achieve 23.7 percent net margin – slightly above target, within market range.
Client Acquisition and Relationship Management
Generating leads for yourself – finding clients who will buy your leads – is often harder than generating leads for those clients. The strategies that work are methodical, relationship-focused, and patient.
Finding Your First Clients
Before you spend a dollar on traffic, you need buyers. Without buyers, lead generation is just expensive data collection.
Direct outreach starts with building a target list of 100 or more potential buyers in your vertical. Research each company before contact. Understand their business model, ideal customer profile, and acquisition challenges. Effective outreach focuses on understanding, not selling. Something like: “I’m building a lead generation operation focused on these leads in this geography. Before building volume, I’m reaching out to understand what quality and specifications would be valuable to your business. Would you have 15 minutes to share what you’re looking for in a lead supplier?” Expect 10 to 20 percent response rate. From 50 targeted outreaches, expect 5 to 10 substantive conversations.
Industry events create concentrated access to buyers. LeadsCon in March and September, Affiliate Summit in January and July, InsureTech Connect for insurance-specific networking, and vertical-specific events in your target market compress months of relationship-building into days. Budget $2,000 to $5,000 per event including travel.
Networks and marketplaces can provide buyer access while you build direct relationships. Companies like Leadpoint, Astoria Company, and vertical-specific networks maintain buyer relationships you can access as a supplier. The trade-off is clear: networks take a cut, typically 10 to 20 percent of lead value, reducing your margin but eliminating buyer acquisition cost.
Structuring Client Agreements
Clear contracts prevent disputes and protect both parties. Every client agreement should address several critical areas.
Lead specifications must define exactly what constitutes a valid lead. Required data fields include name, phone, email, and additional criteria. Geographic targeting specifies states, ZIP codes, or radius. Demographic requirements cover age and income ranges if applicable. Exclusions identify prior customers, specific sources, and other disqualifiers. Be specific. “Interested in auto insurance” is not a specification. “Consumer who has actively requested auto insurance quotes, owns or leases a vehicle, and has valid contact information in approved states” is a specification.
Delivery method and timing define how leads arrive. Options include real-time API delivery with endpoint specifications, batch delivery with frequency, format, and delivery time specified, email delivery for lower-volume arrangements, and CRM integration with Salesforce, HubSpot, or custom systems.
Pricing and payment terms cover price per lead or retainer amount, billing frequency whether weekly, bi-weekly, or monthly, payment terms like NET 15 or NET 30 or prepaid, volume minimums and caps, and when and how price adjustments occur.
Return policy defines what constitutes a valid return and the process. The return window is typically 3 to 7 days from delivery. Valid return reasons include wrong number, duplicate, and out of geography. The return process specifies how to submit and what documentation is required. Return caps limit the maximum percentage of volume returnable, often 10 to 15 percent. Dispute resolution addresses contested returns.
Term and termination provisions cover the initial term, typically 30 to 90 days or month-to-month, renewal terms whether auto-renewal or manual, termination notice of 7 to 30 days, and outstanding payment obligations on termination.
Managing Client Expectations
Client relationships fail more often from misaligned expectations than from lead quality issues. Set expectations clearly from the start.
New campaigns need optimization time. Set realistic volume expectations for the ramp period. During weeks one and two, focus on testing and optimization while delivering 20 to 30 percent of target volume. Weeks three and four involve scaling proven approaches to 50 to 70 percent of target volume. From week five onward, deliver full volume with continuous optimization. Clients expecting day-one full volume will be disappointed. Clients who understand ramp timelines become partners in optimization.
No lead source produces 100 percent perfect leads. Set realistic quality expectations: contact rates of 40 to 60 percent for real-time leads varying by vertical, data accuracy of 90 to 95 percent for validated fields, and conversion rates that vary highly by client sales process. Provide industry benchmarks so clients can contextualize your performance.
Regular communication prevents small issues from becoming relationship-ending disputes. During launch, conduct daily check-ins for the first two weeks. During stabilization, shift to weekly performance reviews. Ongoing relationships need bi-weekly or monthly strategic reviews. For issues, provide same-day response to quality concerns.
Handling Disputes and Difficult Conversations
Every agency faces client disputes. How you handle them determines whether relationships survive.
When clients return leads you believe are valid, review the specific lead in question first. Pull your validation documentation including TrustedForm certificate and validation records. Present evidence factually, without accusation. If documentation supports validity, explain your position calmly. If documentation is ambiguous, consider splitting the difference. Document the resolution and any precedent set.
When campaigns underperform client expectations, acknowledge the gap between expectation and reality. Present specific data on what’s happening. Explain contributing factors like market conditions, competition, and seasonal effects. Present a specific action plan with timeline. Define success criteria and check-in points. If fundamentals are wrong, be honest about viability.
When clients push for lower pricing, understand the business reason first – whether competitive pressure, margin squeeze, or budget constraints. If you can reduce price, tie it to something like volume commitment, longer term, or reduced services. If you can’t reduce price, explain your cost structure transparently. Consider non-price alternatives like improved return policy, faster delivery, or additional data. Be willing to walk away from unprofitable relationships.
Scaling Your Agency: From Startup to Established Operation
Growth creates new challenges. The systems that work at 1,000 leads per month break at 10,000. The team structure that works with three people fails at fifteen. Understanding scaling stages helps you prepare for what’s coming.
Growth Phases
Phase 1: Validation (Months 1-6)
The focus during validation is proving unit economics in one vertical with initial clients. Target monthly revenue of $10,000 to $25,000, lead volume of 200 to 500 per month, 2 to 5 active clients, and a team of just 1 to 2 people including the founder plus perhaps a contractor. Key activities center on campaign testing and optimization, client feedback integration, process documentation, and cash flow management.
Phase 2: Foundation (Months 6-12)
Foundation-building focuses on creating repeatable processes that don’t depend on founder execution. Target monthly revenue of $25,000 to $75,000, lead volume of 500 to 2,000 per month, 5 to 15 active clients, and a team of 2 to 4 people. Key activities include making first hires in operations and media buying, building system automation, developing client management processes, and implementing quality monitoring systems.
Phase 3: Expansion (Months 12-24)
Expansion focuses on scaling volume and potentially expanding to additional verticals. Target monthly revenue of $75,000 to $250,000, lead volume of 2,000 to 10,000 per month, 15 to 40 active clients, and a team of 5 to 12 people. Key activities involve team building across functions, new buyer development, vertical expansion if appropriate, and operational efficiency optimization.
Phase 4: Optimization (Year 2-3)
The optimization phase focuses on improving margins, building defensibility, and reducing founder dependence. Target monthly revenue of $250,000 to $750,000 or more, lead volume of 10,000 to 30,000 or more per month, 40 to 100 or more active clients, and a team of 12 to 30 or more people. Key activities include technology differentiation, strategic partnerships, transitioning the founder from execution to strategy, and potential vertical integration or acquisition.
Margins by Stage
Agency profitability follows a predictable pattern as operations mature.
During the startup phase in year one, expect 5 to 15 percent net margin. High costs relative to revenue, learning curve expenses, inefficient operations, and the cost of building systems all compress margins.
During the growth phase in year two, expect 15 to 25 percent net margin. Systems begin improving, though team investment consumes some margin. Economies of scale emerge and client relationships deepen.
During the mature phase in year three and beyond, expect 20 to 35 percent net margin. Operations are optimized, buyer relationships are established, technology leverage increases, and premium pricing power develops.
Hiring Sequence
The order you hire matters. Each role should be justified by specific bottlenecks or opportunities.
The first hire should be a virtual assistant or junior operations person at $15 to $25 per hour. They handle lead data management and cleanup, basic buyer communication, reporting and administrative tasks. This frees your time for high-value activities.
The second hire should be a media buyer or traffic manager at $50,000 to $80,000 per year. They manage campaign management and optimization, creative testing and scaling. This is the hire that enables volume growth.
The third hire should be an account manager at $45,000 to $70,000 per year. They handle buyer relationship management, quality issue resolution, and expansion within existing accounts. This frees you for new buyer development.
The fourth hire should be a designer or creative specialist at $50,000 to $75,000 per year. They handle landing page design and testing, ad creative development, and conversion rate optimization.
Technology Investment Timeline
Technology needs evolve with scale. Invest ahead of growth, but not so far ahead that you’re paying for unused capacity.
From pre-launch through $25,000 per month in revenue, you need a landing page builder at $100 to $200 per month, basic CRM at $50 to $100 per month, consent documentation at $0.25 to $0.50 per lead, Google Analytics which is free, and manual or semi-automated lead delivery.
From $25,000 to $100,000 per month in revenue, you need a full lead distribution platform at $500 to $1,500 per month, integrated CRM at $150 to $500 per month, advanced analytics with attribution at $200 to $500 per month, multiple validation services, and automated workflows.
At $100,000 or more per month in revenue, you need an enterprise distribution platform or custom development, business intelligence dashboards, custom integrations across all systems, and dedicated technical resources.
Common Pricing and Service Mistakes
Understanding failure patterns helps you avoid them. These mistakes destroy margins, relationships, and businesses.
Mistake 1: Underpricing to Win Business
The temptation appears when a potential client says your competitor quoted $40 per lead. You quote $35 to win the business.
The reality is brutal. If your all-in cost is $34, you’re now operating at 3 percent margin. One bad campaign week and you’re losing money. Returns run higher than expected and you’re bleeding cash.
Price based on your costs plus required margin. If you can’t win at viable pricing, the business isn’t worth winning. Race-to-bottom pricing destroys the industry and yourself.
Mistake 2: Not Accounting for Returns in Pricing
The temptation is to calculate margin as selling price minus traffic cost. At $50 CPL with $30 traffic cost, that looks like 40 percent margin.
The reality is different. If 12 percent of leads get returned, your effective revenue is $44, not $50. Your margin is 32 percent, not 40 percent. Plus you’ve already paid for the returned leads, so your actual economics are worse.
Build return rate assumptions into pricing from the start. Calculate price as cost divided by one minus return rate, then multiply by one plus target margin.
Mistake 3: Misaligned Expectations
The temptation is to promise aggressive volume and quality to close the deal.
The reality follows. Client expects 1,000 leads in month one. You deliver 300 as you optimize. The relationship starts in deficit and never recovers.
Set conservative expectations you can exceed. Under-promise and over-deliver. Document agreed expectations in writing.
Mistake 4: Ignoring Float Requirements
The temptation is to focus on profit margin without considering cash timing.
The reality creates crisis. You owe suppliers $50,000 on day 15. Clients will pay $75,000 on day 45. Your bank account doesn’t care about your future receivables.
Maintain 60 days of operating capital. Track cash flow as carefully as profitability.
Mistake 5: Concentration Risk in Revenue
The temptation emerges when one client wants 80 percent of your capacity. The revenue seems guaranteed.
The reality surfaces when that client changes terms, reduces volume, or churns. Overnight, 80 percent of your revenue disappears.
No single client should exceed 25 percent of revenue. Diversify deliberately, even when it’s operationally easier to concentrate.
Mistake 6: Scope Creep in Retainer Agreements
The temptation is to say yes when a client asks for “just one more thing” outside scope. You want to keep them happy.
The reality accumulates. One thing becomes ten. Your $5,000 per month retainer now requires $8,000 per month of work.
Document scope explicitly. When requests exceed scope, respond clearly: “We can absolutely do that. Here’s what that would cost as an add-on, or we can discuss adjusting the retainer for expanded scope.”
Frequently Asked Questions
1. How much should I charge per lead for my agency?
Pricing depends on your vertical, lead quality, and cost structure. Insurance leads typically range from $25-$75 for shared, $60-$150 for exclusive. Solar runs $40-$200. Legal can exceed $200-$600. Calculate your all-in costs (traffic, validation, compliance, overhead, returns), add target margin of 20-30%, and validate against market rates. If your calculated price is significantly above market, either reduce costs or accept lower margins.
2. Should I offer retainer pricing or pure performance (CPL) pricing?
Most new agencies start with performance-based CPL because it’s easier to sell – clients only pay for results. As relationships mature and trust develops, hybrid models (retainer plus CPL) provide more predictable revenue. Pure retainers work best for managed services where significant strategic work is required beyond lead delivery. Your choice should reflect client expectations, your cash flow needs, and the complexity of work involved.
3. What services should a new lead generation agency offer?
Start narrow. Begin with one core service (typically exclusive or shared leads in a single vertical), prove your ability to deliver profitably, then expand. Adding live transfers, appointment setting, or campaign management requires additional infrastructure, expertise, and capital. Agencies that try to offer everything from day one usually execute nothing well. Master one service type before adding complexity.
4. How do I handle clients who want to negotiate lower pricing?
Understand their business reason first – are they facing competitive pressure, margin squeeze, or budget constraints? If you can reduce price, tie it to something: volume commitment, longer term, reduced services, or modified return policy. If you can’t reduce price, explain your cost structure transparently and offer non-price alternatives. Be willing to walk away from unprofitable relationships. A client who only works at unsustainable pricing will eventually cost you more than they pay.
5. What margin should a lead generation agency target?
Healthy agencies target 20-30% net margin after all costs including returns, overhead, and float expenses. Gross margins (revenue minus direct costs) typically run 30-50%. New agencies often operate at lower margins (10-15%) while building systems and scale. If your net margin falls below 10% sustained, your pricing or cost structure needs adjustment. Margins below 10% leave no room for the unexpected challenges every agency faces.
6. How do I prevent clients from returning too many leads?
Start with clear lead specifications that define exactly what constitutes a valid lead. Include return caps in contracts (often 10-15% maximum). Require specific documentation for returns – vague complaints should not be accepted. Track return rates by client and address patterns proactively (see our lead return rates benchmarks). If a client’s return rate significantly exceeds others receiving the same leads, the issue is likely on their end. Have that conversation with data rather than defensiveness.
7. When should I transition from performance pricing to retainer models?
Consider retainer models when: (1) you’ve delivered consistently for 3-6 months and established trust, (2) significant strategic or management work is required beyond lead delivery, (3) the client has budget certainty requirements, or (4) you want more predictable revenue for business planning. The transition conversation focuses on value: “We’ve been delivering at $X CPL. For predictable budget and expanded services, a monthly retainer of $Y covers both lead generation and strategic optimization.”
8. What’s the difference between shared and exclusive leads, and how should I price them?
Exclusive leads are sold to one buyer only – the consumer’s information goes to exactly one client. Shared leads are sold to multiple buyers (typically 3-5), with each buyer knowing about competition. Exclusive leads typically command 2-3x shared lead pricing because buyers face no competition for the prospect’s attention. Price exclusive leads at the premium the market supports for your vertical, usually $80-$200 depending on vertical versus $25-$60 for shared leads.
9. How long does it take for a lead generation agency to become profitable?
Realistic timeline: 6-18 months to consistent profitability depending on capital, vertical selection, and execution. Well-capitalized agencies with proven traffic expertise can reach break-even in 6-9 months. Agencies learning as they go typically take 12-18 months. Variables include: starting capital, vertical selection, traffic channel expertise, buyer relationships, and operational efficiency. Anyone promising faster results is likely underestimating the learning curve or setting unrealistic expectations.
10. Should I specialize in one vertical or diversify across multiple industries?
Specialize first. Deep expertise in one vertical commands premium pricing and improves results. Generalist agencies compete on price; specialists compete on value. Once you’ve mastered one vertical (typically 12-18 months), consider adjacent expansion. The vertical aggregator model – deep specialization in one industry – often outperforms broad diversification, particularly for smaller agencies. Diversification makes sense at scale to reduce risk, but premature diversification dilutes focus and expertise.
Key Takeaways
-
Price based on costs, not just market rates. Calculate your true all-in cost per lead including traffic, validation, compliance, overhead allocation, returns, and float. Then add margin. If your calculated price doesn’t work in the market, adjust costs rather than accepting unsustainable margins.
-
Start with one core service and master it. Agencies that try to offer leads, transfers, appointments, and managed campaigns from day one rarely execute any of them well. Prove profitability in one service type before expanding.
-
Match pricing models to relationship maturity. Performance-based CPL is easiest to sell to new clients. Hybrid models provide more predictable revenue with established relationships. Pure retainers require significant trust and scope clarity.
-
Target 20-30% net margin for sustainability. Gross margins of 35-50% should translate to 20-30% net after all costs. Margins below 15% leave no room for unexpected challenges. Margins above 35% suggest you may be leaving growth on the table.
-
Set expectations before they become disappointments. Volume ramps, quality variation, and campaign optimization timelines should be documented before launch. Clients who understand realistic expectations become partners in success; clients with unrealistic expectations become sources of conflict.
-
Build return assumptions into pricing from the start. If your return rate is 12%, your effective revenue is 88% of stated CPL. Pricing that doesn’t account for returns creates margin erosion that only appears in retrospect.
-
Diversify clients to limit concentration risk. No single client should exceed 25% of revenue. The security of a large client can become catastrophic dependency when they reduce volume or churn.
-
Maintain 60 days of operating capital for float. The timing gap between paying suppliers and receiving client payments requires working capital that has nothing to do with profitability. Undercapitalization kills profitable agencies.
The lead generation agency model creates real wealth for operators who understand service structuring and pricing mechanics. The agencies that survive and thrive are those that build sustainable economics from day one, rather than chasing volume at unsustainable margins. Price correctly, scope clearly, deliver consistently, and the compounding effects of client retention and referrals will build your business over time.
This article is adapted from “The Lead Economy” by industry professionals with operational experience across the lead generation ecosystem. Statistics and pricing benchmarks current as of late 2025.