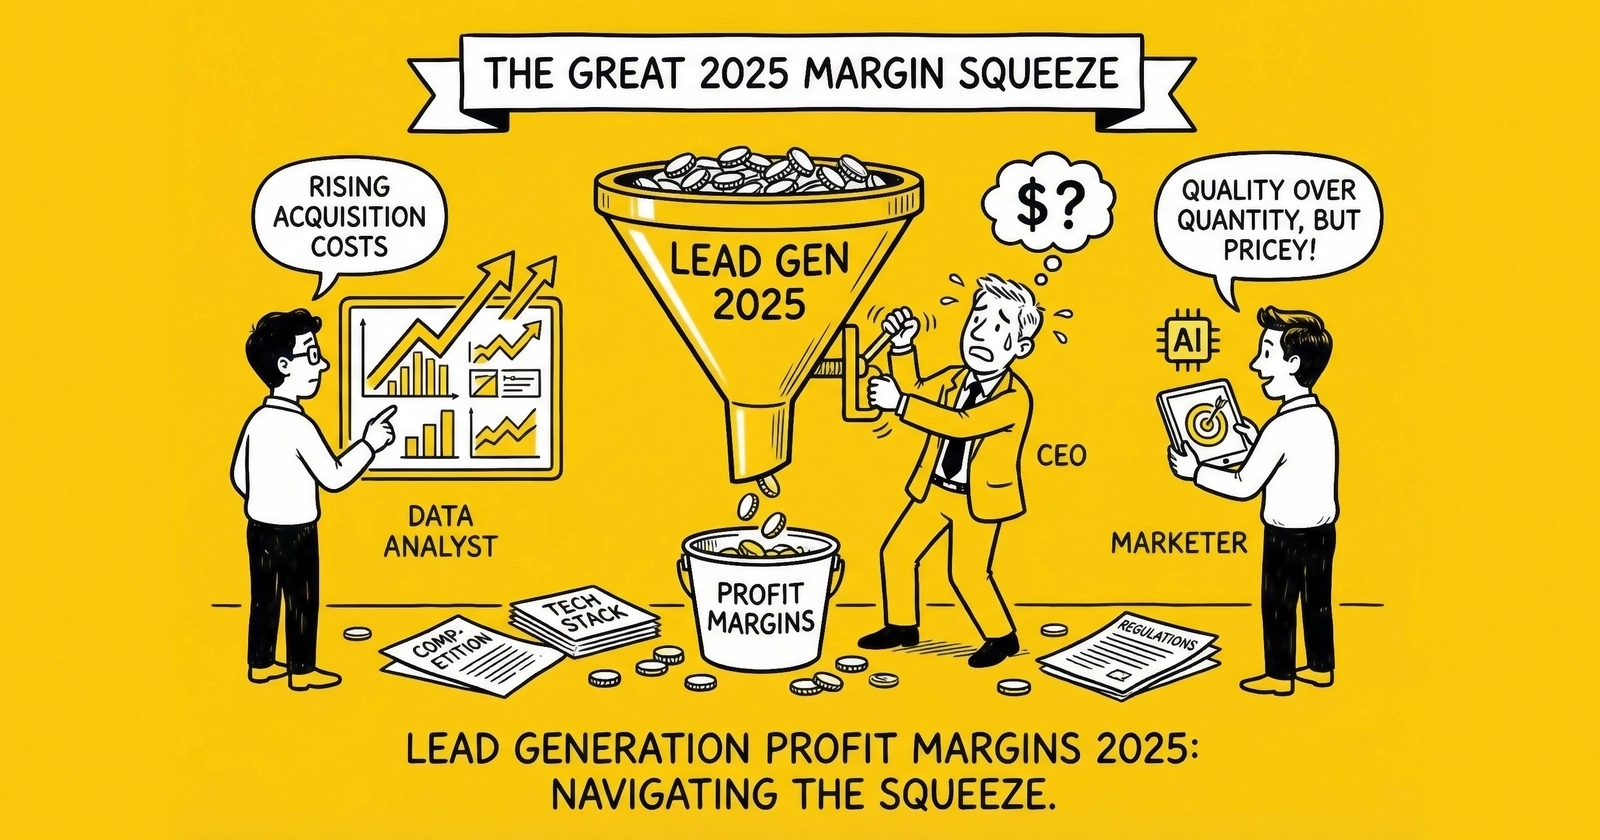
The pitch deck says 40% margins. Your P&L says 12%. Here is where the other 28% actually goes and what margins you should realistically expect across different lead generation business models.
The Margin Myth That Traps New Operators
Every conference presentation shows the same slide. A lead broker buys leads at $40, sells them at $70, and pockets a clean 43% gross margin. Scale that to 10,000 leads monthly, and you are looking at $300,000 in monthly profit on $700,000 revenue. Easy money.
Except that is not how the math actually works.
The operator who built that slide is either selling something, has never run a lead generation business, or is conveniently ignoring a dozen cost categories that separate gross margin from net margin. The reality is that lead generation margins vary dramatically by business model, vertical, and operational maturity. More importantly, the margins you see quoted at conferences bear little resemblance to what actually lands in your bank account.
This guide gives you the real numbers. Every margin figure here comes from operational experience, public filings, or verified industry research. When data conflicts, I will tell you. When margins vary by circumstance, I will explain why. By the end, you will understand exactly what margins you can expect from different lead generation models, where margins erode between gross and net, and what separates operators earning 35% from those scraping by at 8%.
Understanding Lead Generation Margin Types
Before examining specific numbers, we need a shared vocabulary. The lead generation industry uses margin terminology loosely, which creates confusion and unrealistic expectations. Understanding the distinctions between gross margin, net margin, contribution margin, and EBITDA margin will help you cut through the marketing noise and set appropriate targets for your operation.
Gross margin measures the spread between what you pay for leads (or traffic to generate leads) and what you sell them for, before operating expenses. The formula is straightforward: (Revenue - Cost of Goods Sold) / Revenue. For a broker buying leads at $40 and selling at $60, gross margin is 33.3%. This is the number that appears on pitch decks and conference slides, and it is dangerously misleading when taken at face value.
Net margin measures what remains after all operating expenses, overhead, and hidden costs. The calculation changes to: (Revenue - All Costs) / Revenue. For that same broker, once you subtract returns (12%), platform fees (2%), validation services (1%), compliance costs (1%), labor allocation (5%), float cost (2%), and bad debt (2%), that 33% gross margin becomes approximately 15-18% net margin. The gap between gross and net margin is where operators get blindsided. Every percentage point between those two numbers represents a real cost that was not included in the pitch deck calculation.
Contribution margin measures what each lead contributes to covering fixed costs and generating profit. This metric matters most for scaling decisions, and it is calculated as Revenue minus Variable Costs per Lead. Variable costs include lead acquisition, per-lead technology fees (validation, TrustedForm, platform transaction fees), and return processing. Fixed costs like salaries, office space, and base platform subscriptions are excluded. A lead with $15 contribution margin is profitable as long as your fixed costs per lead stay below $15. Understanding contribution margin helps you calculate your break-even volume and make informed scaling decisions.
EBITDA margin (Earnings Before Interest, Taxes, Depreciation, and Amortization) provides the best comparison across companies with different capital structures, which is why it appears so frequently in discussions of mature lead generation businesses. Public lead generation companies report EBITDA margins ranging from -5% during aggressive growth phases to 25% or higher at mature scale. MediaAlpha, EverQuote, and QuinStreet provide useful benchmarks through their SEC filings.
Realistic Margins by Business Model
The lead generation industry contains at least twelve distinct business models, each with dramatically different margin profiles. Understanding which model you are operating helps set appropriate expectations. The following breakdown covers the most common models, with real numbers drawn from operational experience and public data.
Lead Brokerage: 15-18% Net Margin
Lead brokers aggregate supply from generators and distribute to buyers, capturing the spread on each transaction. This is the most commonly cited model when discussing lead generation margins, and also the most frequently misunderstood.
The pitch deck version looks compelling. Buy leads at $40, sell them at $55, capture 27% gross margin ($15 per lead), move 10,000 leads monthly, and pocket $150,000 in profit. Simple arithmetic, attractive returns.
Here is what actually happens to that margin. The $40 purchase price is just the starting point. Returns average 12% in most verticals, which adds $4.80 to your effective cost when spread across sold leads. Platform fees run approximately 3%, adding $1.65. Validation services cost $0.35 per lead. Compliance documentation through TrustedForm and similar services adds $0.50. Float cost from the 30-day gap between paying suppliers and collecting from buyers adds $0.40. Bad debt from buyers who do not pay adds $1.10. Labor allocation for campaign management, quality review, and buyer communication adds $1.50. Your true cost per delivered lead lands at $50.30, leaving net revenue of $4.70 per lead, or 8.5% of the sale price.
That is before allocating overhead for office space, accounting, legal, and management time. Realistic net margins for established lead brokers with scale efficiency range from 15-18%. Newer brokers or those without volume frequently operate at 8-12% net margins or negative until scale is achieved.
The margin compression happens for predictable reasons. Return rates erode gross margin directly, with industry averages running 8-15%. That means you paid for leads that generated zero revenue. Float cost is real money. You pay publishers in 7-15 days. Buyers pay you in 30-45 days. At 12% annual cost of capital, a 30-day float on $40 costs approximately $0.40 per lead. And bad debt is unavoidable. Some buyers do not pay. Credit-checking and prepayment requirements reduce but do not eliminate this risk.
Direct Lead Generation (O&O): 25-40% Net Margin
Direct generators own the entire funnel: ads, landing pages, and buyer relationships. Eliminating the broker layer captures that margin for yourself, but introduces traffic risk.
The margin structure breaks down differently than brokering. Traffic acquisition consumes 30-50% of revenue. Technology and hosting run 2-5%. Compliance tools take another 2-5%. Labor for campaign management runs 10-15%. Net margin lands between 25-40%.
At scale, the numbers can look excellent. An operation spending $150,000 monthly on ads might generate 7,500 leads at $20 cost per lead. If those leads sell for an average of $45, gross margin sits at 55.6%. After $35,000 in operating costs, net profit reaches $152,500, or 45.1% net margin.
The catch is that traffic costs are volatile. A $20 CPL can become $35 after a platform algorithm change. Your 56% gross margin becomes 22% overnight. The margin range of 25-40% reflects this volatility. Operators at the high end maintain diverse traffic sources and excellent conversion rates. Operators at the low end face platform dependency and creative fatigue.
Ping/Post Exchange: 20-35% Net Margin
Exchanges facilitate real-time auctions without taking inventory risk. Revenue comes from transaction fees (typically 5-15% of lead value) rather than buy/sell spreads.
Technology infrastructure consumes 20-30% of revenue. Network development takes 15-20%. Operations and support run 10-15%. Net margin lands between 20-35%.
Exchange models offer higher margins than brokering because transaction fee revenue is not subject to return risk. When a lead returns, the exchange has already collected its fee. The buyer and seller bear the quality risk.
However, exchanges require significant upfront investment ($500,000-$2,000,000) and 18-30 months to reach profitability. The margin profile only matters if you survive the building phase.
Affiliate Network: 25-40% Net Margin
Networks connect publishers to buyers without taking inventory risk, earning 10-20% of transaction value as revenue share.
Technology platform costs consume 15-25% of revenue. Publisher management takes 10-15%. Quality monitoring runs 5-10%. Operations add another 10-15%. Net margin lands between 25-40%.
Networks benefit from similar economics to exchanges: revenue share rather than inventory risk. The primary cost is fraud management. Sophisticated fraudsters target networks for volume and anonymity, requiring continuous investment in detection and prevention.
Call Center / Live Transfer: 15-25% Net Margin
Call centers generate and qualify leads via phone, transferring live connections to buyers at premium pricing ($50-$500+ per transfer).
Labor dominates the cost structure at 40-50% of revenue. Lead acquisition runs 10-20%. Telephony infrastructure takes 5-10%. Technology and compliance add another 5-10%. Net margin lands between 15-25%.
Labor intensity compresses margins but provides operational control. The key variables are agent productivity (calls per hour, conversion rate) and buyer capacity utilization. When buyers pause campaigns, agents sit idle but still get paid.
TCPA compliance is an existential risk. Every call creates potential liability of $500-$1,500 per violation. Compliance costs run 2-5% of revenue, and a single lawsuit can eliminate years of profit.
Owned Media Publisher: 40-60% Net Margin
Owned media publishers build content properties generating organic traffic through SEO and brand recognition. Think NerdWallet, Bankrate, or Healthline.
Content creation consumes 20-35% of revenue. Technology runs 10-15%. SEO and marketing take another 10-15%. Net margin lands between 40-60%.
These are the highest margins in lead generation. Once organic traffic is established, there is no ongoing media cost. Content assets depreciate slowly compared to paid campaign creative.
The tradeoff is time. Owned media requires 12-24 months of investment ($500,000-$1,000,000) before meaningful revenue materializes. Most practitioners cannot wait that long. Those who do build businesses with defensible competitive advantages and margins that paid traffic operators can only envy.
Platform / SaaS Provider: 20-30% Net Margin
Platform providers sell technology infrastructure to other lead generation companies. Revenue comes from subscriptions and transaction fees rather than lead transactions.
Engineering and development consume 25-35% of revenue. Sales and marketing take 25-30%. Infrastructure runs 10-15%. Customer success adds 10-15%. Net margin lands between 20-30%.
SaaS economics improve dramatically at scale due to operating leverage. A platform serving 50 customers and one serving 200 customers have similar infrastructure costs, but 4x the revenue. Early-stage platforms often operate at negative margins while building customer base.
Public lead generation SaaS companies show mature EBITDA margins of 15-25%. The investment required to reach this point ($2,000,000-$5,000,000) makes this model accessible only to well-capitalized operators.
Margin Erosion: Where the Money Actually Goes
Understanding why net margins fall so far below gross margins requires examining each cost category that erodes the spread. These are not theoretical concerns. Every percentage point listed below represents real money that leaves your business.
Returns and Refunds: 8-15% of Revenue
Returns occur when buyers reject leads post-purchase. Common reasons include: lead does not answer phone, provided false information, does not meet unstated buyer criteria, or is a duplicate of existing contact.
Return rates vary dramatically by vertical. Auto insurance typically runs 8-12% for average performers, with top performers achieving 5-8% and poor performers suffering 15-20%. Mortgage leads show 10-15% average, with top performers at 7-10% and poor performers at 20-30%. Solar leads run 15-22% average, 10-15% for top performers, and 30-40% for poor performers. Home services average 12-18%, with top performers at 8-12% and poor performers at 25-35%. Legal leads face the highest variability, averaging 18-30%, with top performers at 12-18% and poor performers at 35-50%.
Returns do not just eliminate revenue. They create costs: you paid for the lead acquisition, processing, and validation. A 12% return rate on $50 leads means $6 per lead sold evaporates. On 10,000 monthly leads, that is $60,000 in margin erosion.
Those who maintain low return rates do three things consistently. Real-time validation catches bad data before leads enter the pipeline. Speed to buyer ensures leads are contacted while still warm. Source accountability pauses suppliers exceeding return thresholds.
Float Cost: 2-4% of Revenue
The timing gap between paying suppliers and collecting from buyers creates working capital requirements with real costs.
The math is straightforward. You pay publishers Net-15 (15 days after lead delivery). Buyers pay you Net-45 (45 days after lead delivery). That creates a 30-day float gap multiplied by your cost of capital. At $500,000 monthly lead cost and 12% annual cost of capital, you have average capital deployed of $250,000 (half of monthly volume), monthly cost of $2,500, and per-lead cost of $0.25 at 10,000 leads. The 60-day float rule provides a framework for managing this capital requirement.
This calculation understates actual float costs for growing businesses. Each month of growth requires additional capital to fund the expanded gap. A business growing 20% monthly needs to fund that incremental $100,000 for 30 days before revenue arrives.
Float cost varies dramatically by financing source. Credit cards carry 18-26% annual rates, costing $1,500-$2,167 monthly per $100K float. Factoring runs 24-36%, costing $2,000-$3,000 monthly. Revenue-based financing sits at 25-45%, costing $2,083-$3,750 monthly. Bank lines of credit run 8-15%, costing $667-$1,250 monthly. Personal capital costs 8-12%, running $667-$1,000 monthly per $100K float.
Platform and Technology Fees: 2-5% of Revenue
Distribution platforms, CRM systems, dialers, and validation services all extract costs.
Per-lead technology costs add up quickly. Distribution platforms like boberdoo and LeadsPedia run $0.10-$0.50. TrustedForm consent documentation costs $0.15-$0.50. Jornaya lead intelligence adds $0.10-$0.30. Phone validation runs $0.01-$0.05. Email validation costs $0.005-$0.02. Fraud detection adds $0.02-$0.15.
A comprehensive technology stack runs $0.40-$1.50 per lead depending on vertical and compliance requirements. At scale, these costs decline as percentage of revenue due to volume discounts. At smaller scale, fixed platform subscriptions spread across fewer leads increase per-unit costs.
Compliance Costs: 1-3% of Revenue
TCPA compliance requires documentation, legal review, and insurance. Consent documentation through TrustedForm or Jornaya runs $0.25-$0.75 per lead. Legal counsel allocation runs $2,000-$10,000 annually. TCPA insurance costs $5,000-$25,000 annually. Compliance training and monitoring add $1,000-$5,000 annually.
Though the FCC’s one-to-one consent rule was vacated by the Eleventh Circuit in January 2025, industry practice has shifted toward stricter consent standards. Many sophisticated buyers now require documented prior express written consent specific to each seller, increasing compliance costs industry-wide.
Compliance costs are not negotiable. The alternative is TCPA liability averaging $6.6 million per class action settlement. Spending 1-3% of revenue on compliance to avoid potential 500% of revenue in penalties is rational risk management.
Bad Debt: 1-3% of Revenue
Not every buyer pays their invoices. Credit-checking buyers and requiring prepayment reduces this risk, but some exposure remains.
Bad debt rates vary by buyer type. Prepaying buyers have zero bad debt exposure. Enterprise carriers with established accounts payable run 0.5-1%. Mid-market agencies with credit history run 1-2%. New buyers on Net-30 terms run 3-5%.
Managing bad debt requires disciplined credit policies: check references before extending credit, start new buyers on prepayment or Net-15, graduate to Net-30 only after payment history is established.
Labor Allocation: 5-15% of Revenue
Leads require human effort beyond what automation provides. Campaign management and optimization takes 2-5 hours per day. Lead processing and quality review runs 1-3 hours per day. Buyer communication and dispute resolution takes 2-4 hours per day. Compliance monitoring adds 1-2 hours per day.
A fully loaded employee ($60,000-$120,000 annually including benefits and overhead) handling 20,000 leads monthly adds $0.25-$0.50 per lead in labor cost. Smaller operations spread these duties across fewer leads, increasing per-unit labor costs.
Margin Variation by Vertical
Lead generation margins vary substantially across verticals due to differences in lifetime value, competitive intensity, and regulatory complexity. Choosing your vertical is choosing your margin ceiling.
Insurance: 15-35% Net Margin
Insurance leads command the highest volumes but moderate margins due to intense competition and carrier sophistication.
The economics vary significantly by sub-vertical. Auto insurance shared leads typically cost $8-15 to acquire and sell for $12-25, yielding 15-25% net margin. Auto exclusive leads cost $30-50 and sell for $50-85, yielding 20-30% net margin. Medicare leads cost $25-60 and sell for $40-100, yielding 18-28% net margin. Life insurance leads cost $20-50 and sell for $35-80, yielding 20-32% net margin. Health (ACA) leads cost $15-40 and sell for $30-70, yielding 18-28% net margin.
Carriers like Progressive ($3.5 billion advertising budget in 2024) create massive demand. This demand supports high volume but compresses margins through competition. Successful insurance lead operators achieve 25-35% net margins through vertical specialization, carrier relationship depth, and compliance excellence.
Mortgage: 12-25% Net Margin
Mortgage leads face extreme rate sensitivity. When rates drop, demand surges and margins expand. When rates rise, buyers reduce caps and margins compress.
The 2024-2025 context is particularly challenging. Higher rates reduced purchase mortgage activity by more than 40%. Refinance volume collapsed 60-70%. Lead prices fell while acquisition costs remained stable.
Current net margins for mortgage lead generation run 12-20%, down from 25-35% during the 2020-2021 refinance boom. Practitioners who diversified into purchase mortgage, home equity, and adjacent verticals maintained higher margins than those dependent on refinance.
Solar: 20-35% Net Margin
Solar leads offer attractive margins driven by high installer lifetime value ($5,000-$15,000 per closed sale) and geographic arbitrage opportunities.
Geographic variation creates substantial opportunity. California customer acquisition cost runs approximately $1,929. North Dakota customer acquisition cost sits around $225. That 8.5x spread creates geographic optimization opportunity for sophisticated practitioners.
Sophisticated solar lead operators achieve 30-35% net margins by targeting underserved markets where competition is lower and CPLs are cheaper. Less sophisticated practitioners competing in saturated markets run 15-22% margins.
Legal: 25-45% Net Margin
Legal leads command the highest per-lead prices ($200-$3,000+) and support the highest margins when operated correctly.
Margin potential varies by practice area. Personal injury leads cost $100-300 to acquire and sell for $200-600, yielding 25-35% net margin. Mass tort leads cost $50-200 and sell for $150-500, yielding 30-40% net margin. Workers comp leads cost $75-200 and sell for $150-400, yielding 28-38% net margin. Bankruptcy leads cost $50-125 and sell for $100-250, yielding 25-35% net margin. Family law leads cost $40-100 and sell for $80-200, yielding 22-32% net margin.
Higher margins reflect higher risk. Legal leads face stricter ethical advertising requirements, bar association scrutiny, and qualification complexity. The operators earning 40%+ margins have deep legal industry expertise and sophisticated compliance infrastructure.
Home Services: 18-28% Net Margin
Home services (HVAC, plumbing, roofing, pest control) offer accessible entry points but moderate margins due to fragmented buyer markets.
Several factors drive margin variation. Local market concentration affects pricing power. Seasonal demand creates volume volatility. Contractor size affects payment reliability. Service urgency affects conversion rates.
Emergency service leads (HVAC failure, plumbing emergency) command premium pricing and higher margins (25-30%). Scheduled service leads (routine maintenance, estimates) generate lower margins (15-20%) but more consistent volume.
Scale Effects on Margins
Margins improve with scale due to operating leverage, volume discounts, and efficiency gains. Understanding these dynamics helps you set realistic expectations at your current scale and identify the investment required to reach higher-margin tiers.
Volume Discount Effects
Platform and technology costs per lead decline meaningfully as volume increases. At 5,000 monthly leads, platform costs run $0.45 per lead and technology costs run $0.65, for a combined $1.10. At 10,000 leads, those drop to $0.35 and $0.55 respectively, totaling $0.90. At 25,000 leads, costs fall to $0.25 and $0.45, totaling $0.70. At 50,000 leads, they reach $0.18 and $0.35, totaling $0.53. At 100,000 leads, platform costs are $0.12 and technology costs are $0.28, for a combined $0.40 per lead.
A 100,000 lead/month operation saves $0.70 per lead compared to a 5,000 lead operation on platform and technology alone. That is $70,000 monthly margin improvement purely from scale efficiency.
Labor Efficiency Gains
Fixed labor costs spread across more leads at scale. At 5,000 monthly leads, labor costs $2.00 per lead when one person does everything. At 10,000 leads, partial specialization drops that to $1.25. At 25,000 leads, a full team with specialized roles runs $0.80 per lead. At 50,000 leads, a management layer and process optimization bring costs to $0.55. At 100,000 leads, mature operations with automation achieve $0.35 per lead in labor cost.
These gains compound. The combination of platform discounts and labor efficiency can add 3-5 percentage points to net margin between 10,000 and 100,000 monthly leads.
Negotiating Power
Scale enables better terms with both suppliers and buyers.
On the supplier side, volume commitments secure lower CPLs. Exclusive source agreements provide pricing advantages. Payment term negotiations reduce float cost.
On the buyer side, volume enables access to enterprise buyers with reliable payment. Premium placement and priority routing become negotiable. Exclusivity agreements command pricing premiums.
Operators at scale earn 2-4 percentage points higher margins than smaller competitors in the same vertical, purely from negotiating position.
The Scale Threshold
For most lead generation models, the meaningful scale threshold for margin improvement sits between 25,000 and 50,000 monthly leads. Below this level, fixed costs dominate and per-lead economics remain compressed. Above this level, most scale efficiencies have been captured.
This threshold explains why the industry has a “missing middle.” Operators either run small lifestyle businesses with modest margins or scale to significant volume where economics improve. The zone between 10,000 and 30,000 monthly leads often offers the worst economics: too large for lifestyle simplicity, too small for scale benefits.
Public Company Benchmarks
Public lead generation companies provide verified margin data through SEC filings. These benchmarks help calibrate expectations, though public company scale typically exceeds what most practitioners will achieve.
MediaAlpha (MAX) operates primarily in insurance lead distribution, processing over $1.5 billion in annual transaction value. Their 2024 financial performance showed revenue of $864.7 million (123% YoY growth) and adjusted EBITDA in the $85-$100 million range, yielding approximately 10-12% EBITDA margin. MediaAlpha’s lower margins reflect their marketplace model (transaction fees on volume) and aggressive growth investment. Their take rate on transactions runs 5-15%, with operating leverage improving as volume scales.
EverQuote (EVER) focuses on insurance lead generation with strong auto insurance positioning. Their 2024 financial performance showed revenue of $500.2 million (74% YoY growth), with auto insurance revenue of $446.1 million (96% YoY growth). Adjusted EBITDA improved to approximately breakeven after prior losses. EverQuote’s margin recovery during 2024 demonstrates how insurance cycle improvements affect lead generation economics. As carrier advertising budgets expanded (Progressive’s $3.5 billion in 2024), demand increased and margins improved.
QuinStreet (QNST) operates across multiple verticals including education, financial services, and home services. Their fiscal 2024 financial performance showed revenue of $613.5 million and adjusted EBITDA of $20.4 million, yielding approximately 3.3% EBITDA margin. QuinStreet’s diversified model provides stability but limits vertical-specific margin optimization. Their multi-vertical approach accepts lower margins for reduced risk concentration.
LendingTree (TREE) connects consumers with 500+ financial services partners across mortgage, personal loans, insurance, and credit products. Their 2023 revenue reached $672.5 million, diversified across mortgage, personal loans, insurance, and credit cards. LendingTree’s performance illustrates vertical volatility. Their mortgage segment suffered during rate increases while insurance and personal loans provided stability. Margin profiles shift significantly based on which verticals are performing.
Margin Improvement Strategies
Operators cannot control market conditions, but they can optimize controllable variables. The following strategies have the highest impact on margin improvement, ranked by potential percentage point impact.
Conversion Rate Optimization: 5-15 Point Margin Impact
The single highest-leverage variable in lead generation is landing page conversion rate. Small improvements create outsized margin effects.
Consider the math. At $4.66 CPC and $100 lead sale price, a 5% conversion rate yields $93.20 CPL and $6.80 gross margin (6.8%). A 6% conversion rate drops CPL to $77.67, yielding $22.33 gross margin (22.3%). A 7% conversion rate brings CPL down to $66.57, yielding $33.43 gross margin (33.4%).
Moving from 5% to 7% conversion rate adds 26.6 percentage points to gross margin without changing traffic costs or sale prices. No other variable has comparable impact.
Conversion rate optimization involves multiple tactics. Multi-step forms achieve 86% higher conversion than single-page forms in many studies. Mobile optimization matters because more than 60% of traffic is mobile. Page speed directly affects conversion, with each second of load time costing conversions. Social proof and trust signals increase completion rates. Form field reduction and progressive disclosure reduce abandonment.
Return Rate Reduction: 3-8 Point Margin Impact
Reducing returns from 15% to 8% saves 7% of revenue directly while improving buyer relationships and pricing power.
The tactics that work include real-time phone validation to catch disconnected and invalid numbers before leads enter the pipeline, speed to delivery so leads reach buyers within seconds (contacts happen at higher rates than with aged leads), source accountability to track returns by source and pause underperformers within 48 hours of threshold violations, and buyer filter alignment to ensure lead qualification matches actual buyer acceptance criteria rather than stated filters.
The best operators treat return rate as seriously as conversion rate. Weekly return analysis by source and by buyer identifies problems before margin erosion compounds.
Float Compression: 1-2 Point Margin Impact
Reducing the timing gap between paying suppliers and collecting from buyers directly improves margins.
On the buyer side, offering a 2% discount for Net-15 payment is often cheaper than float cost at most capital rates. Requiring prepayment or deposits from new buyers eliminates float entirely for that segment. Negotiating shorter terms with established buyers in exchange for volume commitments further compresses the gap.
On the supplier side, negotiating Net-30 with publishers instead of Net-15 extends your float window. Using credit cards strategically creates 55-day float (30-day billing plus 25-day grace). Delaying discretionary payments to end of terms maximizes cash availability.
A 15-day float reduction on $500,000 monthly lead costs saves approximately $2,500-$5,000 monthly depending on capital cost.
Vertical Specialization: 3-10 Point Margin Impact
Generalist lead operations compete on price. Specialists compete on expertise and capture premium margins.
Specialization creates multiple advantages. Deeper buyer relationships yield volume commitments and pricing premium. Vertical-specific compliance expertise reduces risk and costs. Specialized sales teams command higher conversion rates. Reputation effects create inbound buyer interest.
Vertical aggregators typically earn 3-7 percentage points higher margins than generalist brokers handling the same lead types. The investment is knowledge development and relationship building over 12-24 months.
Margin Expectations by Operator Experience
Margin profiles evolve with operational maturity. Setting expectations appropriate to your stage prevents discouragement during the learning curve and overconfidence after initial success.
Year One: Breakeven to 10% Net Margin
First-year operators focus on survival, not optimization. Common margin drains include testing spend on campaigns that fail, return rates above industry average while learning quality signals, technology costs spread across small volume, and learning curve inefficiency in every process.
Realistic expectation: aim for breakeven to modest profitability while building buyer relationships, refining traffic sources, and developing operational discipline. Practitioners who expect 30% margins in year one either have exceptional advantages or are miscounting costs.
Years Two-Three: 10-20% Net Margin
Operational patterns emerge. Proven traffic sources and buyer relationships provide stability. Technology costs per lead decline as volume grows. Return rates normalize as quality processes mature.
At this stage, operators should target margin expansion of 2-3 points annually through optimization, scale growth of 30-50% annually, and building cash reserves to support continued growth.
Years Four-Plus: 15-35% Net Margin
Mature operators achieve sustainable margins through accumulated advantages: negotiating power from scale, operational efficiency from refined processes, lower risk profile from diversification, and premium positioning from reputation.
The range remains wide because business model and vertical still dominate individual execution. A mature broker (15-18% ceiling) will not reach owned media margins (40-60%) regardless of optimization skill.
Frequently Asked Questions
What is a realistic profit margin for a lead generation business?
Realistic net profit margins range from 15-18% for lead brokerage, 25-40% for direct lead generation, 20-35% for exchanges and networks, 15-25% for call centers, and 40-60% for owned media publishers. These figures represent net margins after all operating costs, not gross margins quoted in marketing materials. First-year operators should expect breakeven to 10% margins while developing operational competence.
Why is my actual margin so much lower than what industry reports suggest?
Industry reports and conference presentations typically cite gross margin (revenue minus direct lead cost) rather than net margin (revenue minus all costs). The gap between gross and net margin includes returns (8-15%), float cost (2-4%), platform and technology fees (2-5%), compliance costs (1-3%), labor allocation (5-15%), and bad debt (1-3%). These categories collectively consume 20-40% of gross margin.
How do return rates affect profit margins?
Return rates directly reduce margin by eliminating revenue from leads you already paid to acquire. A 12% return rate on $50 leads means $6 per lead sold evaporates into costs without revenue. Industry average return rates run 8-15%, but poor quality sources can push returns to 25-35%. Reducing return rates from 15% to 8% adds approximately 7 percentage points to net margin, making return rate optimization one of the highest-impact margin improvement tactics.
What working capital is needed to maintain healthy margins?
The 60-day float rule requires maintaining cash reserves equal to 60 days of operating expenses plus media spend. At $100,000 monthly media spend, this means $200,000-$300,000 in working capital. Undercapitalized operations pay premium rates for factoring or credit (24-45% effective APR), which erodes 2-4 percentage points of margin compared to well-capitalized competitors using 8-12% bank lines of credit.
How do margins change with scale?
Margins improve significantly between 10,000 and 100,000 monthly leads due to volume discounts (saving $0.40-$0.70 per lead on platforms and technology), labor efficiency (spreading fixed costs across more units), and negotiating power with suppliers and buyers. The meaningful threshold for margin improvement sits between 25,000 and 50,000 monthly leads. Above this level, most scale efficiencies have been captured.
What are the highest-margin verticals in lead generation?
Owned media publishing generates the highest margins (40-60%) once established because organic traffic eliminates ongoing acquisition costs. Among traditional lead generation verticals, legal leads support the highest margins (25-45%) due to high case values and attorney willingness to pay premium prices. Solar leads offer 20-35% margins with geographic arbitrage opportunities. Insurance leads support 15-35% margins depending on sub-vertical and business model.
How do public lead generation companies perform on margins?
Public companies provide verified benchmarks through SEC filings. MediaAlpha reported approximately 10-12% EBITDA margin in 2024, reflecting their marketplace model and growth investment. EverQuote improved to approximately breakeven after prior losses, demonstrating margin sensitivity to insurance market conditions. QuinStreet reported approximately 3.3% EBITDA margin across their diversified vertical portfolio in fiscal 2024. These figures represent mature operations at significant scale.
What is the difference between gross margin and net margin in lead generation?
Gross margin measures the spread between lead purchase cost and sale price before operating expenses: (Revenue - Cost of Leads) / Revenue. A $40 purchase and $60 sale yields 33% gross margin. Net margin measures what remains after all operating costs including returns, platform fees, compliance, labor, float cost, and bad debt. That same transaction typically yields 15-18% net margin after all costs. The 15-18 percentage point gap between gross and net margin represents real costs most marketing materials ignore.
How can I improve my lead generation margins?
The highest-impact margin improvements come from conversion rate optimization, where moving from 5% to 7% landing page conversion adds 25+ percentage points to gross margin. Return rate reduction decreases costs directly, with reducing returns from 15% to 8% adding 7 points to net margin. Float compression reduces the payment timing gap to save 1-2 points through lower capital costs. Vertical specialization lets deeper expertise command 3-10 points of pricing premium over generalist competitors.
What margins should I expect in my first year of lead generation?
First-year operators should expect breakeven to 10% net margin while developing operational competence. Learning curve costs include testing spend on failed campaigns, above-average return rates while developing quality signals, technology costs spread across small volume, and process inefficiency. Expecting 30% margins in year one sets unrealistic targets. Focus on building sustainable buyer relationships, refining traffic sources, and developing operational discipline before optimizing for margin.
Key Takeaways
Gross margin is a vanity metric. Net margin after returns, float, compliance, labor, and bad debt is what actually reaches your bank account. Expect net margins 15-25 percentage points below quoted gross margins.
Business model determines margin ceiling. Lead brokering caps at 15-18% net margin regardless of optimization. Owned media can reach 40-60%. Choose your model with margin expectations that match your capital and timeline.
Returns are the silent margin killer. A 12% return rate on $50 leads costs $6 per lead delivered. Track returns by source obsessively and pause underperformers within days, not weeks.
Scale matters more than most practitioners realize. The margin difference between 10,000 and 100,000 monthly leads can exceed 5 percentage points purely from volume discounts and labor efficiency. If margins are tight at small scale, scale or exit.
Conversion rate is the highest-leverage variable. A 2-point improvement in landing page conversion rate can add 25+ percentage points to gross margin without changing any other cost structure.
Float cost is real money. The 60-day gap between paying suppliers and collecting from buyers costs 2-4% of revenue depending on your capital cost. Undercapitalized operators pay premium rates that directly erode margin.
First-year expectations should be modest. Breakeven to 10% net margin is realistic while developing operational competence. Operators expecting 30% margins in year one are either miscounting costs or setting themselves up for disappointment.
Public company benchmarks provide reality checks. MediaAlpha, EverQuote, and QuinStreet report EBITDA margins of 6-12%, demonstrating that even scaled operations face margin compression from competitive dynamics and growth investment.
This article is adapted from The Lead Economy by industry professionals with 15+ years of operational experience. Statistics and market data current as of late 2025. Validate current conditions with your specific vendors and verify margin expectations in your target vertical before making investment decisions.