The granular financial framework that reveals which traffic sources actually make money, which destroy margin, and how to build a measurement system that transforms data into profitable decisions.
Your Aggregate Metrics Are Hiding the Truth
You know your overall revenue. You track your total costs. Your monthly P&L shows a healthy margin. But ask yourself this question: what is your actual profit on a single lead from your second-best traffic source?
If you hesitated, you have company. Most lead generation operators can tell you their revenue, their biggest expenses, even their rough margins. Ask them to decompose profitability to the individual lead and source level, and the conversation stops. This gap is not a minor blind spot. It is the gap that kills companies.
The operator running $50,000 monthly in media spend who cannot answer this question is flying blind. They might be scaling a traffic source hemorrhaging money while neglecting a source that could double their profits. They might be celebrating revenue growth while net margin erodes with every additional lead. The aggregate numbers mask the granular reality.
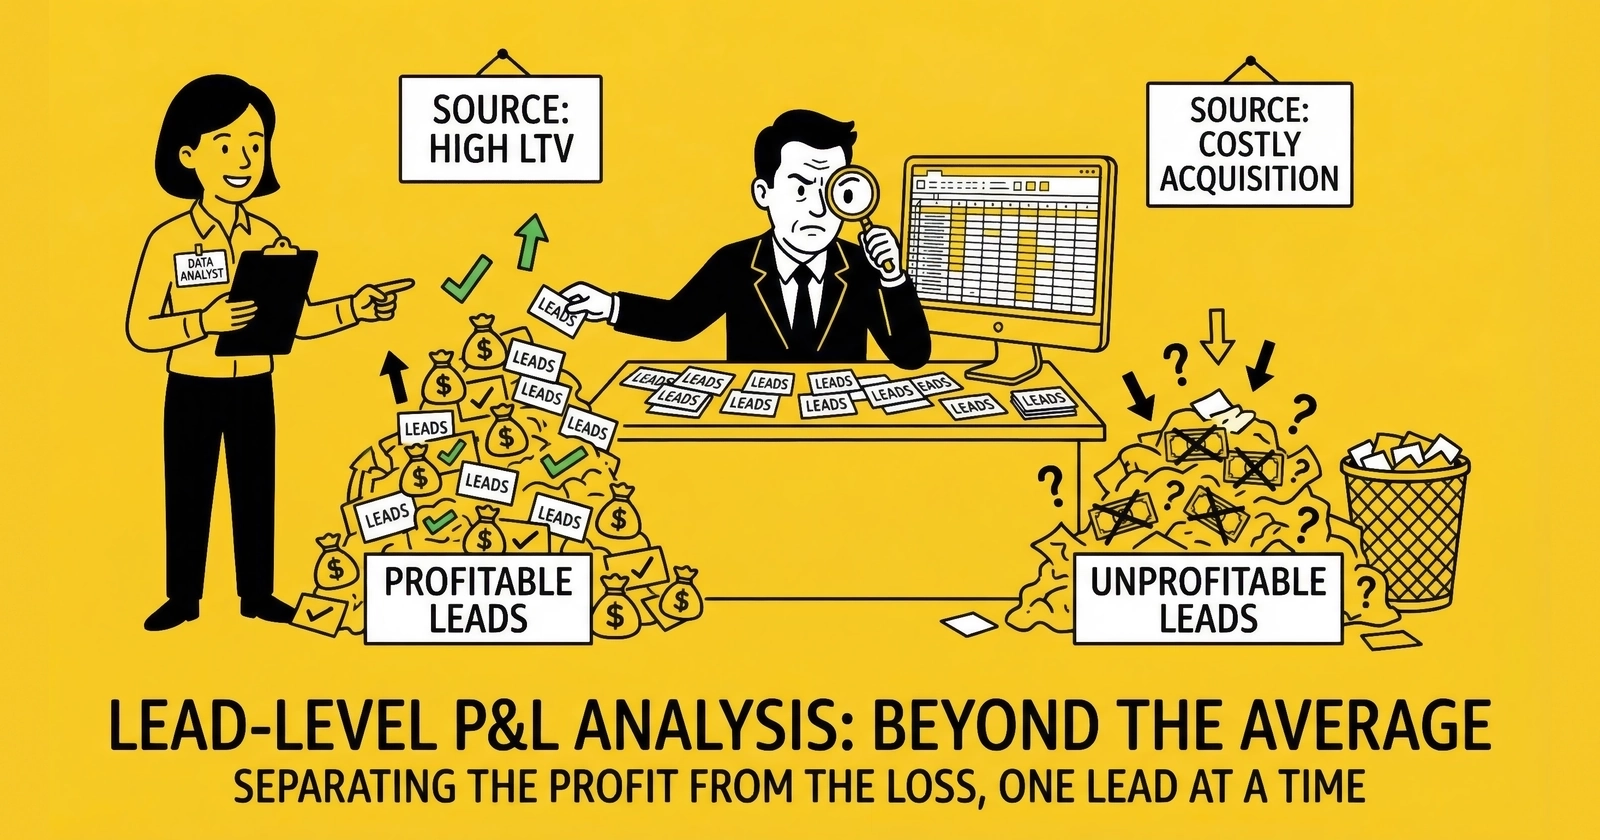
Lead-level P&L analysis solves this problem. It means understanding the financial truth of every lead you touch. Not the average. Not the aggregate. The specific, verifiable profit or loss of each lead from each source sold to each buyer. This visibility transforms lead generation from a volume game into a precision operation where every decision is grounded in unit economics.
This guide provides the complete framework for building lead-level P&L analysis capability. You will learn to construct the financial waterfall from gross revenue to net margin, allocate costs accurately, calculate contribution margin by source, and build the operational dashboards that make this analysis routine rather than exceptional.
What Is Lead-Level P&L Analysis?
Lead-level P&L analysis is the practice of calculating profit and loss at the individual lead level, then aggregating by traffic source, buyer, vertical, and time period to reveal where value is created and destroyed in your operation.
Traditional P&L analysis operates at the business level: total revenue minus total costs equals profit. This approach works for stable, homogeneous businesses. Lead generation is neither stable nor homogeneous. Your traffic sources have different costs, different quality profiles, and different conversion characteristics. Your buyers have different acceptance rates, different return patterns, and different payment terms. Averaging across these variations obscures the truth.
Lead-level analysis inverts the approach. Instead of starting with totals and working down, you start with individual transactions and build up. Each lead carries its specific acquisition cost, validation expense, platform fee, and allocated overhead. Each sale generates specific revenue, subject to specific return probability and collection timing. The result is a financial model that reveals margin at the atomic level of your business.
Those who build this capability gain several advantages:
Traffic allocation precision. When you know Source A generates $18.50 net margin per lead and Source B generates $4.20, you allocate budget accordingly. Without this visibility, you allocate by volume or surface CPL, potentially scaling sources that destroy value.
Buyer relationship clarity. When you can show Buyer X that leads from your premium sources convert at 2.3x their baseline, you negotiate from strength. When you discover Buyer Y returns 22% of leads from a specific source, you adjust routing before the relationship deteriorates.
Operational accountability. When every team member understands how their decisions affect lead-level margin, incentives align. The traffic manager optimizes for contribution, not just CPL. The operations team prioritizes speed because they see the delivery delay penalty in concrete dollars.
Strategic confidence. When you consider entering a new vertical or exiting an underperforming one, lead-level data provides the evidence. No more gut decisions about source profitability or buyer value.
The Lead-Level P&L Waterfall
Constructing a lead-level P&L requires decomposing your business economics to their smallest functional unit. The framework follows a waterfall structure, where each layer reduces gross revenue toward net margin.
Revenue Recognition
Revenue begins with the sale price of a lead. If you sell a lead for $50, that is your gross revenue. But the timing and certainty of that revenue require careful treatment.
For most lead businesses, revenue is recognized at the point of sale, typically when the lead is accepted by the buyer and delivery confirmation is received. This seems straightforward until you factor in return provisions.
If your buyer agreement includes a 72-hour return window and your historical return rate runs 12%, that $50 sale is not really $50. It is $44 in expected value at the moment of initial acceptance. The proper approach is to recognize gross revenue at point of sale, then maintain a contra-revenue reserve based on historical return rates.
This reserve should be calculated at the source-buyer level, not the aggregate business level. Your return rate from Traffic Source A selling to Buyer B might be 8%, while the same leads from Source A selling to Buyer C run 18%. Blending these into a single reserve obscures the true economics of each relationship.
For shared lead models where you sell the same lead to multiple buyers, calculate revenue per lead rather than revenue per sale. This maintains comparability across business models when evaluating source profitability.
Revenue recognition formula:
Net Revenue = Gross Sale Price x (1 - Source-Buyer Return Rate)A $50 lead with a 12% return rate yields $44 net revenue for P&L purposes.
Direct Costs
Direct costs are expenses traceable to a specific lead. In lead generation, these typically include:
Traffic acquisition cost. For leads you generate directly, this is the media spend attributable to that lead. If you spent $1,000 on Google Ads and generated 15 leads, your direct traffic cost per lead is $66.67. But this simple division obscures variation. Those 15 leads might have come from ten different ad groups with cost-per-lead ranging from $40 to $120. Lead-level analysis tracks at this granular level.
For purchased leads, the acquisition cost is your cost-per-lead from the source. Each lead carries its specific acquisition cost, not an average.
Validation and verification fees. These include email verification ($0.005 to $0.02 per check), phone validation ($0.01 to $0.05 per check), identity verification ($0.15 to $0.50 per check), and consent documentation like TrustedForm certificates ($0.15 to $0.50 per lead). A fully validated lead typically carries $0.25 to $1.00 in verification costs.
Delivery costs. API transaction fees, SMS confirmation costs if applicable, and integration-specific expenses. These are typically small per-lead (fractions of a penny to a few cents) but accumulate at scale.
Direct cost formula:
Direct Cost = Traffic Acquisition + Validation Fees + Delivery CostsFor a broker buying leads at $25, validating them, and reselling:
Traffic Acquisition: $25.00 (cost from supplier)
Validation Fees:     $0.75 (email, phone, TrustedForm)
Delivery Costs:      $0.03 (API fees)
Total Direct Cost:   $25.78
Gross Margin
Gross margin is revenue minus direct costs. This measures the transactional efficiency of your lead operations before overhead allocation.
Gross margin formula:
Gross Margin = Net Revenue - Direct Costs
Gross Margin % = (Net Revenue - Direct Costs) / Net Revenue x 100
For a broker with $44 net revenue (after return adjustment) and $25.78 direct cost:
Gross Margin = $44.00 - $25.78 = $18.22
Gross Margin % = $18.22 / $44.00 = 41.4%
Gross margin benchmarks vary significantly by business model:
- Direct generators (own traffic): 60-80% gross margin
- Brokers (buy and resell): 25-45% gross margin
- Networks (facilitate transactions): 12-20% take rate
- Platforms (SaaS fees): 85-95% gross margin
Direct generators achieve higher gross margins because their cost of goods is traffic, which typically runs 20-40% of lead value for well-optimized operations. Brokers have compressed gross margins because their cost of goods includes the entire purchase price from suppliers.
Allocated Costs
Allocated costs are overhead expenses distributed across leads based on a rational allocation methodology. These include:
Technology and platform costs. If your lead management platform costs $3,000 monthly and you process 50,000 leads, that is $0.06 per lead in platform allocation. More sophisticated operations weight this allocation by processing complexity, recognizing that leads requiring manual intervention consume more resources than leads that flow through automatically.
Labor allocation. Campaign managers, operations coordinators, and buyer relationship personnel represent fixed costs that must be spread across lead volume. A three-person operation with $15,000 monthly labor cost processing 20,000 leads allocates $0.75 per lead to labor.
Compliance overhead. Documentation systems, legal review, consent verification, and litigation reserves should be allocated across all leads. If you face one TCPA demand letter per 50,000 leads with average resolution cost of $15,000, your compliance reserve should be $0.30 per lead.
General and administrative. Office space, insurance, accounting, and other overhead distributed by lead volume.
Typical allocated cost structure:
Technology:         $0.08 per lead
Labor:              $0.75 per lead
Compliance:         $0.30 per lead
General Admin:      $0.10 per lead
Total Allocated:    $1.23 per lead
Operating Margin (Contribution Margin)
Operating margin subtracts allocated costs from gross margin. This represents the true economic contribution of each lead to the business before financing and taxes.
Operating margin formula:
Operating Margin = Gross Margin - Allocated Costs
Operating Margin % = Operating Margin / Net Revenue x 100
Continuing the broker example:
Gross Margin:       $18.22
Allocated Costs:    $1.23
Operating Margin:   $16.99
Operating Margin %: 38.6%
Operating margin warning thresholds:
- Below 10%: Dangerous zone with minimal buffer for market volatility
- 10-15%: Acceptable for growth phase, but tighten before scaling
- 15-25%: Healthy operating range for mature businesses
- 25-35%: Strong performance indicating pricing power or operational excellence
- Above 35%: Exceptional, but verify you are not under-investing in growth
Net Margin
Net margin is what remains after financing costs and taxes. For most lead businesses, if operating margin is calculated accurately, net margin will be roughly 70-80% of operating margin.
Net margin formula:
Net Margin = Operating Margin - Financing Costs - TaxesHealthy lead operations typically achieve 15-30% net margin. Businesses consistently below 15% face sustainability questions. Businesses consistently above 30% are either exceptionally positioned or under-investing in growth.
The Complete Lead-Level P&L Waterfall
Bringing together all components, here is the complete waterfall for a single lead:
LEAD-LEVEL P&L WATERFALL
                                        Example
Gross Revenue (Sale Price)              $50.00
- Return Adjustment (12%)               -$6.00
= Net Revenue                           $44.00

- Traffic Acquisition                   -$25.00
- Validation Fees                       -$0.75
- Delivery Costs                        -$0.03
= Gross Margin                          $18.22 (41.4%)

- Technology Allocation                 -$0.08
- Labor Allocation                      -$0.75
- Compliance Allocation                 -$0.30
- G&A Allocation                        -$0.10
= Operating Margin                      $16.99 (38.6%)

- Float Cost (capital)                  -$0.50
- Estimated Tax                         -$3.40
= Net Margin                            $13.09 (29.8%)
This waterfall reveals the journey from $50 gross sale to $13.09 actual profit. The difference is not accounting complexity. It is reality. Practitioners who celebrate the $50 while ignoring the waterfall eventually discover the $13.09 the hard way.
Calculating Contribution Margin by Source
The power of lead-level P&L emerges when you aggregate by traffic source. Contribution margin analysis by source reveals which channels actually generate profit versus which are subsidized by others.
The Contribution Margin Formula
Calculate contribution margin for each traffic source:
Source Contribution Margin = Revenue from Source - Direct Costs from Source - Variable Allocated CostsVariable allocated costs are the portion of overhead that scales with volume from that source. If a source requires dedicated account management, that labor cost gets allocated to that source’s contribution.
Source Contribution Analysis Example
Consider three traffic sources delivering to the same buyer at the same $65 sale price:
Source A (Facebook): $45 CPL, $0.50 validation, 8% returns
Net Revenue: $65 x (1 - 0.08) = $59.80
Direct Costs: $45.50
Contribution: $14.30 (23.9% margin)
Source B (Google): $55 CPL, $0.50 validation, 6% returns
Net Revenue: $65 x (1 - 0.06) = $61.10
Direct Costs: $55.50
Contribution: $5.60 (9.2% margin)
Source C (Native): $28 CPL, $0.50 validation, 25% returns
Net Revenue: $65 x (1 - 0.25) = $48.75
Direct Costs: $28.50
Contribution: $20.25 (41.5% margin)
This analysis reveals that Source C, despite the lowest acquisition cost and highest return rate, delivers the best contribution margin. Source A provides solid margin. Source B is marginally profitable and a candidate for reduced volume or improved buyer matching.
Without this analysis, you might have evaluated sources by CPL alone and concluded Source C was cheapest, Source A was moderate, and Source B was expensive. The contribution margin tells a different story: Source C’s low CPL more than compensates for its high returns.
The Source Performance Matrix
Build a source performance matrix that you review weekly:
| Source | Volume | CPL | Return % | Contribution | Margin % | Trend |
|---|---|---|---|---|---|---|
| 1,200 | $45 | 8% | $14.30 | 23.9% | Stable | |
| 800 | $55 | 6% | $5.60 | 9.2% | Down | |
| Native | 450 | $28 | 25% | $20.25 | 41.5% | Up |
| 350 | $22 | 18% | $17.40 | 32.5% | Stable | |
| TikTok | 200 | $38 | 35% | -$2.15 | -5.2% | New |
This matrix immediately surfaces issues. Google is marginally profitable and declining. TikTok is losing money despite moderate CPL because returns are destroying margin. Email delivers strong contribution at modest volume, suggesting scale opportunity.
Run this analysis weekly. Sources that were profitable last month may have deteriorated. Traffic quality shifts, buyer preferences change, and competition alters auction dynamics. Contribution margin by source is not a one-time analysis; it is ongoing operational intelligence.
Building the Measurement Infrastructure
Lead-level P&L analysis requires data infrastructure that connects traffic spend to lead capture to buyer delivery to payment collection. Most practitioners lack this end-to-end visibility because their systems were built for different purposes.
Required Data Connections
To calculate lead-level P&L, you need:
Traffic source data. Cost per lead by campaign, ad group, and ideally creative variant. Most ad platforms provide this, but you must tag leads at capture to maintain the connection through your pipeline.
Lead capture data. Timestamp, source attribution, validation results, and any processing costs incurred. Your landing page and form system must capture source parameters and pass them through your workflow.
Distribution data. Which buyer received the lead, at what price, with what acceptance or rejection outcome. Your lead distribution platform should provide this by default.
Return and adjustment data. Which leads were returned, when, and why. This requires either buyer reporting or your own tracking of credits and chargebacks.
Collection data. When payment was received for which invoices, enabling calculation of actual collected revenue versus invoiced revenue.
Cost allocation data. Monthly totals for technology, labor, compliance, and overhead that get divided across lead volume.
The Data Integration Challenge
The most common failure mode is disconnected data systems. Marketing tracks leads in Google Analytics. Sales tracks conversions in the CRM. Finance tracks revenue in QuickBooks. Operations tracks quality in the lead distribution platform. Nobody has a unified view connecting cost to lead to revenue to margin.
You cannot optimize what you cannot see end-to-end. Solving this requires integration work: API connections, data warehouses, or middleware platforms that unify disparate sources.
Integration approaches by scale:
At small scale (under 10,000 leads monthly), manual spreadsheet reconciliation may suffice. Export data from each system weekly and build formulas that connect the dots. This is labor-intensive but requires no technical investment.
At medium scale (10,000 to 50,000 leads monthly), invest in basic data integration. Tools like Zapier or Make can connect systems and populate a central database. A part-time analyst can maintain the reconciliation process and produce weekly reports.
At large scale (above 50,000 leads monthly), build proper data infrastructure. A data warehouse (BigQuery, Snowflake, or Redshift), ETL pipelines that pull from all source systems, and BI tools (Looker, Tableau, or Power BI) that enable ad-hoc analysis. This requires dedicated technical resources but enables the analytical sophistication that large operations demand.
Lead Tagging Best Practices
The foundation of source-level analysis is consistent lead tagging. Every lead must carry source attribution that survives the journey from capture to collection.
Required tag structure:
Source ID:     Unique identifier for traffic source
Campaign ID:   Specific campaign within source
Cost:          Actual cost to acquire this lead
Timestamp:     Capture time for decay analysis
Implement this tagging at the landing page level. UTM parameters work for web traffic. Inbound call tracking numbers work for phone leads. The key is consistency: every lead, every time, with no exceptions.
Store tags as immutable attributes. Once a lead is tagged with its source, that attribution should not change. This enables historical analysis and prevents manipulation of source performance data.
Source-Level P&L Dashboard Design
Data infrastructure enables analysis. Dashboards enable action. Design your source-level P&L dashboard to surface insights that drive decisions.
The Source Performance View
Your primary dashboard should display, for each traffic source:
Volume metrics: Daily and weekly lead volume, trend versus prior period, percent of total volume.
Cost metrics: Average CPL, CPL trend, CPL versus target.
Quality metrics: Validation pass rate, buyer acceptance rate, return rate.
Financial metrics: Net revenue per lead, contribution margin per lead, contribution margin percentage.
Trend indicators: Week-over-week change in contribution margin, flagging sources with declining profitability.
Visual Hierarchy
Arrange metrics to match decision priority:
Top row: Summary metrics across all sources. Total volume, average contribution margin, week-over-week change. This answers “how is the overall portfolio performing?”
Middle section: Source comparison table with sortable columns. Default sort by contribution margin to highlight top performers. Enable sorting by any column to answer specific questions.
Bottom section: Trend charts for top sources showing 30-day contribution margin movement. Visual patterns often reveal issues before numeric comparisons.
Alert Configuration
Configure alerts that trigger investigation before problems compound:
Margin alerts: Notify when any source’s contribution margin drops more than 20% week-over-week.
Return alerts: Notify when any source’s return rate exceeds twice its 30-day average.
Cost alerts: Notify when any source’s CPL increases more than 15% without corresponding quality improvement.
Volume alerts: Notify when any source’s volume drops more than 25% without planned reduction.
The goal is not to track everything. It is to surface exceptions that demand attention. A well-configured alert system lets you manage by exception rather than reviewing every metric daily.
Common Mistakes in Lead-Level Analysis
Operators building lead-level P&L capability frequently make predictable errors. Avoid these:
Ignoring Returns in Source Evaluation
Evaluating sources by CPL alone ignores the most variable element of lead economics. A source with $30 CPL and 25% returns is more expensive than a source with $40 CPL and 8% returns.
The math:
- Source A: $30 CPL, 25% returns, $50 sale price = ($50 x 0.75) - $30 = $7.50 margin
- Source B: $40 CPL, 8% returns, $50 sale price = ($50 x 0.92) - $40 = $6.00 margin
In this case, Source A is actually better despite higher returns because the CPL advantage compensates. But if Source A had 30% returns instead of 25%, the math reverses:
- Source A: $30 CPL, 30% returns = ($50 x 0.70) - $30 = $5.00 margin
The point is not that returns always dominate. It is that you cannot evaluate sources without factoring returns into the calculation.
Under-Allocating Overhead
Operators who allocate only direct costs to leads report inflated margins that do not survive contact with actual P&L. If your lead-level analysis shows 45% contribution margin but your business-level P&L shows 18% net margin, you are under-allocating overhead.
The test: sum your lead-level contribution margins, subtract your actual monthly overhead, and compare to your actual net profit. The numbers should approximately match. If they do not, adjust your allocation methodology.
Averaging Across Buyers
Different buyers have different economics. A lead sold to Buyer A at $60 with 6% returns is not equivalent to a lead sold to Buyer B at $55 with 12% returns.
Calculate source contribution separately for each buyer relationship. Source X might be profitable when routed to Buyer A and unprofitable when routed to Buyer B. Aggregate analysis obscures this insight.
Ignoring Float Cost
The 60-day float rule governs lead brokerage economics. You pay suppliers before buyers pay you. The cost of that capital is real.
If you are paying 12% annualized for working capital (through credit lines, factoring, or opportunity cost), a 30-day float costs 1% of the transaction value. On a $50 lead, that is $0.50. This may seem small, but at 100,000 leads monthly, it is $50,000 in financing cost.
Include float cost in your lead-level P&L. It is not optional expense; it is structural to the business model.
Delayed Return Integration
Buyers provide quality feedback in 7-14 days. If you evaluate source performance on today’s leads without incorporating return data from two weeks ago, you are optimizing on stale information.
Build return rate calculations on a rolling basis that matches your return window. If buyers have 14 days to return leads, calculate source return rates on leads delivered 14+ days ago, ensuring you have complete return data.
Advanced Analysis: Cohort and Time-Based Views
Beyond source-level snapshots, sophisticated practitioners analyze lead economics across time dimensions.
Cohort Analysis
A cohort is a group of leads sharing a common characteristic, typically acquisition date. Cohort analysis tracks how lead value evolves as leads age.
Why it matters: A lead generated on January 1 that converts on January 3 is worth more than the same lead converting on February 15. Payment timing affects cash flow. Sales velocity indicates lead quality.
Track cohorts by:
- Acquisition date: All leads captured in a specific week
- Source: All leads from a specific traffic source in a period
- Buyer: All leads sold to a specific buyer in a period
For each cohort, measure:
- Conversion rate over time: What percentage converted by day 7, day 14, day 30?
- Revenue realization: What percentage of expected revenue was collected by day 30, day 60, day 90?
- Return patterns: When do returns occur? Are they concentrated immediately after delivery or spread over the return window?
Cohort analysis reveals whether lead quality is improving or degrading over time. It identifies sources where recent cohorts underperform historical averages, signaling quality deterioration before it fully manifests in aggregate metrics.
Seasonality Adjustment
Lead economics vary by season. Insurance leads spike during enrollment periods. Solar leads peak in spring and summer. Mortgage leads fluctuate with rate cycles.
When evaluating source performance, adjust for seasonal patterns. A source that appears to be declining might simply be reflecting normal seasonal softening. A source that appears stable might actually be underperforming if the season should be driving improvement.
Build seasonal indices from historical data. If March typically delivers 115% of annual average volume and this March delivered 105%, you are actually 10% below expected performance despite absolute numbers looking acceptable.
Day and Hour Patterns
Lead quality and cost vary by time of day and day of week. Traffic acquired at 3 AM converts differently than traffic acquired at 3 PM. Weekend leads may contact at different rates than weekday leads.
Analyze contribution margin by:
- Hour of day: Identify high-margin hours for bid optimization
- Day of week: Identify patterns for budget pacing
- Day of month: Some verticals see patterns around paydays or billing cycles
This granularity enables day-parting strategies where you bid more aggressively during high-margin periods and reduce spend during low-margin periods. The same CPL at different times may yield different contribution margins.
Practical Implementation Roadmap
Building lead-level P&L capability requires investment. Here is a phased approach:
Phase 1: Foundation (Weeks 1-4)
Objective: Establish data connections and calculate first lead-level P&Ls.
Actions:
- Audit current data availability across ad platforms, CRM, distribution platform, and accounting system
- Document gaps where data exists but is not connected
- Build a spreadsheet model with all P&L waterfall components
- Manually populate one week of data to validate the model
- Calculate contribution margin by source for that week
Deliverable: First source-level contribution margin report, identifying top and bottom sources.
Phase 2: Automation (Weeks 5-8)
Objective: Reduce manual effort and increase frequency.
Actions:
- Implement automated data exports from primary systems
- Build integration logic connecting source tags to buyer outcomes
- Create a weekly automated report pulling current period data
- Establish return rate tracking by source with appropriate lag
- Configure basic alerts for margin and return rate anomalies
Deliverable: Weekly automated source-level P&L report requiring less than 30 minutes of manual work.
Phase 3: Optimization (Weeks 9-12)
Objective: Use insights to improve outcomes.
Actions:
- Review three months of source-level data and identify optimization opportunities
- Reduce or eliminate budget for consistently unprofitable sources
- Increase budget for high-margin sources with scale potential
- Adjust buyer routing based on source-buyer return rate patterns
- Establish monthly review cadence for source portfolio decisions
Deliverable: Documented margin improvement from source-mix optimization.
Phase 4: Sophistication (Ongoing)
Objective: Build advanced analytical capabilities.
Actions:
- Implement cohort tracking for temporal analysis
- Build predictive models for lead quality based on early signals
- Develop what-if scenarios for pricing and routing changes
- Create buyer-specific profitability analysis
- Integrate LTV data for customer-level ROI calculation
Deliverable: Mature analytical infrastructure supporting strategic decision-making.
Frequently Asked Questions
What is lead-level P&L analysis?
Lead-level P&L analysis is the practice of calculating profit and loss at the individual lead level, then aggregating by traffic source, buyer, vertical, and time period to reveal where value is created and destroyed. Rather than relying on aggregate metrics that average across all activity, lead-level analysis provides granular visibility into which sources, buyers, and operations actually generate profit versus which consume resources without adequate return.
How do I calculate contribution margin by source?
Calculate source contribution margin using this formula: Source Contribution Margin = Revenue from Source - Direct Costs from Source - Variable Allocated Costs. Direct costs include traffic acquisition, validation fees, and delivery costs. Variable allocated costs are the portion of overhead that scales with volume from that source. For each source, calculate net revenue (sale price adjusted for return rate), subtract total direct and variable costs, and divide by net revenue to get contribution margin percentage.
What is a good contribution margin for lead generation?
Contribution margins vary significantly by business model. Direct generators who own their traffic typically achieve 45-65% contribution margins. Brokers who buy leads and resell typically achieve 20-35% contribution margins after accounting for returns and overhead. Networks operating on take rates typically see 8-15% margins on gross transaction value. Any source consistently below 10% contribution margin deserves scrutiny; any source consistently above 35% represents either strong positioning or potential scale opportunity.
How often should I review source-level P&L?
Review contribution margin by source weekly at minimum. Traffic quality shifts, buyer preferences change, and competitive dynamics alter auction costs continuously. Weekly review enables course correction before problems compound. Monthly review is insufficient because a deteriorating source can consume significant budget over 30 days before you detect the issue. Daily review is unnecessary for most practitioners unless you are managing very high volumes or experiencing active quality problems.
How do I handle returns in source-level analysis?
Returns should be factored into net revenue calculation at the source-buyer level. Calculate return rate for each source-buyer combination based on historical data, then apply that rate to gross sale price to determine expected net revenue. If Source A has 8% returns selling to Buyer B but 15% returns selling to Buyer C, use those specific rates rather than an averaged return rate. Update return rate calculations on a rolling basis that matches your buyer return window, typically 14-30 days.
What data do I need for lead-level P&L analysis?
You need traffic source cost data (CPL by campaign and ad group), lead capture data (source attribution, validation results), distribution data (buyer assignment, acceptance status, sale price), return and adjustment data (returned leads, reasons, timing), collection data (payment receipt by invoice), and cost allocation data (monthly totals for technology, labor, compliance, overhead). The challenge is connecting these data sources, which typically reside in different systems built for different purposes.
How do I allocate overhead costs to individual leads?
Calculate total monthly overhead for each category (technology, labor, compliance, general administrative), then divide by monthly lead volume to get per-lead allocation. A more sophisticated approach weights allocation by processing complexity: leads requiring manual intervention should carry more overhead allocation than leads flowing through automatically. For labor specifically, track time by function and allocate proportionally. Whatever methodology you choose, apply it consistently and verify that summed lead-level contributions approximately match actual business-level net profit.
What is the difference between gross margin and contribution margin?
Gross margin is revenue minus direct costs (traffic acquisition, validation, delivery). Contribution margin is gross margin minus allocated overhead (technology, labor, compliance, general administrative). Gross margin measures transactional efficiency at the individual lead level. Contribution margin measures the true economic contribution of each lead to the business after all operating expenses. A lead can have positive gross margin but negative contribution margin if overhead allocation exceeds gross margin.
How do I account for float cost in lead-level P&L?
Float cost is the financing expense of paying suppliers before receiving buyer payment. Calculate it as: (Average Lead Cost) x (Average Float Days / 365) x (Annual Cost of Capital). If you buy leads at $30, float for 45 days, and your cost of capital is 12% annually, float cost per lead is approximately $0.44. Include this as a direct cost in your P&L waterfall. At scale, float cost represents meaningful margin erosion that cannot be ignored.
How do I use lead-level P&L to improve profitability?
Use source contribution margin analysis to reallocate budget from low-margin sources to high-margin sources. Identify sources where return rates are destroying margin and either reduce volume, adjust buyer routing, or work with the source to improve quality. Analyze buyer-level profitability to identify relationships worth expanding versus those requiring renegotiation. Use cohort analysis to detect quality degradation early, before it fully manifests in aggregate metrics. The goal is translating analytical insight into operational decisions that improve margin.
Key Takeaways
-
Lead-level P&L analysis reveals which traffic sources actually make money versus which destroy margin. Aggregate metrics average across profitable and unprofitable sources, obscuring the granular truth that determines business sustainability.
-
The complete P&L waterfall includes gross revenue, return adjustments, direct costs, allocated overhead, and financing costs. A $50 gross sale may yield only $13-18 in net margin after all costs are properly attributed.
-
Contribution margin by source must account for return rates, not just CPL. A $30 CPL source with 25% returns may be more expensive than a $45 CPL source with 8% returns when you calculate net contribution.
-
Track source-buyer return rates separately rather than using blended averages. The same source may perform very differently across buyer relationships due to acceptance criteria mismatches.
-
Review source contribution margins weekly to catch deterioration before it compounds. Traffic quality shifts continuously; monthly review is insufficient for proactive management.
-
Build data infrastructure that connects traffic cost to lead capture to buyer outcome to payment collection. Disconnected systems create analytical blind spots that prevent optimization.
-
Include float cost in your P&L calculation. The capital required to bridge the gap between paying suppliers and collecting from buyers has real cost that affects true margin.
-
Use lead-level analysis to make specific decisions: budget reallocation, buyer routing adjustments, source pausing, and pricing negotiation. Data without action is just expensive record-keeping.
Financial benchmarks and cost structures reflect 2024-2025 industry conditions. Platform fees, validation costs, and margin ranges vary by vertical, volume, and specific vendor relationships. Validate assumptions against your actual cost structure before making material business decisions.