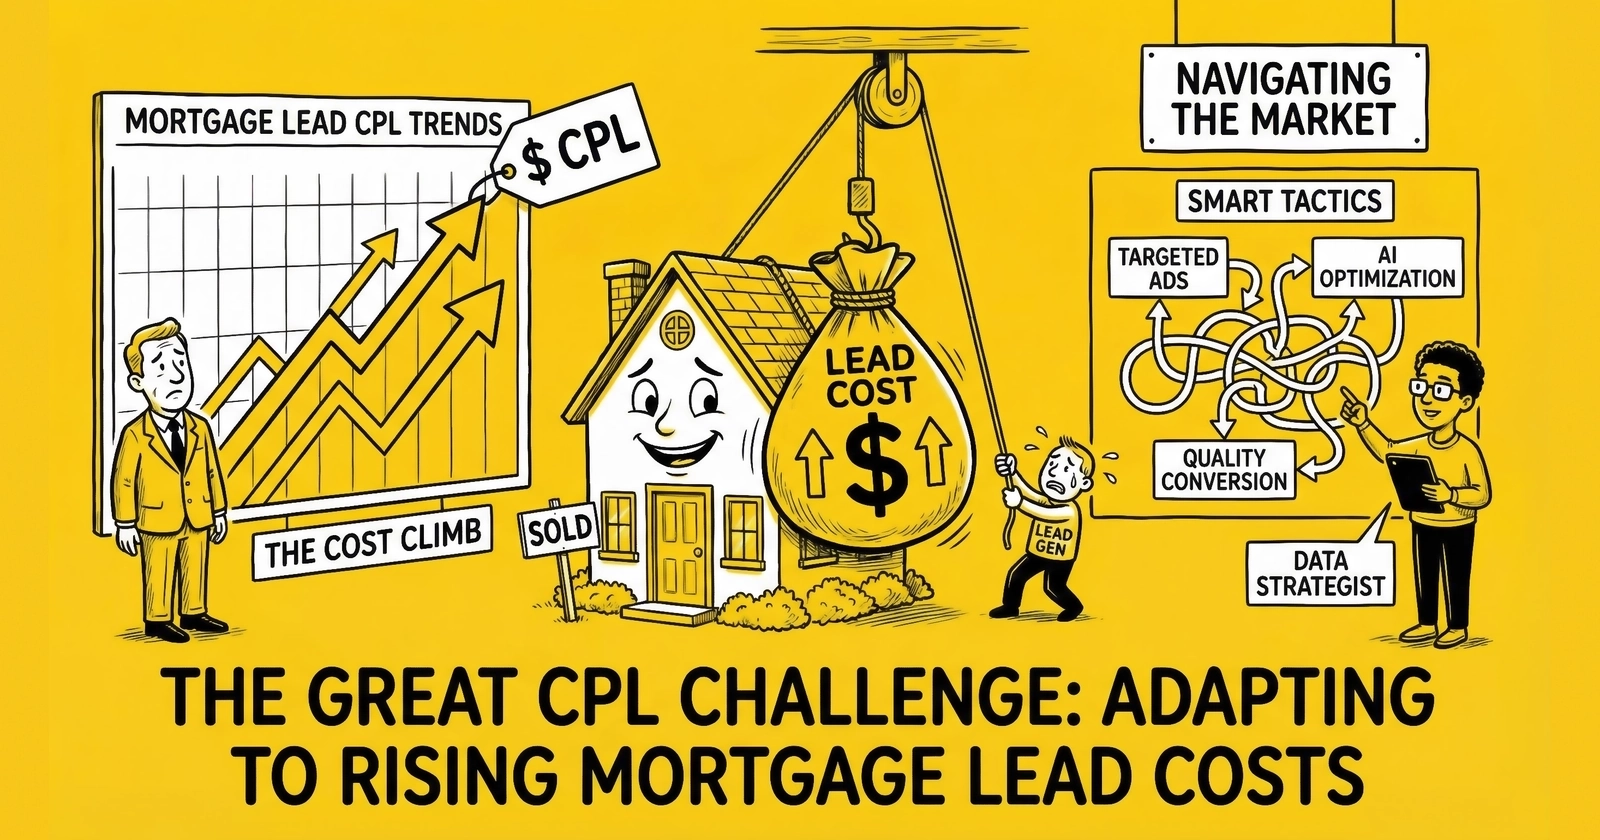
Understanding the cost per lead trajectory in mortgage lending from 2018 through 2025 – and where the numbers are heading through 2027. This comprehensive analysis provides the data foundation for budget planning, market timing, and sustainable operation design.
Why Mortgage CPL History Matters for Your Budget
The mortgage lead market operates differently from any other lead generation vertical. In insurance, CPL fluctuates with carrier appetite and market cycles. In solar, CPL trends with panel costs and incentive programs. In mortgage, CPL is dominated by a single external factor: interest rates. Understanding how CPL has responded to rate movements over the past seven years provides the foundation for realistic budget planning and operational positioning.
This analysis draws on industry data, public company filings, and operator experience to document mortgage lead CPL trends from 2018 through 2025. More importantly, it provides the framework for projecting where costs are heading through 2027 and how to position your operation accordingly.
The goal is practical: give you the numbers you need to build budgets that survive contact with reality and operational plans that account for market volatility.
Historical CPL Analysis: 2018-2025
The Pre-Pandemic Baseline (2018-2019)
Before COVID-19 disrupted every aspect of economic life, mortgage lead generation operated in what now seems like a quaint equilibrium. The 30-year fixed mortgage rate averaged 4.54% in 2018 and 3.94% in 2019 – elevated by pandemic-era standards but historically moderate.
CPL Benchmarks (2018-2019):
| Lead Type | 2018 CPL Range | 2019 CPL Range |
|---|---|---|
| Exclusive Purchase | $45-$120 | $50-$130 |
| Shared Purchase | $15-$40 | $18-$45 |
| Exclusive Refinance | $35-$90 | $40-$100 |
| Shared Refinance | $12-$30 | $15-$35 |
During this period, refinance represented approximately 30-40% of total origination volume. The market maintained reasonable balance between purchase and refinance demand, and lead generation economics reflected this equilibrium.
Key characteristics of the 2018-2019 market:
Stable competition. Major platforms including LendingTree, Bankrate, Zillow, and NerdWallet competed for consumer attention, but the market hadn’t yet seen the dramatic shifts that would come later.
Shared leads dominated. The traditional model of distributing a single consumer inquiry to multiple lenders (often 4-8 simultaneously) remained the industry standard. Exclusive leads commanded 2.5-3x premiums over shared leads.
Geographic premiums existed but were moderate. California leads commanded roughly 30-50% premiums over national averages, reflecting higher loan amounts. The extreme geographic variation seen in later years hadn’t yet developed.
Seasonal patterns were predictable. Q2 saw traditional spring buying season premiums. Q4 typically brought holiday slowdowns. These patterns followed historical norms.
The Rate Collapse and Refinance Boom (2020-2021)
The Federal Reserve’s emergency response to COVID-19 pushed mortgage rates to historic lows. The 30-year fixed rate dropped below 3% for the first time in recorded history, ultimately reaching 2.65% in January 2021.
The impact on lead generation economics was unprecedented.
Origination Volume Explosion:
| Year | Total Originations | Refinance Share | YoY Volume Change |
|---|---|---|---|
| 2019 | $2.35 trillion | 34% | Baseline |
| 2020 | $4.18 trillion | 58% | +78% |
| 2021 | $4.51 trillion | 61% | +8% |
This wasn’t incremental growth. Origination volume nearly doubled in 18 months. Every homeowner with a mortgage above 3.5% became a refinance candidate simultaneously.
CPL Paradox: Volume Up, Prices Down
Conventional economics would suggest that surging demand should increase prices. In mortgage lead generation during 2020-2021, the opposite occurred for refinance leads.
CPL Benchmarks (2020-2021):
| Lead Type | 2020 CPL Range | 2021 CPL Range |
|---|---|---|
| Exclusive Purchase | $55-$140 | $60-$160 |
| Shared Purchase | $18-$50 | $20-$55 |
| Exclusive Refinance | $25-$60 | $15-$50 |
| Shared Refinance | $8-$25 | $5-$20 |
Refinance CPL collapsed even as demand exploded. Several factors drove this counterintuitive dynamic:
Capacity constraints shifted power. Lenders couldn’t process the volume flooding their pipelines. When originators face 90-day closing backlogs, they reduce lead acquisition rather than pay premiums for more volume they cannot handle.
Consumer intent was unmistakable. At 2.65% rates, refinance economics were obvious to every homeowner. Lead generation didn’t need to create demand – demand was overwhelming. This reduced the perceived value of individual leads.
Conversion rates improved dramatically. When nearly every lead represents a qualified refinance candidate, conversion rates spike. Higher conversion tolerance allows lower CPL at sustained profitability.
Supply expanded rapidly. The obvious opportunity attracted new lead generators into the market. Competition among sellers pushed prices down even as underlying demand remained robust.
Purchase leads maintained more stable pricing during this period. While purchase volume increased modestly, it didn’t experience the same vertical spike as refinance. Purchase lead CPL rose approximately 10-20% from 2019 levels, reflecting healthy demand without the market distortions affecting refinance.
The Rate Shock and Market Collapse (2022-2023)
The Federal Reserve’s inflation response produced the most rapid mortgage rate increase in four decades. The 30-year fixed rate rose from 3.0% in January 2022 to 7.08% in October 2022 – a 400+ basis point increase in ten months.
Origination volume cratered:
| Year | Total Originations | Refinance Share | YoY Volume Change |
|---|---|---|---|
| 2022 | $2.28 trillion | 31% | -49% |
| 2023 | $1.50 trillion | 18% | -34% |
The mortgage industry contracted by two-thirds in 24 months. Lead generation economics inverted completely.
CPL Benchmarks (2022-2023):
| Lead Type | 2022 CPL Range | 2023 CPL Range |
|---|---|---|
| Exclusive Purchase | $65-$175 | $50-$165 |
| Shared Purchase | $22-$60 | $18-$50 |
| Exclusive Refinance | $70-$200 | $80-$250 |
| Shared Refinance | $25-$70 | $30-$80 |
The dynamics reversed from the boom period:
Refinance CPL spiked despite minimal demand. Qualified refinance candidates became extraordinarily scarce. Borrowers who could benefit from refinancing – those with rates above 7% – were rare because few people had financed at those levels yet. The remaining refinance activity concentrated among limited populations (VA streamline, specific credit improvement scenarios), and lead generators who could find them commanded premiums.
Purchase CPL showed initial pressure then moderated. Early 2022 saw purchase CPL increases as competition for a shrinking pool of buyers intensified. By late 2022 and into 2023, many advertisers exited the market entirely, reducing competition and allowing CPL to moderate despite lower volume.
Lender exits reshaped buying landscape. Major mortgage lenders cut headcount by 30-50%. Lead buyers disappeared or dramatically reduced spending. This reduced overall demand for leads even as supply contracted.
Geographic concentration intensified. Markets with still-viable purchase activity (Texas, Florida, parts of the Southeast) maintained lead demand. Coastal markets with severe affordability challenges saw lead buying collapse.
The Stabilization Period (2024-2025)
By 2024, the mortgage market had adjusted to sustained elevated rates. The 30-year fixed rate averaged 6.72% in 2024, ranging from 6.08% to 7.22%. This represented neither the crisis peaks of late 2022 nor a return to pre-pandemic normality.
CPL Benchmarks (2024):
| Lead Type | 2024 CPL Range | Notes |
|---|---|---|
| Exclusive Purchase | $50-$200 | Premium metro variation significant |
| Shared Purchase | $18-$60 | Shrinking segment post-consent rule |
| Exclusive Refinance | $75-$200 | Available for recent-vintage borrowers |
| Home Equity | $30-$100 | Emerging as key segment |
| Aged Leads (30-180 days) | $2-$15 | Strong demand from nurture-capable buyers |
Several developments defined the 2024 market:
Home equity emerged as the standout segment. Homeowners with sub-4% first mortgages who needed cash increasingly turned to HELOCs and second mortgages rather than disturbing their primary loans. LendingTree reported Home Equity revenue of $30.3 million in Q2 2025, growing 38% year-over-year.
Purchase activity stabilized at constrained levels. The Mortgage Bankers Association reported purchase applications rising 15% year-over-year in Q2 2025 – growth, but from depressed baselines.
Refinance showed tentative recovery. Borrowers who financed at 2022-2023 peak rates (7%+) found savings opportunities as rates declined toward 6.5%. Industry projections suggested refinance volume would grow 38% in 2025 versus 2024, though from a low base.
Consent requirements reshaped economics. Though the FCC’s one-to-one consent rule was vacated by the Eleventh Circuit in January 2025, industry practice shifted significantly. Many sophisticated buyers now require one-to-one consent regardless of regulatory minimums, compressing traditional shared lead distribution models.
2025 CPL Benchmarks (Current Market):
| Lead Type | Current CPL Range | Trend Direction |
|---|---|---|
| Exclusive Purchase | $50-$200+ | Stable |
| Exclusive Refinance | $75-$200 | Moderating slightly |
| Home Equity | $30-$100 | Growing demand |
| Aged Leads (30-180 days) | $12-$25 | Strengthening |
The Rate Environment Impact: Quantified Analysis
The Correlation Pattern
Analysis of CPL movements against rate changes reveals a consistent pattern, though the relationship is not perfectly linear.
Rate Change Impact on Refinance CPL:
| Rate Movement | Typical CPL Response | Timeline |
|---|---|---|
| -50 bps (rates fall) | -15% to -25% CPL | 2-4 weeks lag |
| -100 bps (rates fall) | -30% to -45% CPL | 4-8 weeks lag |
| +50 bps (rates rise) | +20% to +35% CPL | Immediate to 2 weeks |
| +100 bps (rates rise) | +40% to +60% CPL | 1-4 weeks |
The asymmetry is notable: CPL rises faster when rates increase than it falls when rates decrease. This reflects the structural reality that refinance candidate pools contract immediately when rates rise but expand more gradually when rates fall (borrowers take time to recognize and act on opportunities).
Rate Change Impact on Purchase CPL:
Purchase CPL shows much weaker rate correlation:
| Rate Movement | Typical CPL Response | Timeline |
|---|---|---|
| -50 bps (rates fall) | -3% to -8% CPL | 4-8 weeks lag |
| -100 bps (rates fall) | -8% to -15% CPL | 8-12 weeks lag |
| +50 bps (rates rise) | +3% to +8% CPL | 2-6 weeks |
| +100 bps (rates rise) | +8% to +15% CPL | 4-8 weeks |
Purchase decisions respond to affordability changes, but life circumstances – job changes, family growth, relocations – dominate purchase timing regardless of rates.
Volume-CPL Relationship
Beyond rates, origination volume itself affects CPL through capacity and competition dynamics:
High Volume Environments (>$3T annual originations):
- Lender capacity constraints limit lead absorption
- Competition among lead sellers intensifies
- CPL tends to compress despite strong demand
- Quality becomes primary differentiator
Low Volume Environments (<$2T annual originations):
- Lenders compete aggressively for limited opportunity
- Lead sellers reduce capacity, concentrating supply
- CPL can rise despite weak underlying demand
- Volume commitments and relationship value increase
Moderate Volume Environments ($2T-$3T):
- Market operates near equilibrium
- CPL responds more directly to rate movements
- Geographic and quality differentials become meaningful
- Sustainable operational planning is possible
Current 2025 conditions approximate the moderate volume environment, with estimated annual originations around $1.8-2.1 trillion and trending toward the $2T-$2.5T range if rate moderation continues.
Geographic CPL Analysis
Metro-Level Variation
Geographic CPL variation in mortgage exceeds most other lead generation verticals. High-cost markets with large loan amounts command significant premiums.
CPL Index by Metro (100 = National Average):
| Metro Area | Purchase CPL Index | Refinance CPL Index | Median Home Price |
|---|---|---|---|
| San Francisco Bay Area | 180-220 | 160-200 | $1.3M+ |
| Los Angeles Metro | 150-180 | 140-170 | $900K+ |
| New York Metro | 140-170 | 130-160 | $650K+ |
| Seattle Metro | 130-160 | 125-150 | $700K+ |
| Miami Metro | 125-150 | 120-140 | $550K+ |
| Denver Metro | 115-135 | 110-130 | $600K+ |
| Dallas-Fort Worth | 100-115 | 95-110 | $400K |
| Phoenix Metro | 100-115 | 95-110 | $450K |
| Atlanta Metro | 90-105 | 85-100 | $380K |
| Chicago Metro | 85-100 | 80-95 | $350K |
| Cleveland/Midwest | 70-85 | 65-80 | $220K |
The premium in high-cost markets reflects several factors:
Loan amount economics. A lender earning $5,000-$10,000 per funded loan in California can pay significantly more per lead than one earning $2,500-$4,000 in Ohio.
Competition density. Coastal metros attract more lenders and more sophisticated marketing operations, intensifying competition.
Consumer research behavior. Higher-stakes transactions (larger loans) prompt more extensive research, increasing lead generation touchpoints.
State-Level Regulatory Impact
State regulatory environments also affect CPL through compliance cost and market access:
Higher CPL States (regulatory complexity adds cost):
- California: Extensive disclosure requirements, active enforcement
- New York: Department of Financial Services oversight, advertising restrictions
- Massachusetts: Unique regulations, smaller market size
- Florida: Hurricane-related insurance complexity affecting purchase decisions
Lower CPL States (regulatory efficiency):
- Texas: Business-friendly environment, strong volume
- Arizona: Streamlined licensing, growing markets
- Colorado: Efficient regulation, healthy market
- Utah: Favorable business environment
Forecasting CPL: 2025-2027 Projections
Rate Environment Scenarios
CPL forecasting requires rate environment assumptions. Current Federal Reserve guidance and market expectations suggest three plausible scenarios:
Scenario A: Moderate Rate Decline (Base Case)
The 30-year fixed rate gradually declines from current levels (approximately 6.2-6.5%) to the 5.5-6.0% range by late 2026 and potentially 5.0-5.5% by 2027.
Probability: 45%
CPL Projections (Scenario A):
| Year | Purchase CPL | Refinance CPL | Home Equity CPL |
|---|---|---|---|
| Late 2025 | $55-$180 | $65-$175 | $30-$95 |
| 2026 | $50-$165 | $45-$130 | $35-$100 |
| 2027 | $45-$150 | $35-$100 | $40-$110 |
In this scenario, refinance CPL declines as qualified candidates expand. Purchase CPL moderates as affordability improves. Home equity CPL may increase as the product becomes less differentiated (more competing options for cash-out needs).
Scenario B: Rate Plateau (Elevated Stability)
Rates remain in the 6.0-6.8% range through 2026 and into 2027, neither declining meaningfully nor rising further.
Probability: 35%
CPL Projections (Scenario B):
| Year | Purchase CPL | Refinance CPL | Home Equity CPL |
|---|---|---|---|
| Late 2025 | $55-$190 | $75-$200 | $30-$95 |
| 2026 | $55-$185 | $70-$190 | $30-$100 |
| 2027 | $50-$175 | $65-$175 | $30-$105 |
This scenario represents extended current conditions. CPL remains stable with minor fluctuations. Practitioners who have sized appropriately for current conditions maintain viability.
Scenario C: Rate Increase (Further Tightening)
Inflation persistence or other factors push rates back toward 7.0-7.5%, erasing recent moderation.
Probability: 20%
CPL Projections (Scenario C):
| Year | Purchase CPL | Refinance CPL | Home Equity CPL |
|---|---|---|---|
| Late 2025 | $60-$200 | $90-$250 | $25-$85 |
| 2026 | $55-$180 | $100-$275+ | $25-$90 |
| 2027 | $50-$170 | $110-$300+ | $25-$90 |
In this scenario, refinance CPL spikes as qualified candidates become extremely rare. Purchase CPL initially rises on scarcity then moderates as advertisers exit. Home equity CPL may decline as the segment becomes one of few viable products, attracting increased competition.
Structural Factors Affecting All Scenarios
Regardless of rate environment, several structural factors will influence CPL through 2027:
One-to-One Consent Impact
Though the FCC’s one-to-one consent rule was vacated by the Eleventh Circuit in January 2025, buyer-driven consent preferences have reshaped market structure. Shared leads – historically 40-60% of market volume – have largely disappeared or restructured as comparison shopping experiences. This concentrates demand on exclusive leads, supporting price floors even in weak demand environments.
Platform Vertical Integration
Zillow’s increasing emphasis on Zillow Home Loans (purchase volume grew 125% in Q2 2024, with Q2 2025 exceeding $1.1 billion) reduces lead inventory available to third-party lenders. Similar trends at other major platforms constrain supply growth.
Technology and Response Time Competition
As lead response time requirements intensify (sub-minute response increasingly necessary for competitive outcomes), operators without technology infrastructure exit. This concentrates lead generation among more sophisticated practitioners, potentially supporting pricing.
Lender Consolidation
Continued mortgage lender consolidation reduces the number of lead buyers while concentrating purchasing power. Large buyers negotiate more aggressively on price but provide volume stability.
Budget Planning Framework
Calculating Your Target CPL
Your sustainable CPL depends on downstream economics, not industry averages. Use this framework:
For Lead Generators/Sellers:
Maximum Acquisition CPL = Lead Sale Price x (1 - Target Margin) - Hidden Costs
Example calculation:
- Lead sale price: $125 (exclusive purchase)
- Target margin: 25%
- Available for acquisition: $125 x 0.75 = $93.75
- Hidden costs (returns 10%, compliance $0.50, platform $0.25, float $0.50): $14.25
- Maximum acquisition CPL: $93.75 - $14.25 = $79.50
For Lead Buyers/Originators:
Maximum Lead CPL = LTV per Funded Loan x Lead-to-Funded Conversion Rate x Target ROI Factor
Example calculation:
- LTV per funded mortgage: $5,500
- Lead-to-funded conversion: 3.5%
- Target 3:1 LTV:CAC ratio (0.33 factor)
- Maximum sustainable CPL: $5,500 x 0.035 x 0.33 = $63.53
Building Rate-Sensitive Budgets
Given rate environment uncertainty, build budgets that accommodate range rather than point estimates.
Conservative Budget Framework:
| Budget Component | Scenario A (Rates Fall) | Scenario B (Plateau) | Scenario C (Rates Rise) |
|---|---|---|---|
| Refinance % of budget | 40% | 25% | 10% |
| Purchase % of budget | 35% | 45% | 55% |
| Home Equity % of budget | 20% | 25% | 30% |
| Reserve allocation | 5% | 5% | 5% |
| Average blended CPL target | $55-$75 | $65-$90 | $55-$80 |
| Volume expectation | +30% base | Baseline | -20% base |
The key insight: size your fixed costs for the most conservative scenario while maintaining infrastructure to capture upside if favorable conditions emerge.
Monthly Budget Variance Planning
Mortgage CPL exhibits higher monthly variance than most verticals. Build budgets that accommodate:
Expected Monthly CPL Variance: +/- 15-25%
Factors driving monthly variance:
- Rate movements within the month
- Seasonal patterns (spring buying season, holiday slowdowns)
- Competitive dynamics (major advertiser entries/exits)
- Platform algorithm changes
Plan for this variance by:
- Maintaining 20-30% budget flexibility month-to-month
- Setting rolling 90-day CPL targets rather than monthly targets
- Tracking 7-day CPL trends to identify emerging patterns
- Reserving 10-15% of budget for opportunistic spending during favorable windows
Competitive Positioning and CPL
Source-Level CPL Analysis
Not all lead sources deliver equivalent CPL. Understanding source economics enables strategic allocation:
Typical CPL by Source Type:
| Source Type | CPL Range | Quality Profile | Best Use Case |
|---|---|---|---|
| Google Search (non-branded) | $80-$200 | Highest intent | Core volume, premium leads |
| Google Search (branded) | $25-$60 | Existing awareness | Capture existing demand |
| Comparison Platforms (Bankrate, NerdWallet) | $75-$150 | Research-stage intent | Quality at scale |
| Marketplace (LendingTree) | $60-$120 | Active shopping | Volume with competition |
| Facebook/Meta | $35-$80 | Lower intent | Top-of-funnel, requires nurture |
| Display/Programmatic | $25-$70 | Awareness stage | Retargeting primarily |
| SEO/Organic | $15-$45 | Variable intent | Long-term cost reduction |
| Content Marketing | $20-$50 | Education-stage | Sustainable pipeline |
| Aged Leads | $2-$25 | Previously expressed intent | Nurture-capable operations |
Blended CPL Optimization
Sustainable operations blend sources to achieve target economics while maintaining quality:
Target Source Mix for Balanced Operation:
| Source Category | Budget Allocation | Expected CPL Contribution |
|---|---|---|
| High-intent paid (Search, Platforms) | 45-55% | $80-$140 average |
| Mid-intent paid (Social, Display) | 20-30% | $40-$70 average |
| Organic/Content | 15-25% | $20-$45 average |
| Aged/Nurture | 5-10% | $10-$25 average |
| Blended Result | 100% | $55-$85 average |
The margin between blended CPL and lead sale price determines viability. Operations achieving $65 blended CPL selling at $110 have sustainable margin. Operations achieving $95 blended CPL selling at $110 operate on razor-thin margins that evaporate with any adverse development.
Seasonal CPL Patterns
Intra-Year Variation
Mortgage lead CPL follows predictable seasonal patterns overlaid on rate-driven trends. Understanding these patterns enables strategic budget allocation.
Purchase Lead Seasonality:
| Period | CPL Impact | Volume Impact | Strategic Implication |
|---|---|---|---|
| January-February | -5% to -10% | -15% to -20% | Lower competition, budget efficiency |
| March-May | +10% to +20% | +25% to +35% | Peak season, accept higher CPL |
| June-August | Baseline | Baseline | Stable, optimize |
| September-October | -5% to -10% | -10% to -15% | Pre-holiday softening |
| November-December | -10% to -15% | -20% to -30% | Holiday slowdown, lowest CPL |
Spring buying season (March-May) creates predictable CPL pressure. Home-shopping activity peaks, lenders compete for limited buyer attention, and advertisers who can tolerate seasonal premiums capture disproportionate share. December offers the lowest competition and best CPL efficiency, though volume contracts significantly.
Refinance Lead Seasonality (Rate-Dependent):
Refinance seasonality is less pronounced than purchase because rate-driven demand dominates. However, modest patterns exist:
| Period | CPL Impact | Notes |
|---|---|---|
| Q1 | +5% to +10% | Tax refund cash-out activity |
| Q2-Q3 | Baseline | Rate-driven fluctuation dominates |
| Q4 | -5% to -10% | Holiday distraction reduces competition |
The key insight: rate movements overwhelm seasonal patterns for refinance. A 50 basis point rate drop in December will increase refinance activity far more than holiday seasonality reduces it.
Day-of-Week Patterns
Weekly patterns create micro-optimization opportunities:
Higher CPL Days (Tuesday-Thursday):
- Peak advertising competition
- Highest lead volume
- Best conversion rates
- Premium pricing appropriate
Lower CPL Days (Saturday-Sunday):
- Reduced competition
- Lower volume
- Conversion rates depend on staffing
- CPL efficiency if you can convert weekend leads
Monday Transition:
- Weekend lead backlog creates morning competition
- Afternoon normalizes to weekday patterns
Operations with strong weekend staffing can capture leads at 15-25% lower CPL than weekday averages. However, this requires operational infrastructure most mortgage originators lack.
Operational Implications
Building CPL-Resilient Operations
The historical volatility of mortgage CPL demands operational structures that accommodate wide variance. Practitioners who built for boom conditions failed when cycles turned. Those who sized for drought conditions missed opportunities when volume returned.
Fixed Cost Discipline
Size your fixed cost base for moderate volume scenarios. Personnel, office space, and technology commitments should support operations at 70-80% of peak capacity without stress. Maintain the ability to scale variable costs (ad spend, contractor capacity) up or down as conditions warrant.
Rule of thumb: Fixed costs should not exceed 40% of revenue at your lowest realistic volume scenario. If they do, restructure before the market forces restructuring.
Cash Reserve Requirements
Mortgage lead businesses require larger cash reserves than other verticals due to CPL volatility. Recommended minimums:
| Operation Size | Cash Reserve Target |
|---|---|
| <1,000 leads/month | 4-6 months operating expenses |
| 1,000-5,000 leads/month | 6-9 months operating expenses |
| >5,000 leads/month | 9-12 months operating expenses |
These reserves provide runway through adverse CPL environments without forced restructuring.
Buyer Relationship Portfolio
Diversify across buyer types to reduce concentration risk:
- No single buyer should exceed 30% of volume
- Maintain relationships across lender types (banks, brokers, credit unions)
- Geographic diversity across buyer bases
- Product type diversity (some buyers prefer purchase, others refinance)
Concentration with 1-2 large buyers creates catastrophic risk if those buyers exit the market or cut lead spend.
Technology Investment Priorities
CPL efficiency increasingly depends on technology infrastructure:
Response Time Infrastructure
Leads contacted within one minute convert at 391% higher rates. Technology enabling sub-minute response provides compound CPL advantage: same lead cost, higher conversion, lower effective CPL per closed loan.
Required capabilities:
- Real-time lead delivery (push notifications, SMS alerts)
- Auto-dialer integration for immediate outbound
- Automated text/email response sequences
- Round-robin routing with escalation rules
- Mobile connectivity for extended hours
Conversion Optimization Platform
Each percentage point improvement in landing page conversion directly reduces effective CPL. A 7% to 9% conversion improvement at $5 CPC reduces CPL from $71 to $56 – 21% reduction.
Required capabilities:
- A/B testing infrastructure for continuous optimization
- Page speed optimization (sub-2-second load)
- Mobile-responsive design (60%+ of traffic)
- Form abandonment analytics
- Multi-step form capability
Lead Quality Scoring
Not all leads at the same CPL deliver equivalent value. Scoring systems that predict conversion enable:
- Selective bid optimization (pay more for high-score leads)
- Routing optimization (best leads to best closers)
- Return rate reduction through quality filtering
- Source-level ROI measurement
Required capabilities:
- Real-time scoring at lead receipt
- Historical outcome data integration
- Source-level quality tracking
- Buyer feedback incorporation
Margin Protection Strategies
CPL increases cannot always pass through to higher lead prices. Protecting margins during adverse CPL environments requires proactive measures.
Return Rate Management
Every 1% improvement in return rate effectively reduces CPL by 1% of lead price. On a $100 lead with 12% returns, reducing returns to 10% saves $2/lead – equivalent to 2% CPL reduction.
Focus areas:
- Source-level return tracking
- Quality threshold enforcement
- Buyer-specific filtering optimization
- Consent documentation completeness
Operational Efficiency
Processing cost reduction directly improves margin at any CPL level:
- Automation of manual processes
- Self-service buyer portals
- Streamlined quality review
- Integrated compliance documentation
Target: reduce per-lead processing cost by 10-20% annually through efficiency gains.
Pricing Discipline
Resist the temptation to chase volume at unsustainable margins during competitive periods. Buyers who demand pricing below your breakeven will not become profitable when conditions improve.
Know your floor: the minimum lead price at which you operate sustainably given your CPL and cost structure. Walk away from business that falls below this floor regardless of volume promises.
Frequently Asked Questions
Q1: What is the current average CPL for mortgage leads in 2025?
Exclusive purchase leads currently range from $50 to $200+ depending on geography, credit quality, and loan amount, with premium metros (California coastal, New York) commanding the high end and Midwest markets at the low end. Exclusive refinance leads trade at $75 to $200 for qualified candidates, with supply constrained by limited in-the-money borrowers. Home equity leads run $30 to $100 for qualified prospects and represent a growing segment. The national weighted average for exclusive mortgage leads falls approximately in the $85-$120 range, though this average masks significant variation.
Q2: How have mortgage lead costs changed over the past five years?
Mortgage CPL has exhibited the highest volatility of any major lead generation vertical since 2020. During the 2020-2021 refinance boom, CPL collapsed despite surging demand – refinance leads traded as low as $15-$25 for exclusive and $5-$15 for shared as supply overwhelmed lender capacity. When rates spiked in 2022-2023, refinance CPL surged to $80-$250+ despite minimal demand because qualified candidates became extremely scarce. Purchase CPL has been more stable, ranging from $50-$200 throughout the period with relatively modest fluctuations. The current 2025 market represents stabilization at elevated levels relative to pre-pandemic norms.
Q3: How do interest rates affect mortgage lead CPL?
Interest rates drive mortgage CPL through their impact on refinance economics and, to a lesser extent, purchase affordability. When rates fall, refinance candidate pools expand rapidly, increasing lead supply and generally reducing CPL despite higher demand. When rates rise, qualified refinance candidates disappear, creating scarcity that increases CPL. The relationship is asymmetric: CPL rises faster on rate increases (immediate pool contraction) than it falls on rate decreases (gradual borrower recognition and action). Purchase CPL shows weaker rate correlation since purchase decisions depend primarily on life circumstances rather than rate optimization.
Q4: What CPL should I budget for mortgage leads in 2026?
Budget planning for 2026 requires scenario-based thinking given rate environment uncertainty. In a moderate rate decline scenario (rates reaching 5.5-6.0%), expect purchase CPL of $50-$165 and refinance CPL of $45-$130 as conditions normalize. In a rate plateau scenario (rates staying at 6.0-6.8%), expect purchase CPL of $55-$185 and refinance CPL of $70-$190, essentially extending current conditions. In a rate increase scenario (rates rising to 7.0-7.5%), expect purchase CPL of $55-$180 and refinance CPL of $100-$275+ as qualified candidates become extremely scarce. Size your operation for the plateau scenario while maintaining flexibility to scale with rate declines.
Q5: Why is there such wide geographic variation in mortgage lead CPL?
Geographic CPL variation reflects loan amount economics. A San Francisco mortgage averaging $1.3 million generates substantially more origination revenue than a Cleveland mortgage averaging $200,000 – often 4-6x more per loan. Lenders can therefore pay proportionally more per lead in high-cost markets. Additionally, competition density varies geographically, with coastal metros attracting more sophisticated advertisers. California leads command 80-120% premiums over national averages, while Midwest leads trade at 15-30% discounts. This variation creates arbitrage opportunities for operators who can efficiently serve multiple markets.
Q6: How has the one-to-one consent rule affected mortgage lead CPL?
Though the FCC’s one-to-one consent rule was vacated by the Eleventh Circuit in January 2025, buyer-driven one-to-one consent preferences have fundamentally reshaped mortgage lead economics. Traditional shared leads – where the same consumer inquiry went to 4-8 lenders simultaneously – have largely disappeared or restructured as comparison shopping experiences with explicit lender-by-lender consent. This concentrates demand on exclusive leads, which now represent the compliant default rather than a premium upgrade. Exclusive lead CPL has remained stable or increased slightly as supply tightened. The shared lead segment has contracted dramatically, with remaining shared inventory requiring more complex consent structures that increase cost. Overall market CPL has increased approximately 10-20% attributable to consent rule effects.
Q7: What is the difference between purchase and refinance lead CPL trends?
Purchase and refinance leads operate on fundamentally different economics. Purchase CPL maintains relative stability ($50-$200 range throughout rate cycles) because purchase decisions depend on life circumstances rather than rate optimization. Refinance CPL exhibits extreme volatility – from $15-$50 during boom periods when supply overwhelms capacity to $80-$250+ during droughts when qualified candidates are scarce. Purchase demand is rate-influenced (affordability) but not rate-dependent (people buy homes regardless). Refinance demand is almost entirely rate-dependent – borrowers only refinance when meaningful savings are available. Budget for purchase as your stable baseline and treat refinance as opportunity when conditions permit.
Q8: How should I forecast mortgage lead costs for budget planning?
Build scenario-based budgets rather than single-point forecasts. Assign probability weights to rate environment scenarios (moderate decline, plateau, increase) and calculate CPL expectations for each. Size your fixed costs for the most conservative scenario while maintaining infrastructure to capture upside. Use rolling 90-day CPL targets rather than monthly targets to smooth variance. Maintain 20-30% budget flexibility month-to-month. Track 7-day CPL trends to identify emerging patterns early. Reserve 10-15% of budget for opportunistic spending during favorable windows. The goal is operational resilience across scenarios, not precise prediction of unpredictable rate movements.
Q9: What sources offer the lowest mortgage lead CPL?
Organic search and content marketing offer the lowest effective CPL ($15-$45) but require 6-18 months of investment before producing meaningful volume. Aged leads ($2-$25) provide immediate low-cost inventory for operations with nurture capability. Facebook/Meta advertising delivers leads at $35-$80 but with lower intent requiring longer sales cycles. Google Search commands the highest CPL ($80-$200 for non-branded) but provides highest-intent leads with best conversion rates. Comparison platforms (Bankrate, NerdWallet) balance quality and cost at $75-$150. Sustainable operations blend sources to achieve target blended CPL while maintaining quality – typically 45-55% high-intent paid, 20-30% mid-intent paid, 15-25% organic, and 5-10% aged/nurture.
Q10: How can I reduce my mortgage lead CPL without sacrificing quality?
Conversion rate optimization offers the highest leverage. Each percentage point improvement in landing page conversion directly reduces effective CPL. A 7% conversion rate at $5 CPC yields $71 CPL; improving to 9% conversion at the same CPC yields $56 CPL – a 21% reduction. Beyond conversion optimization: build organic traffic assets (SEO, content) that produce leads at $15-$45 effective CPL to blend down overall costs. Implement aged lead programs that recapture value from previously uncontacted leads. Refine geographic targeting to concentrate on markets where your buyer relationships support pricing. Improve speed-to-contact to maximize conversion from existing lead flow. Reduce return rates through better qualification – returns at 10-12% add $8-$15 to effective CPL on $75-$125 leads.
Key Takeaways
-
Mortgage CPL has exhibited the highest volatility of any major lead generation vertical since 2020. Refinance CPL swung from $15-$25 during the 2020-2021 boom to $80-$250+ during the 2022-2023 drought. Understanding this historical pattern is essential for sustainable budget planning.
-
The current 2025 market represents stabilization at elevated levels. Exclusive purchase leads trade at $50-$200+ depending on geography. Exclusive refinance leads range $75-$200 for qualified candidates. Home equity leads at $30-$100 represent a growing segment that performs well in elevated rate environments.
-
Interest rates drive CPL through their impact on refinance economics. When rates fall, CPL tends to decline despite higher demand (supply overwhelms capacity). When rates rise, CPL spikes despite lower demand (qualified candidates become scarce). The relationship is asymmetric: CPL rises faster on rate increases than it falls on decreases.
-
Geographic variation in mortgage CPL exceeds most other verticals. California coastal metros command 80-120% premiums over national averages (CPL index 180-220), while Midwest markets trade at 15-30% discounts (index 70-85). This reflects loan amount economics and competition density.
-
Buyer-driven one-to-one consent requirements have increased market CPL by 10-20%. Traditional shared leads have largely disappeared, concentrating demand on exclusive leads. This structural change will persist regardless of rate environment.
-
Build scenario-based budgets rather than single-point forecasts. Rate decline, plateau, and increase scenarios produce meaningfully different CPL outcomes. Size fixed costs for conservative scenarios while maintaining infrastructure to capture upside.
-
Blended CPL optimization determines operational viability. Sustainable operations achieve $55-$85 blended CPL through strategic source mixing: 45-55% high-intent paid, 20-30% mid-intent paid, 15-25% organic/content, and 5-10% aged/nurture.
-
Conversion rate optimization offers the highest leverage for CPL reduction. A 2-percentage-point improvement in landing page conversion reduces effective CPL by 20-30% – more impact than most media buying optimizations.
-
2026-2027 CPL depends on rate environment trajectory. Moderate rate decline (base case, 45% probability) would bring refinance CPL to $35-$100 and purchase CPL to $45-$150 by 2027. Rate plateau (35% probability) extends current conditions. Rate increase (20% probability) pushes refinance CPL above $100-$300.
-
Home equity leads offer rate-cycle resilience. Homeowners with locked-in low first mortgages who need cash will continue using HELOCs and second mortgages regardless of primary mortgage rate environment. This segment provides operational stability across rate scenarios.
Market data and projections current as of December 2025. Mortgage rates, lead pricing, and market conditions change continuously. Validate current conditions through industry sources before making significant investment decisions. CPL ranges represent typical market conditions; your specific results will vary based on geography, lead quality, buyer relationships, and operational execution.