Credit scores determine mortgage lead economics more than any other single variable. Understanding tier-based strategies transforms how lead generators target, price, and distribute mortgage leads.
The Credit Score Imperative in Mortgage Lead Generation
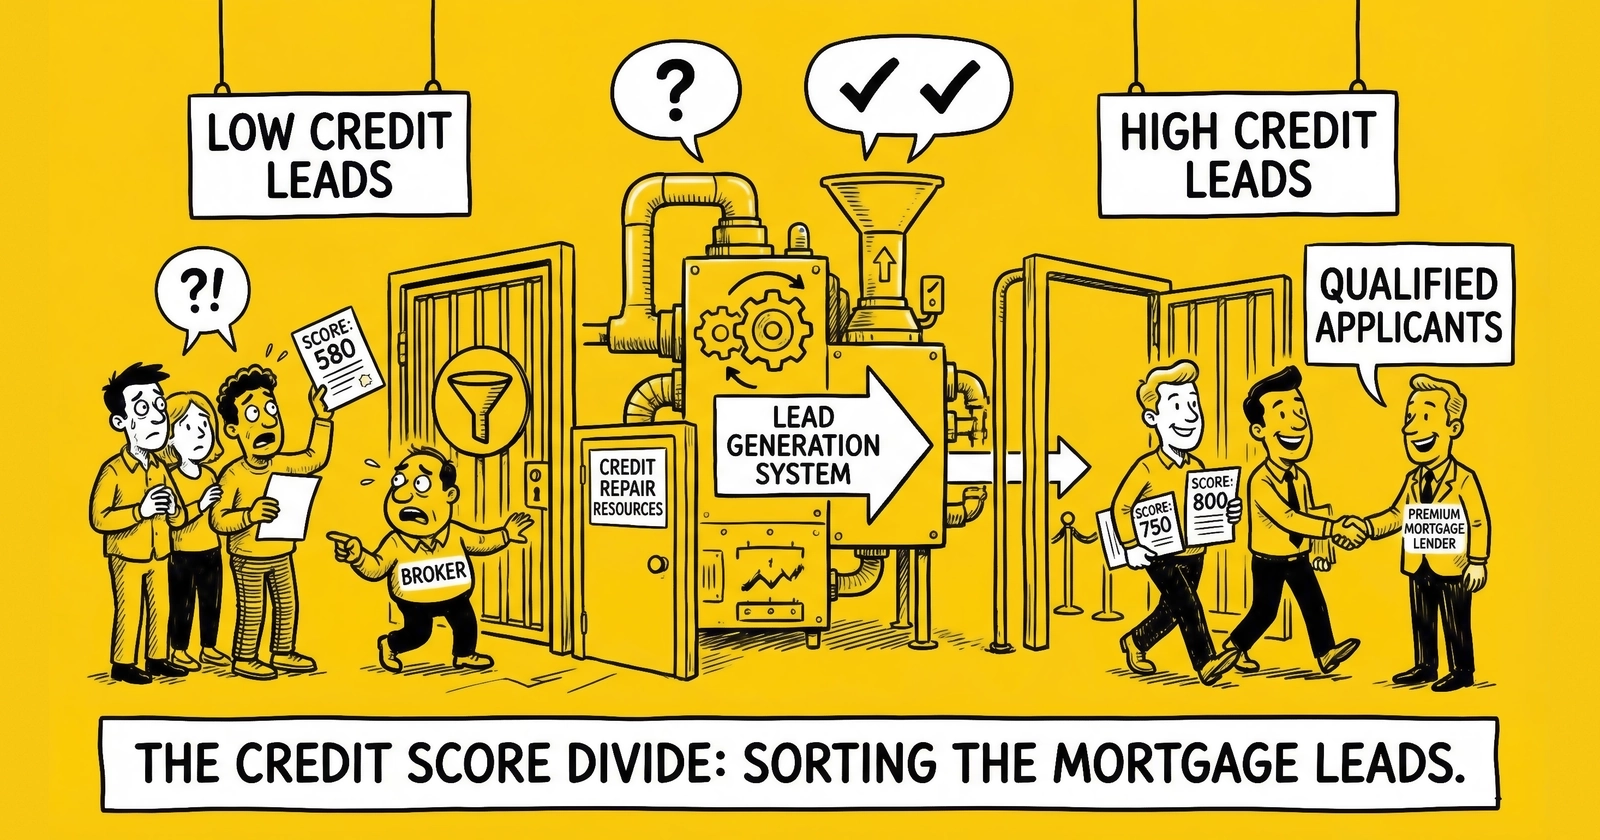
Credit scores sit at the center of mortgage lead economics. A lead with a 780 FICO and a lead with a 620 FICO may look identical on a form submission – same property type, same loan amount, same geographic market – yet they represent entirely different products with different conversion rates, different buyer pools, and different pricing structures. Lead generators who treat all credit tiers equally leave substantial money on the table while simultaneously frustrating buyers with mismatched inventory.
The centrality of credit in mortgage underwriting creates a stratified market where different credit tiers function almost as different industries. A lender optimized for super-prime conventional loans operates with different unit economics, different operational processes, and different margin structures than a lender serving FHA borrowers in the 620-660 range. These structural differences mean that effective lead generation requires treating credit tiers as distinct market segments rather than variations within a unified category. The strategies that generate premium returns from prime credit leads may destroy value when applied to subprime segments, and vice versa.
The mortgage industry segments borrowers into credit tiers that determine product eligibility, pricing, and approval probability. These tiers existed before algorithmic targeting, but digital lead generation creates new opportunities to match acquisition strategy with credit reality. The high-rate environment strategies that work for prime borrowers differ fundamentally from approaches required for credit-challenged segments. According to Experian’s 2024 Consumer Credit Review, the average American FICO score reached 715 – the highest on record – yet the distribution across tiers creates distinct market segments that require distinct approaches. Approximately 21% of consumers score above 800 (super-prime), 25% fall between 740-799 (prime), 18% land in 670-739 (near-prime), 16% occupy 580-669 (subprime), and 20% score below 580 (deep subprime).
For mortgage lead generation, this distribution creates a fundamental strategic question: which credit tiers should you target, and how should you structure operations around those targets? The answer depends on your traffic sources, landing page capabilities, buyer relationships, and operational capacity for handling different lead types. Prime and super-prime leads command premium prices but face intense competition and require sophisticated targeting. Subprime leads offer volume at lower acquisition costs but require specialized buyers and generate higher return rates.
This guide examines credit tier economics across the mortgage lead generation value chain – from targeting and acquisition through qualification and distribution to buyer management and performance optimization. Understanding these dynamics enables lead generators to build sustainable operations matched to their capabilities rather than chasing undifferentiated volume that destroys buyer relationships.
Understanding Credit Tier Segmentation
Before building credit-based strategies, lead generators need to understand how credit tiers function in mortgage underwriting and how this affects lead value throughout the conversion funnel.
The credit tier framework is not arbitrary – it reflects real differences in underwriting guidelines, rate pricing, and default risk that have evolved over decades of mortgage lending. Credit tiers align with regulatory frameworks, secondary market requirements, and lender risk management practices. Understanding why tiers exist and what they signify enables more effective targeting, more accurate pricing, and more productive buyer conversations.
The Standard Credit Tier Framework
The mortgage industry uses credit score ranges that align with underwriting guidelines, rate pricing, and product eligibility. While exact cutoffs vary by lender and loan program, industry convention recognizes distinct tiers that shape everything from approval probability to buyer pricing.
| Tier | FICO Range | Industry Term | Product Access | Typical Rate Premium |
|---|---|---|---|---|
| Super-Prime | 780+ | Excellent | All products, best rates | Base rate |
| Prime | 740-779 | Very Good | All products | +0.125-0.25% |
| Prime-Adjacent | 700-739 | Good | Most products | +0.25-0.50% |
| Near-Prime | 660-699 | Fair | Conventional limited, FHA strong | +0.50-1.00% |
| Subprime | 620-659 | Poor | FHA, some conventional | +1.00-1.50% |
| Deep Subprime | Below 620 | Very Poor | FHA limited, non-QM focus | +1.50%+ or non-QM |
These tiers matter because they determine which lenders can service which leads. A lender focused on conventional conforming loans has limited interest in leads below 680. An FHA specialist may prefer the 620-680 band where conventional competition diminishes. A non-QM lender actively seeks borrowers below 620 who have been rejected elsewhere. Matching lead supply to buyer capability determines conversion rates and buyer satisfaction.
Credit Tier Distribution in Lead Generation
The credit distribution among mortgage leads differs from the general population for several reasons. Active mortgage seekers skew toward life stages associated with better credit – stable employment, established credit history, sufficient income for homeownership. However, digital marketing channels reach different segments with varying efficiency.
Industry data from lead exchanges and aggregators suggests mortgage lead credit distributions that diverge meaningfully from population averages. Leads scoring 740 and above typically represent 35-45% of quality lead flow, compared to 46% of the general population. The 680-739 band accounts for 25-35% of leads, aligning closely with population distribution. Leads in the 620-679 range comprise 15-25% of volume, while those below 620 represent 10-20% depending on traffic source and targeting.
These distributions shift based on acquisition channel. Paid search tends to capture higher-intent, higher-credit prospects – searchers actively seeking mortgage quotes often have the credit profile to act on that intent. Social media advertising reaches broader audiences, including aspirational prospects whose credit may not support immediate action. Organic content attracts researchers across the credit spectrum. Understanding channel-tier correlations enables more precise forecasting and buyer matching.
Why Credit Tier Segmentation Matters for Lead Generators
Credit-based segmentation affects lead generator economics at every stage of operations.
Acquisition cost varies by tier because competition for high-credit prospects is intense. Google Ads CPCs for mortgage keywords targeting prime borrowers can exceed $50, while campaigns designed to capture subprime intent face less competition at $15-25. The cost disparity reflects buyer willingness to pay – prime leads convert at higher rates and generate larger loan amounts with better margins.
Conversion rates differ dramatically across tiers. A 760 FICO lead converting to application at 25-35% and to funding at 60-70% represents fundamentally different economics than a 640 FICO lead converting at 10-15% to application and 40-50% to funding. These conversion disparities compound buyer pricing expectations and return rate tolerance.
Buyer matching requirements intensify at lower credit tiers. Super-prime leads can route to virtually any buyer. Subprime leads require specialists – lenders with FHA Direct Endorsement approval, non-QM product access, or workout expertise. Sending 620-score leads to buyers lacking subprime capabilities generates returns that erode profitability and damage relationships.
Pricing power concentrates in premium tiers. Exclusive prime leads command $80-150 in competitive markets. Subprime leads may trade at $30-60 even with stronger qualification because buyer pools are smaller and conversion expectations are lower.
Credit-Based Targeting Strategies
Targeting specific credit tiers requires understanding which signals correlate with credit profile and which channels reach which segments efficiently.
The fundamental challenge of credit-based targeting is that credit scores themselves cannot be accessed pre-conversion. Unlike age, income, or geographic location, credit scores remain invisible until a credit pull occurs – and that happens after lead transfer to buyers. This invisibility requires lead generators to work through proxy signals that correlate with credit tier probability. No proxy perfectly predicts credit, but combinations of signals can meaningfully shift tier distribution in acquired leads.
Demographic and Behavioral Correlations
While lead generators cannot access actual credit scores pre-conversion, demographic and behavioral signals correlate with credit tier probability and enable directional targeting.
Income level correlates positively with credit score – higher earners have more capacity to manage credit obligations and weather financial disruptions. Targeting higher household income bands increases prime credit probability, though correlation is imperfect. Experian data shows median FICO scores of 730+ for households above $100,000 income versus 680 for households below $50,000.
Homeownership status provides strong credit signals. Current homeowners seeking refinance or purchase have demonstrated credit-worthy behavior previously. First-time buyers present more variable credit profiles but skew younger with thinner credit files rather than damaged credit. Renters seeking purchase represent the widest credit distribution.
Age correlates with credit score across the life cycle. Consumers aged 55-64 carry average FICO scores near 740, while those under 30 average closer to 660 according to Experian’s generational data. However, younger borrowers with strong credit represent attractive targets for purchase lending despite smaller population size within their tier.
Geographic signals reflect regional credit patterns. Markets with high homeownership rates, stable employment, and higher median incomes tend toward better average credit. Targeting specific MSAs or zip codes can shift tier distribution meaningfully.
Employment stability indicators – tenure signals, industry targeting, employer size – correlate with credit maintenance. Professionals in stable industries carry better average credit than gig workers or those in volatile sectors.
Channel Selection by Credit Tier Target
Different acquisition channels deliver different credit tier distributions, enabling strategic channel allocation based on target credit mix.
Paid search captures high-intent prospects across credit tiers, but prime-focused keyword strategies can shift distribution upward. Keywords emphasizing “best rates,” “low APR,” and “excellent credit” attract self-identified prime borrowers. Conversely, keywords around “bad credit mortgage,” “low credit score loans,” and “FHA with poor credit” intentionally capture subprime intent.
Search campaign structure should reflect credit targeting. Separate campaigns for prime-focused and subprime-focused keywords enable distinct bidding, messaging, and landing page routing. Mixed campaigns dilute targeting precision and complicate optimization.
Social media advertising enables demographic and interest targeting that correlates with credit profile. Income targeting, homeownership status, and financial interest categories help reach credit-tier-appropriate audiences. Facebook’s Special Ad Category restrictions limit some targeting options for housing, but broad demographic and interest signals remain available.
Native advertising reaches content-consuming audiences whose credit distribution varies by publisher and context. Financial services publishers attract creditworthy audiences researching optimization. Broader news and entertainment placements capture wider distributions.
Organic search and content marketing attract researchers across credit tiers. Content strategy can emphasize tier-appropriate topics – prime-focused content around rate optimization and jumbo loans versus subprime-focused content around FHA programs, credit repair prior to purchase, and non-QM options.
Affiliate and partner channels deliver credit distributions reflecting their own audience composition. Quality affiliate networks with financial services focus tend toward prime credit. Broader lead aggregators may include substantial subprime volume.
Landing Page Strategies for Credit Tier Segmentation
Landing page design and form structure can encourage self-selection into credit tiers, improving lead quality and buyer matching accuracy.
Credit score form fields capture self-reported credit tier, enabling routing and pricing even when actual scores remain unknown until credit pull. Multi-step forms that reveal tier early enable conditional messaging and progressive qualification aligned to credit reality.
Self-selection language can prime different credit segments. Headlines emphasizing “premium rates” and “jumbo loans” attract prime self-identification. Headlines around “all credit considered” and “past credit challenges” encourage subprime prospects to engage.
Form field sequencing matters for credit segmentation. Asking credit tier early enables branch logic that adjusts subsequent questions. A self-reported 780+ borrower might see questions about jumbo requirements and rate optimization. A self-reported 620 borrower might see questions about credit timeline and FHA awareness.
Qualification messaging should align with credit tier reality. Prime landing pages can emphasize rate competition and quick closing. Subprime landing pages should set appropriate expectations around documentation requirements, potentially longer timelines, and program options that differ from conventional.
Pricing Models for Credit-Tiered Leads
Credit tier significantly affects lead pricing, and sophisticated lead generators build pricing models that reflect credit-based value differences.
The pricing challenge for credit-tiered leads involves balancing accuracy with operational simplicity. Ideally, every lead would price precisely according to its expected conversion value, but this precision is impossible without actual credit scores and impractical even with them given the operational burden of highly granular pricing. Effective pricing models find pragmatic middle ground that captures most of the value differentiation while remaining operationally manageable.
Understanding Buyer Price Sensitivity by Tier
Mortgage lead buyers price leads based on expected conversion value, and credit tier directly affects this calculation.
Prime leads generate higher average loan amounts (better credit correlates with higher purchase prices and loan sizes), higher approval rates (60-75% of credit-qualified applications fund), and better margin (lower default risk enables tighter pricing). Buyers willingly pay premiums for prime leads because the math supports it – a $100 lead that converts at 5% to funded loans generates $2,000 cost per funded lead, sustainable for mortgage origination economics.
Subprime leads face compounding discounts. Lower average loan amounts (FHA limits, lower purchase prices in subprime-accessible markets), lower approval rates (35-50% funding rates on credit-challenged applications), and higher default risk reduce buyer willingness to pay. A $50 lead converting at 2% generates $2,500 cost per funded lead – workable but tighter.
Deep subprime leads below 620 require specialized buyers (non-QM lenders, FHA workout specialists) who extract value from products unavailable to conventional lenders. These buyers exist but represent smaller markets with specific requirements.
Tiered Pricing Structures
Lead generators can structure pricing to reflect credit tier value through several approaches.
Flat tier pricing sets fixed prices for each credit band – perhaps $100 for 740+, $80 for 700-739, $60 for 660-699, $45 for 620-659, and $30 for below 620. This approach provides pricing clarity but may leave money on the table for exceptional leads within tiers or create disputes around tier boundaries.
Continuous pricing models apply formulas that adjust price based on reported credit score, creating smooth price curves rather than tier jumps. A simple model might price leads at a base rate plus credit adjustment – for example, $30 base plus $0.10 per FICO point above 620, yielding $62 for a 640 lead and $102 for a 740 lead.
Hybrid models combine tier-based pricing with other factors. A lead at 750 FICO with $500,000 loan amount in a competitive market might command different pricing than a 750 FICO with $180,000 loan amount in a rural market, despite identical credit.
Performance-based adjustments layer on credit tier pricing. Buyers who convert prime leads at above-average rates might earn pricing discounts. Buyers whose subprime conversion falls below benchmarks might face price adjustments.
Credit Tier Pricing Benchmarks
Industry pricing for mortgage leads varies by market, exclusivity, and qualification depth, but credit tier relationships show consistent patterns.
| Credit Tier | Exclusive Lead Range | Shared Lead Range | Live Transfer Range |
|---|---|---|---|
| 780+ | $100-150 | $40-65 | $150-250 |
| 740-779 | $85-130 | $35-55 | $130-200 |
| 700-739 | $70-100 | $30-45 | $100-160 |
| 660-699 | $50-80 | $25-40 | $80-120 |
| 620-659 | $35-60 | $18-30 | $60-100 |
| Below 620 | $25-45 | $12-22 | $45-75 |
These ranges reflect national averages across loan types. Purchase leads typically command 10-20% premiums over refinance. High-value markets (coastal metros, jumbo-eligible areas) run 15-30% above benchmarks. FHA-specific leads may price differently than conventional-eligible within the same credit band.
Buyer Segmentation by Credit Tier
Different buyer types specialize in different credit tiers, and matching lead supply to buyer capability determines conversion rates and relationship sustainability.
The mortgage lending landscape is not homogeneous – it comprises specialized operators who have built their businesses around specific borrower segments. A correspondent lender selling exclusively to Fannie Mae and Freddie Mac has no use for 620-score leads regardless of how well-priced they are. An FHA specialist who has optimized their operation for manual underwriting of credit-challenged files may actually prefer subprime leads that prime-focused competitors avoid. Understanding buyer specializations enables routing strategies that maximize both revenue and buyer satisfaction.
Prime-Focused Buyers
Buyers specializing in prime credit typically include large retail banks with conventional and jumbo focus, correspondent lenders selling to GSEs, mortgage brokers with prime wholesale relationships, and fintech lenders optimized for prime digital experience.
These buyers require credit scores typically above 680, with sweet spots in the 720-780 range. They offer best pricing for prime leads but may have limited capacity or interest in subprime. High conversion expectations (20%+ lead-to-application, 60%+ application-to-funding) reflect their underwriting standards. Understanding the differences between mortgage lenders and brokers as lead buyers helps lead generators match supply to buyer capabilities.
Relationship management with prime-focused buyers requires consistent credit quality. Sending leads outside their credit range generates returns that damage relationships and create operational burden. Credit tier verification before routing – even at the self-reported level – protects these relationships.
Subprime and FHA Specialists
Buyers specializing in credit-challenged borrowers include FHA-focused lenders with Direct Endorsement authority, mortgage banks with robust FHA operations, brokers with FHA wholesale relationships, and non-QM lenders serving below-620 borrowers.
These buyers actively seek credit tiers that prime lenders avoid. They have underwriting expertise for complex files, credit repair guidance capabilities, and patience for longer conversion timelines. Their pricing reflects lower conversion expectations but may offer volume capacity unavailable from prime buyers.
FHA specialists particularly value the 580-660 band where FHA programs shine. Below 580, even FHA becomes challenging, pushing borrowers toward non-QM products with different economics.
Non-QM Lenders
Non-qualified mortgage (non-QM) lenders serve borrowers who fall outside conventional and government guidelines. Their borrower profiles include self-employed with complex income documentation, recent credit events (bankruptcy, foreclosure) that conventional timelines exclude, investment property buyers seeking flexibility, and foreign nationals without traditional credit history.
Non-QM buyers evaluate leads differently than conventional buyers. Credit score matters less than overall picture – a 640-score borrower with substantial assets and strong income may present better than a 680-score borrower with stretched debt ratios. Non-QM leads require different qualification questions that capture these alternative qualifications.
For lead generators, non-QM represents a specialized channel that absorbs leads other buyers reject while potentially commanding premium pricing for well-qualified non-QM candidates. Our non-QM mortgage lead generation strategies guide covers the targeting and qualification approaches specific to this segment.
Building Multi-Tier Buyer Networks
Sustainable mortgage lead operations require buyer coverage across credit tiers to avoid waste and optimize revenue.
Tier-specific routing ensures leads reach buyers capable of converting them. A lead distribution system should route 750+ leads to prime-focused buyers, 680-750 to buyers with full-spectrum capability, 620-680 to FHA specialists, and below 620 to non-QM specialists or FHA workout experts.
Waterfall distribution with credit awareness routes leads through buyer sequences that reflect credit capability. Prime leads might flow through three prime buyers before reaching full-spectrum backup. Subprime leads might skip prime-only buyers entirely, reducing reject-and-return friction.
Buyer capacity management must account for credit tier preferences. A buyer wanting 500 leads monthly may want 400 prime and 100 near-prime rather than undifferentiated volume. Understanding these preferences and managing to them builds stronger relationships.
Return analysis by credit tier identifies buyer capability mismatches. A buyer returning 25% of leads in the 660-680 band but only 8% of 720+ leads reveals credit tier sensitivity that should inform routing decisions.
Conversion Optimization by Credit Tier
Conversion patterns differ across credit tiers, and optimization strategies should reflect these differences.
Contact and Engagement Patterns
Contact rates – the percentage of leads successfully reached by phone – vary modestly by credit tier, typically ranging from 45-55% across tiers for fresh leads contacted within appropriate windows. Speed-to-lead matters more than credit tier for initial contact success.
Engagement quality differs more substantially. Prime borrowers tend toward more decisive engagement – they know their qualification status and can make decisions quickly. Subprime borrowers may require more education, exploration of options, and navigation of credit improvement pathways before transaction readiness.
Conversation length correlates inversely with credit – prime borrowers average shorter calls because qualification conversations move quickly, while subprime borrowers require more consultation time per contact. This affects contact center capacity planning for credit-segmented operations.
Application and Approval Rates by Tier
Application submission rates from contacted leads show significant credit tier variation.
| Credit Tier | Contact-to-Application Rate | Application-to-Approval Rate | Overall Lead-to-Funding |
|---|---|---|---|
| 780+ | 30-40% | 80-90% | 24-36% |
| 740-779 | 25-35% | 75-85% | 19-30% |
| 700-739 | 20-30% | 70-80% | 14-24% |
| 660-699 | 15-25% | 55-70% | 8-18% |
| 620-659 | 10-18% | 45-60% | 5-11% |
| Below 620 | 6-12% | 30-50% | 2-6% |
These ranges reflect industry patterns but vary significantly based on lead source quality, buyer capability, and market conditions. Purchase leads typically convert at higher rates than refinance within each credit tier.
Tier-Specific Conversion Strategies
Optimization approaches should reflect credit tier realities.
Prime tier conversion focuses on speed and competitiveness. Prime borrowers have options and can shop efficiently. Responding within minutes, presenting competitive rates, and streamlining process wins conversions against competitors pursuing the same high-value borrowers. Technology investment in automated pricing, quick documentation collection, and efficient processing pays returns with prime borrowers who value speed.
Near-prime conversion emphasizes program fit and realistic expectation setting. Borrowers in the 680-720 range may have conventional options with rate premiums or government options with different trade-offs. Consultative selling that explains options builds trust and conversion.
Subprime conversion requires patience and credit guidance. Many subprime borrowers are not immediately transaction-ready but represent future pipeline if nurtured appropriately. Credit improvement guidance, timeline setting, and periodic follow-up develop relationships that convert over 6-18 months. Lenders with nurture capabilities extract more value from subprime leads than those expecting immediate conversion.
Deep subprime conversion demands specialized expertise. Borrowers below 620 need navigation through complex product options, potentially including non-QM, FHA with additional requirements, or delayed timelines pending credit improvement. Buyers without these capabilities waste subprime leads; specialists convert meaningful percentages through expertise and patience.
Credit Verification and Quality Assurance
Lead generators face an inherent challenge: credit scores cannot be verified without credit pulls, which occur post-lead-transfer. This creates quality assurance challenges and requires approaches that maximize credit accuracy while acknowledging limitations.
Self-Reported Credit Accuracy
Self-reported credit scores carry inherent uncertainty. Studies suggest consumers tend toward optimistic credit reporting, with self-reported scores averaging 30-50 points higher than pulled scores in some samples. This optimism bias affects lead quality when routing and pricing depend on self-reported tier.
Strategies to improve self-reported accuracy include providing tier ranges rather than exact score requests (reducing precision pressure while maintaining directional accuracy), offering “I don’t know” options with follow-up questions, asking about recent credit applications or rejections as proxy indicators, and framing questions around confidence level rather than exact score.
Consumer credit monitoring adoption has improved self-awareness. Credit Karma, Experian apps, and bank-provided scores mean more consumers know their approximate credit standing. Leads from financially engaged segments show better self-report accuracy than leads from financially disengaged populations.
Soft Pull Integration Options
Some lead generators integrate soft credit pulls into their qualification process, obtaining actual credit data before transfer. This approach enables accurate tier-based pricing and routing, higher buyer confidence and lower return rates, and premium pricing that reflects verified quality.
The trade-offs include increased cost ($1-5 per soft pull depending on volume and provider), potential form abandonment from consumers uncomfortable with credit checks, and compliance requirements around credit data handling.
Soft pull integration works best for high-value lead flows where the verification cost represents a small percentage of lead value and buyer willingness to pay premiums justifies the investment. It works less well for high-volume, lower-value operations where verification costs erode margins.
Post-Transfer Quality Monitoring
Regardless of pre-transfer verification, lead generators should monitor credit tier accuracy through buyer feedback.
Buyer credit reporting captures actual pulled scores that can be compared against self-reported tiers. Regular feedback identifying score versus report discrepancies helps identify accuracy problems in specific sources or landing pages.
Tier-based return analysis reveals systematic misreporting. If returns from the self-reported 740+ tier occur primarily because actual scores fall in the 680-720 range, this suggests form-level accuracy problems worth addressing.
Source-level credit accuracy analysis identifies acquisition channels with persistent credit tier issues. A traffic source generating leads that consistently score 40 points below self-report may require different messaging or exclusion.
Credit-Based Lead Distribution Technology
Routing and distribution systems must incorporate credit tier awareness to optimize buyer matching and revenue.
Real-Time Routing Logic
Modern lead distribution platforms enable credit-based routing rules that direct leads to appropriate buyers automatically.
Tier-based buyer filtering ensures leads only route to buyers capable of handling their credit profile. A 650-score lead should skip buyers with 680 minimums, reducing wasted attempts and buyer friction.
Tiered waterfall sequences route leads through buyer groups in credit-appropriate order. Premium-priced prime leads flow through prime-focused buyers first, with broader buyers as backup. Subprime leads route directly to specialists rather than burdening prime-focused operations.
Dynamic pricing application adjusts lead price based on credit tier, applying appropriate tier pricing to each transaction automatically rather than requiring manual intervention.
Capacity management by tier respects buyer preferences for credit mix. A buyer wanting 70% prime leads should not receive disproportionate subprime volume that strains their operations.
Integration with Credit Scoring Tools
Lead distribution systems can integrate with credit scoring and verification tools to enhance routing accuracy.
Pre-ping verification through soft pull providers can confirm credit tier before routing, enabling accurate pricing and appropriate buyer matching. This integration adds cost but improves buyer satisfaction and reduces returns.
Fraud detection integration helps identify leads with credit-based fraud indicators – synthetic identities, rapid credit deterioration, or other signals that predict conversion failure regardless of reported tier.
Credit bureau data append services can enhance lead data with estimated credit tier based on household characteristics, providing directional guidance when self-reported data is missing or suspect.
Reporting and Analytics
Credit-tiered reporting reveals performance patterns that inform optimization.
Conversion by tier analysis identifies which credit segments convert best with which buyers, informing routing optimization. If Buyer A converts 720-750 leads at 5% but 750+ leads at only 3%, routing optimization should shift ultra-prime volume elsewhere.
Revenue by tier tracks revenue contribution across credit segments, identifying which tiers drive profitability and which represent optimization opportunities or exit candidates.
Return analysis by tier identifies credit-based return patterns that suggest routing problems or buyer capability gaps.
Tier distribution trending tracks whether credit tier mix is shifting over time, enabling proactive response to composition changes that affect buyer satisfaction and revenue.
Vendor Tools for Credit-Based Targeting
Several vendor categories provide tools that enable credit-based targeting for mortgage lead generation.
Data Providers for Credit-Based Targeting
Experian, TransUnion, and Equifax offer marketing data products that enable credit-based audience targeting without accessing individual credit reports. These products provide household-level credit indicators, estimated score ranges, and credit behavior signals that support targeting strategies.
Alternative data providers aggregate non-traditional credit signals that correlate with creditworthiness. These can supplement traditional credit data for targeting purposes, particularly for reaching underserved segments.
Property data providers like CoreLogic, Black Knight, and ATTOM offer homeowner data that correlates with credit profiles. Homeowners with stable tenure, high equity, and consistent payment history tend toward better credit than transient or distressed property situations.
Targeting Platform Capabilities
Major advertising platforms offer varying credit-related targeting capabilities within their Special Ad Category restrictions for housing.
Programmatic platforms enable data onboarding that matches advertiser data with platform audiences, potentially including credit-correlated segments from compliant data providers.
Demographic and interest targeting available on major platforms correlates with credit profile. Income targeting, homeownership status, and financial interest categories help reach credit-tier-appropriate audiences within platform policy constraints.
Lead Verification and Quality Tools
TrustedForm and Jornaya provide consent documentation and lead verification that supports quality assurance across credit tiers. Their certificate data can inform quality analysis but does not directly address credit verification.
Fraud detection services identify synthetic identities, bot traffic, and other fraud patterns that correlate with poor credit outcomes even when reported credit appears strong.
Lead scoring tools can incorporate credit-related signals into broader quality scoring that predicts conversion likelihood across multiple dimensions including credit.
Key Takeaways
Credit tier segmentation represents the single largest driver of mortgage lead value differentiation – a 100-point FICO difference can represent 3x variation in buyer pricing and 5x variation in conversion probability. Lead generators who treat credit as a single homogeneous dimension miss optimization opportunities that compound across acquisition, pricing, and distribution.
The viable mortgage prospect pool segments into distinct tiers that require distinct strategies: super-prime borrowers (780+) convert efficiently but face intense competition; prime borrowers (740-779) represent the industry sweet spot; near-prime (700-739) works for most buyers with modest rate premiums; subprime (660-699) requires FHA expertise; and deep subprime (below 660) demands specialized non-QM capabilities or extended nurture approaches.
Targeting strategies must work through proxy signals since pre-conversion credit verification is limited. Income correlations, homeownership status, geographic patterns, and behavioral signals enable directional targeting even without credit data access. Channel selection affects tier distribution – paid search skews prime, broader social reaches wider distributions.
Pricing should reflect credit tier value differences that range from $100+ for exclusive prime leads to $30-50 for verified subprime. Continuous pricing models based on FICO points can optimize revenue capture better than broad tier brackets. Performance-based adjustments layer additional precision.
Buyer segmentation by credit capability prevents the waste and relationship damage from mismatched routing. Prime buyers should not receive subprime leads; subprime specialists should not wait behind prime buyers in waterfall sequences. Multi-tier buyer networks ensure full-spectrum coverage.
Conversion optimization differs by tier – prime requires speed and competitiveness; subprime demands patience and credit guidance. Contact rates remain relatively constant, but engagement quality and conversion timeline differ substantially.
Quality assurance combines form design for self-report accuracy, buyer feedback analysis, soft pull integration where economically justified, and source-level accuracy tracking. No single approach solves credit verification, but layered strategies improve quality incrementally.
Technology platforms must incorporate credit tier as a first-class routing and pricing attribute alongside geography, product type, and buyer preferences. Reporting by credit tier enables optimization that treats different tiers as distinct products rather than interchangeable volume.
Frequently Asked Questions
How do credit scores affect mortgage lead pricing?
Credit scores directly influence mortgage lead pricing because they determine conversion probability and buyer willingness to pay. A lead with 760 FICO scores converts to funded loan at approximately 25-35% when contacted, justifying lead costs of $100-150 for exclusive leads. A lead with 640 FICO converts at perhaps 5-10%, supporting lead prices of $35-60. This 2-3x pricing differential reflects the fundamental difference in buyer value between credit tiers. Pricing models range from simple tier-based brackets to continuous formulas that adjust price per FICO point. Understanding credit tier pricing enables lead generators to optimize both acquisition spending and revenue capture.
What conversion rates should I expect by credit tier?
Conversion rates vary substantially by credit tier across the mortgage funnel. For prime leads above 740, expect contact-to-application rates of 25-35% and application-to-funding rates of 75-85%, yielding overall lead-to-funding of 19-30%. Near-prime leads in the 680-740 range convert to application at 18-28% and fund at 60-75%, producing 11-21% overall. Subprime leads between 620-680 show application rates of 12-20% and funding rates of 50-65%, netting 6-13% overall. These benchmarks assume quality lead sources and capable buyers – poor leads or buyer mismatch degrades performance within any tier.
How can I target specific credit tiers in my campaigns?
Targeting specific credit tiers requires combining demographic, behavioral, and contextual signals that correlate with creditworthiness. Higher income targeting, homeowner status, and professional occupation indicators correlate with prime credit. Geographic targeting in markets with high homeownership and stable employment skews toward better credit. Keyword strategies can emphasize tier-appropriate terms – “best mortgage rates” for prime versus “FHA loans bad credit” for subprime. Landing page design can encourage self-selection through messaging that resonates with specific tiers. While exact credit targeting is impossible without credit data, these proxy signals meaningfully shift tier distribution in acquired leads.
Should I use soft credit pulls in my lead generation process?
Soft credit pull integration offers benefits for operations where the verification value exceeds the cost. Benefits include accurate tier-based pricing, appropriate buyer routing, lower return rates, and premium pricing justified by verified quality. Costs include $1-5 per pull, potential form abandonment from credit-hesitant consumers, and compliance obligations for credit data handling. Soft pulls work best for high-value lead flows (mortgage, personal loans) where verification cost represents small percentages of lead value. High-volume, low-margin operations may not support the cost. Consider testing soft pulls on portions of lead flow to measure conversion impact and buyer response before full implementation.
How do I build buyer relationships for different credit tiers?
Building buyer relationships across credit tiers requires understanding buyer specializations and matching lead supply to buyer capability. Prime-focused buyers (retail banks, correspondent lenders) want consistent 700+ leads with minimal subprime exposure. FHA specialists seek the 620-680 sweet spot where their expertise creates advantage. Non-QM lenders actively want leads that prime buyers reject. Building relationships in each category enables full-spectrum distribution without waste. Tier-specific routing prevents mismatches that generate returns. Regular communication about credit mix expectations and performance by tier strengthens relationships. Consider credit tier capacity as a buyer attribute managed alongside geographic and product preferences.
What quality assurance approaches work for credit tier verification?
Since credit scores cannot be verified without credit pulls (which occur post-transfer), quality assurance requires multiple approaches. Improve self-reported accuracy through form design – tier ranges rather than exact scores, confidence qualifiers, and proxy questions about recent credit events. Track buyer feedback comparing pulled scores against self-reported tiers to identify systematic accuracy problems. Analyze returns by credit tier to reveal routing mismatches. Consider soft pull verification for high-value flows where the investment supports premium pricing. Source-level analysis identifies channels with persistent credit tier accuracy problems. No single approach solves credit verification, but layered strategies improve quality over time.
How do credit tier economics differ for purchase versus refinance leads?
Purchase leads typically command 10-20% premiums over refinance leads within the same credit tier because purchase intent is more defined and conversion timelines are clearer. Credit tier dynamics differ between products as well. Prime purchase borrowers face intense competition from well-funded lenders; prime refinance borrowers may be rate-locked and resistant. Subprime purchase borrowers often seek FHA programs with established pathways; subprime refinance borrowers may face equity constraints that limit options. Cash-out refinance creates additional complexity where credit tier intersects with equity extraction needs. Lead generators should analyze purchase and refinance separately within credit tier analysis to understand their distinct economics.
What role does credit tier play in lead return policies?
Credit tier directly affects return policies because misrepresented credit is a common return reason. Buyers expecting 720+ leads who receive 660 leads have legitimate quality concerns. Return policies should address credit tier explicitly – defining acceptable variance between self-reported and pulled credit, establishing dispute processes for tier-related returns, and potentially pricing-in credit risk for tiers with higher variability. Some operations implement clawbacks for significant credit misrepresentation (self-reported 750, actual 650) while accepting minor variance. Clear policies communicated upfront reduce disputes. Tracking return patterns by credit tier identifies accuracy problems requiring form or source adjustments.
How does credit tier targeting differ across advertising channels?
Each advertising channel offers different credit tier targeting capabilities and reaches different credit distributions. Paid search captures high-intent prospects across tiers, with keyword strategy shifting distribution (rate optimization terms skew prime; “bad credit” terms skew subprime). Social media enables demographic and interest targeting that correlates with credit, though housing restrictions limit direct credit targeting. Programmatic display supports data onboarding with credit-correlated segments from compliant providers. Native advertising reaches credit distributions reflecting publisher audiences. Organic content attracts researchers across tiers, with topic focus influencing distribution. Multi-channel operations should analyze credit tier distribution by channel to inform budget allocation aligned with target credit mix.
What technology requirements support credit-tiered lead distribution?
Credit-tiered lead distribution requires routing systems that incorporate credit tier as a lead attribute driving buyer matching. Core requirements include tier-based routing rules that filter buyers by credit capability, tiered waterfall sequences that route through tier-appropriate buyer groups, dynamic pricing application by credit tier, capacity management respecting buyer tier preferences, and integration capabilities for soft pull verification if used. Reporting must track performance by credit tier across buyers to enable optimization. Real-time routing decisions must evaluate credit tier alongside geography, product type, and buyer availability. Most modern lead distribution platforms support these capabilities through configuration rather than custom development.
Sources
- CFPB HMDA Data Browser - Federal mortgage lending data including origination volumes, denial rates, and borrower demographics by credit profile
- CFPB Data Point: Mortgage Market Activity and Trends - Annual CFPB analysis of mortgage origination patterns, credit score distributions, and lending trends
- CFPB Borrower Risk Profiles - Consumer credit trends tracking mortgage borrower risk characteristics over time
- HUD FHA Single Family Housing Policy Handbook 4000.1 - Official FHA underwriting standards including minimum credit score requirements and manual underwrite thresholds
- Urban Institute Housing Finance at a Glance - Monthly chartbook tracking credit availability, denial rates, and mortgage market conditions by credit tier
- Federal Reserve Bank of New York Household Debt and Credit Report - Quarterly report on household debt balances, delinquencies, and credit score distributions from the Consumer Credit Panel
- FHFA National Mortgage Database Aggregate Statistics - Nationally representative mortgage data including borrower credit scores, LTV ratios, and loan performance
Market data and pricing benchmarks current as of February 2026. Credit tier economics shift with market conditions, regulatory environment, and competitive dynamics. Validate current benchmarks through industry sources and buyer feedback. This article provides general information about mortgage lead generation practices and does not constitute legal or financial advice.