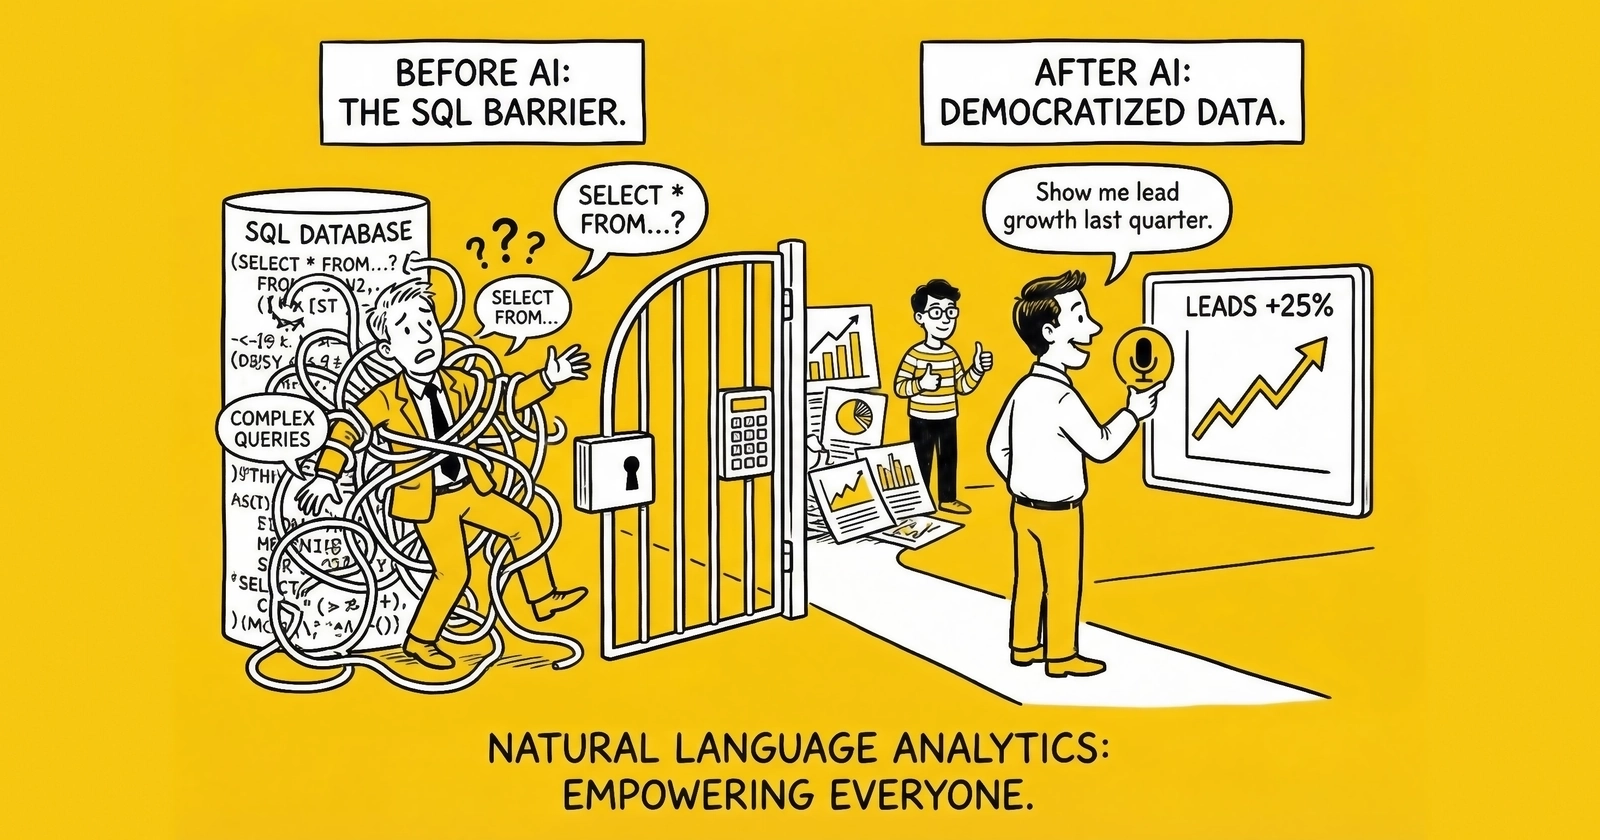
How natural language interfaces and semantic layers are ending the era when 90% of companies depended on 10% of employees for data insights
The bottleneck that cost billions
Every organization tells the same story. A marketing manager needs to understand which customer segments drove last quarter’s revenue growth. A sales director wants to know which deals are at risk before the quarter closes. An operations lead needs to identify which suppliers are causing the most delays.
All the data exists. It sits in warehouses, CRMs, ERPs, and dozens of other systems. But between the question and the answer stands a bottleneck that has persisted for thirty years: the people who know how to write SQL.
The economics are brutal. Forrester research reveals that over half of business users – more than 50% – report they generally need technical help to understand performance analytics. This isn’t about complex machine learning or advanced statistical analysis. It’s about basic questions: What happened? Why did it happen? What should we do about it?
The traditional response has been to hire more data analysts, build more dashboards, and train more people in SQL. But the demand for insights grows faster than any organization can scale its data team. The result? A chronic backlog where business users wait days or weeks for answers to questions that should take minutes.
This bottleneck has measurable costs. Gartner estimates that 90% of organizations currently depend on approximately 10% of their employees – the data specialists – for analytics insights. When critical business decisions wait on this limited pool of experts, organizations move slower than markets demand.
But the bottleneck is finally breaking. A convergence of technologies – natural language processing, semantic layers, and AI-powered analytics – is transforming who can ask questions and how quickly they get answers. The shift isn’t incremental. It’s a fundamental redistribution of analytical capability across the enterprise.
This is the democratization of business analytics. And it’s happening now.
The old paradigm and why it failed
The dashboard delusion
For two decades, the analytics industry sold a promise: build enough dashboards, and business users will have the insights they need. Billions of dollars flowed into business intelligence platforms. Organizations created thousands of reports, charts, and visualizations. The promise proved hollow. Dashboards are inherently static – they answer the questions their creators anticipated, but business moves faster than dashboard development. By the time a new metric gets added to an existing report, the strategic moment has passed. By the time a new dashboard gets built from scratch, the question has evolved.
The result? Shadow analytics proliferating across every organization. Business users, unable to get answers from official BI systems, export data to spreadsheets where they can manipulate it freely. Marketing maintains its own revenue calculations. Sales tracks pipeline differently than finance. Operations uses definitions that don’t match anyone else’s.
A Salesforce study quantified this chaos: 72% of IT leaders describe their current infrastructure as “overly interdependent,” yet the interdependence doesn’t translate to shared understanding. Each department developed its own analytical reality, creating what practitioners call “metric soup” – the same business question generating different answers depending on who you ask.
The SQL barrier
The fundamental problem wasn’t the tools – it was the language. SQL (Structured Query Language) remains the lingua franca of data access. It’s powerful, precise, and completely alien to most business users. Asking a typical marketing manager to write SQL is like asking them to write legal contracts in Latin. The capability exists in theory; the practical barrier is insurmountable.
Consider what it actually takes to answer a simple business question like “Show me revenue by region for Q3.” This requires understanding which database tables contain revenue data, knowing the correct joins between revenue, region, and date tables, applying the right filters for “Q3” (which quarter? which fiscal calendar?), using the organization’s specific definition of “revenue” (gross? net? recognized? booked?), and writing syntactically correct SQL that performs efficiently. Each step assumes technical knowledge that business users don’t have – and shouldn’t need to have. Their expertise lies in understanding the business, not the database schema.
The result is a translation layer that slows everything down. Business users describe what they need in natural language. Data analysts translate those requirements into SQL. Results come back. Business users realize the question wasn’t quite right. The cycle repeats. What should be a five-minute exploration becomes a multi-day exchange.
The trust deficit
Even when business users got access to self-service tools, adoption remained low. The reason wasn’t technical complexity alone – it was trust. When different tools produce different numbers for the same metric, users lose confidence in all of them. The “which number is right?” debates that plague every organization aren’t just annoying – they’re corrosive. They consume meeting time, delay decisions, and create political dynamics where data becomes a weapon rather than a shared resource.
Organizations typically see 50% fewer “which number is right?” disputes after implementing centralized metric definitions, according to Atlan research. The inverse is equally true: without centralized definitions, half of data conversations devolve into arguments about methodology rather than meaning.
This trust deficit created a perverse dynamic. The more data organizations collected, the less confident they became in their insights. The proliferation of analytics tools – each with its own calculation engine – multiplied the opportunities for inconsistency. Self-service analytics without governance produced chaos faster than insights.
The technology breakthrough
Natural language analytics arrives
The transformation began quietly. Platforms like ThoughtSpot pioneered natural language search for analytics in the 2010s, allowing users to type questions in plain English rather than writing SQL. The technology was impressive but limited – it worked well for simple queries but struggled with complex business logic. Generative AI changed everything. Large language models brought unprecedented capability in understanding human intent and translating it into structured queries, and suddenly the translation layer that had bottlenecked analytics for decades could be automated at scale.
Snowflake’s Cortex Analyst exemplifies this evolution. The platform achieves 95% accuracy on natural language to SQL conversion for well-modeled data. Users type questions like “What were our top-selling products in Europe last quarter?” and receive accurate, executable SQL queries without touching the underlying syntax. This isn’t a parlor trick – it’s a fundamental restructuring of who can access enterprise data.
Christian Kleinerman, Snowflake’s executive vice president of product, articulated the shift: “If business intelligence democratized access to data 20 to 30 years ago, AI is taking that to the next level.”
The Snowflake Copilot, originally an assistive tool in the UI, has evolved into a full-fledged developer API. Organizations can embed natural language-to-SQL capabilities directly into their own internal or customer-facing applications. The translation capability that once required data analysts can now be deployed anywhere.
Agentic analytics emerges
But natural language query is just the beginning. The real transformation comes from agentic analytics – AI systems that don’t just answer questions but proactively discover insights, identify anomalies, and recommend actions.
ThoughtSpot’s Spotter represents this next generation. Announced as an “agentic AI analyst,” Spotter goes beyond responding to queries. For background on how agentic AI is transforming enterprise operations, see our detailed analysis. It performs autonomous multi-step analysis – rather than requiring users to formulate precise questions, it breaks complex inquiries into component parts and synthesizes results. It generates proactive insights, surfacing anomalies and trends without being asked and alerting users to changes that warrant attention. And through MCP integration – the universal AI data connector protocol – it enables multi-source reasoning, querying across structured databases, unstructured documents, Slack conversations, Salesforce records, and Jira tickets in a single interaction. This represents a shift from pull to push analytics. Traditional BI required users to know what questions to ask; agentic analytics identifies questions worth asking and brings answers before users even recognize the need.
Hundreds of Snowflake customers – including Hyatt, PepsiCo, LegalZoom, Capital One, and Matillion – are already implementing these capabilities. Ana Garcia, VP of Data and Platform Engineering at LegalZoom, described the impact: “The integration of ThoughtSpot has further empowered teams across LegalZoom, strengthening our data strategy and ultimately enabling us to deliver the personalized experiences our customers have come to expect.”
The semantic layer foundation
Natural language analytics only works when AI understands what business terms actually mean. “Revenue” could refer to gross revenue, net revenue, recognized revenue, booked revenue, or a dozen other variations depending on context. Without explicit definitions, AI systems guess – and guessing produces the same inconsistency that plagued manual analytics.
This is where the semantic layer becomes essential. A semantic layer sits between raw data and the applications that use it, translating technical database structures into business-friendly concepts. For technical background on how context engineering affects enterprise AI accuracy, see our detailed analysis. It encodes metric definitions (how “Monthly Recurring Revenue” or “Customer Acquisition Cost” should be calculated), entity relationships (how customers connect to orders, orders to products, products to categories), business rules (fiscal calendar definitions, regional hierarchies, exception handling), time logic (year-to-date, year-over-year, rolling averages, and other temporal calculations), and access policies (row-level security, data masking, and permission enforcement). When an AI system queries data through a semantic layer, it inherits these definitions automatically. “Q3 revenue” means the same thing regardless of who asks the question or which tool surfaces the answer.
Gartner’s 2025 guidance explicitly identifies semantic technology as “non-negotiable for AI success.” Without semantic layers, AI systems lack the business context required for reliable interpretation. With them, organizations achieve what practitioners call “one version of the truth” – consistent answers across every dashboard, report, and AI interaction.
The market has responded with multiple architecture patterns:
| Pattern | Examples | Best For |
|---|---|---|
| BI-native | Power BI, Tableau, Looker, ThoughtSpot | Single-BI-tool organizations |
| Platform-native | Snowflake Semantic Views, Databricks Unity Catalog | Data platform-centric organizations |
| Universal/Headless | Cube, AtScale, GoodData, dbt Semantic Layer | Multi-tool enterprises, AI-first strategies |
The universal/headless approach has gained particular momentum because it decouples metric definitions from any single consumption tool. Organizations can define “revenue” once and serve that definition to Tableau, Power BI, custom applications, and AI agents simultaneously.
The business transformation
From days to minutes
The most immediate impact of democratized analytics is time-to-insight compression. Tasks that took days now take minutes.
Traditional workflow:
| Step | Timeline |
|---|---|
| Business user identifies question | Day 1 |
| Request submitted to data team | Day 1-2 |
| Data analyst clarifies requirements | Day 3-4 |
| Query development and testing | Day 5-7 |
| Results reviewed and refined | Day 8-10 |
| Final delivery | Day 10-14 |
Natural language analytics workflow:
| Step | Timeline |
|---|---|
| Business user asks question in plain language | Minute 1 |
| AI generates and executes query against semantic model | Minute 1-2 |
| Results displayed with visualization options | Minute 2-3 |
| User refines question based on initial results | Minute 4-5 |
| Final answer achieved | Minute 5-10 |
The time compression isn’t just faster – it changes what kinds of analysis are feasible. When each iteration takes days, users must be highly certain about what they need before requesting it. When iterations take minutes, exploration becomes practical. Users can follow threads of inquiry, asking follow-up questions as they learn from initial results.
An Airbyte analysis found that advanced NLP implementations result in a 40% reduction in analysis time for non-technical users while simultaneously reducing dependency on data specialists for routine investigation.
Reduced IT backlog
The bottleneck shift has immediate operational benefits. Self-service analytics with proper governance has reduced report backlogs by 71% for IT departments while increasing analytics adoption company-wide, according to industry analysis.
This isn’t about eliminating data teams – it’s about redirecting their expertise. When data analysts no longer spend the majority of their time fielding ad-hoc queries, they can focus on data modeling (building the semantic layers that enable self-service), advanced analytics (machine learning, predictive modeling, and complex analysis that genuinely requires specialist skills), data quality (ensuring the foundation that self-service depends on), and strategic projects (cross-functional initiatives that create competitive advantage). The shift from reactive query fulfillment to proactive capability building transforms the data team’s organizational role from cost center to strategic enabler.
The end of “which number is right?”
Centralized metric definitions through semantic layers eliminate the reconciliation burden that consumes countless hours in every organization.
When Marketing and Finance both request “Q3 revenue,” they receive identical results because both query the same centralized definition. This consistency extends beyond simple metrics to complex calculations involving time-based comparisons (year-over-year growth, trailing twelve months), segment breakdowns (by region, product, customer type), exception handling (how to treat returns, cancellations, chargebacks), and attribution logic (which touchpoint gets credit for a conversion). All follow uniform logic regardless of who generates the report or which tool displays the results, and the reconciliation time and escalations caused by conflicting data effectively disappear.
Sephora’s investment in ThoughtSpot illustrates this priority. According to Manbir Paul, the company’s focus was “driven by the need to enhance their semantic layer and drive intelligence in their BI space.” The cosmetics retailer recognized that AI-powered analytics would only deliver value if grounded in consistent, trusted definitions.
Real ROI examples
The business impact of democratized analytics extends beyond time savings to measurable financial outcomes across industries. In retail inventory optimization, companies using predictive analytics and real-time data access have reduced stockouts and overstocking by 30% through AI models that forecast consumer demand. The ability to ask natural language questions about inventory patterns – previously requiring SQL expertise – now enables store managers to identify issues before they become problems. Financial institutions implementing decision intelligence for real-time fraud detection have reduced false positives by 37%, with natural language interfaces allowing fraud analysts to explore patterns interactively rather than waiting for IT to build new detection rules. In manufacturing, one client implementing augmented analytics identified supply chain inefficiencies that saved $3.2 million annually – insights that emerged from self-service exploration that would have been impossible with traditional BI queuing systems. And organizations using predictive analytics in CRM report an average 25% sales increase and 30% improvement in customer satisfaction, with churn model users seeing a 25% reduction in customer attrition. These outcomes require analytics embedded in operational workflows – impossible at scale without democratized access.
Implementation architecture
The modern analytics stack
Democratized analytics requires architectural foundations that earlier self-service attempts lacked. The modern stack consists of:
1. Data platform layer. Cloud data platforms (Snowflake, Databricks, BigQuery, Redshift) provide the computational foundation with scalable storage and compute separation, native support for structured and semi-structured data, integration with AI/ML capabilities, and enterprise security and governance.
2. Semantic layer. The semantic layer translates technical data structures into business concepts. Implementation options include platform-native solutions (Snowflake Semantic Views + Cortex Analyst, Databricks Unity Catalog + LakehouseIQ), universal/headless options (Cube, AtScale, dbt Semantic Layer, GoodData), and BI-native approaches (Power BI DAX models, Looker LookML, Tableau Semantics, ThoughtSpot Models). Organizations increasingly favor universal semantic layers that serve multiple consumption tools simultaneously, avoiding lock-in to any single BI platform.
3. Natural language interface. AI-powered interfaces translate human questions into queries against the semantic layer. These range from integrated solutions (Snowflake Copilot, ThoughtSpot Spotter, Power BI Copilot) to API-based options (Snowflake Copilot API for custom application embedding) to multi-agent systems (MCP-enabled platforms that query across multiple data sources).
4. Governance framework. Democratized access requires enhanced governance, not reduced governance. This means row-level security (users only see data they’re authorized to access), data masking (sensitive fields obscured based on user role), audit logging (complete record of who accessed what), and usage monitoring (analytics on analytics to identify adoption patterns).
5. Data literacy program. Technology alone doesn’t democratize analytics – organizations need cultural and educational foundations. 63% of Fortune 1000 companies now invest in formal data literacy training, and Gartner predicts that by 2027, more than 50% of CDAOs will secure funding for data literacy and AI literacy programs. Critically, training must be role-specific – what a marketing analyst needs differs from what a sales manager needs.
The semantic model design process
Effective semantic layers don’t emerge automatically from raw data. They require deliberate design:
Step 1: Identify core entities. Begin with the fundamental business objects: customers, products, orders, employees, transactions. These become the building blocks that all metrics reference.
Step 2: Define relationships. Map how entities connect: customers place orders, orders contain products, products belong to categories. These relationships enable the joins that complex queries require.
Step 3: Establish metrics. For each key performance indicator, define its name (business-friendly label), formula (exact calculation logic), grain (at what level is it measured – transaction, day, customer?), owner (who is accountable for the definition?), and exception handling (how are edge cases treated?).
Step 4: Encode time logic. Define how time-based analysis works: fiscal calendar boundaries, year-to-date calculation start points, rolling period definitions, and comparison period logic.
Step 5: Implement governance. Apply access controls by determining who can see which entities, which fields require masking, and what audit requirements apply.
Step 6: Test and validate. Before deployment, verify calculations match finance systems of record, test edge cases and exception handling, validate performance at expected query volumes, and confirm governance rules work as intended.
The dbt Semantic Layer exemplifies modern practice: “Define governed semantic models and metrics as code using easy-to-configure YAML files. Everything is version-controlled, lineage-aware, and built for transparency.”
Common implementation pitfalls
Organizations implementing democratized analytics frequently stumble on predictable obstacles. The first is starting without strategy – jumping to tool selection before defining business objectives produces technology without purpose. The right starting point is asking: What decisions do we need to make faster? What questions can’t we answer today? The second pitfall is underinvesting in data quality. Self-service analytics amplifies data quality problems; if underlying data contains errors, more people will see those errors more quickly. Governance and quality must precede democratization. Third, ignoring change management. Technical deployment without cultural adoption produces expensive shelfware. Data literacy training, executive sponsorship, and explicit adoption goals are prerequisites for success. Fourth, semantic layer sprawl. If different teams build incompatible semantic layers, the “which number is right?” problem just moves upstream. Centralized governance of metric definitions is essential. Finally, neglecting maintenance. Semantic models require ongoing curation as business definitions evolve. Without designated ownership and maintenance processes, models drift from reality over time.
The future of business decision-making
The shift from reports to actions
Analytics democratization is just the first step in a larger transformation. The ultimate destination isn’t faster reports – it’s automated decision-making.
Decision intelligence – blending analytics, AI/ML, and decision modeling – represents the next evolution. Rather than surfacing insights for humans to interpret, decision intelligence systems predict outcomes of potential actions, recommend optimal choices based on business objectives, automate routine decisions within defined guardrails, and escalate exceptions that require human judgment. Gartner reported in 2025 that 75% of IT application leaders are piloting, deploying, or have already deployed some form of AI agents, and the decision intelligence market is projected to reach $74.23 billion by 2033.
This doesn’t eliminate human judgment – it reserves human attention for decisions that genuinely require it. When AI can reliably handle routine optimization (inventory reordering, pricing adjustments, resource allocation), human experts focus on strategic choices, edge cases, and novel situations.
Embedded analytics everywhere
Analytics is breaking free from dedicated BI tools. SR Analytics projects that by 2026, 80% of employees will consume insights directly within the business applications they use every day – CRM, ERP, collaboration platforms, and operational systems.
This shift from “go to the data” to “data comes to you” fundamentally changes how insights influence action. When a sales representative sees real-time win probability within their CRM interface, they don’t need to context-switch to a separate analytics tool. When a supply chain manager sees demand forecasts embedded in their planning system, insights translate immediately into decisions.
The agentic analytics platforms emerging in 2025 enable this embedded paradigm. ThoughtSpot’s Visual Embed SDK, for example, allows developers to embed full analytical capabilities within custom applications – making analytics invisible as a separate tool while preserving its functionality.
From analytics consumers to content creators
Gartner predicts that by 2026, 90% of current analytics content consumers will become content creators enabled by AI. The distinction between “people who build dashboards” and “people who view dashboards” is collapsing.
When natural language interfaces allow anyone to ask questions and receive visualizations, the barrier to creating analytical content disappears. A sales manager who sees an interesting pattern can immediately create a visualization to share with their team – no IT request, no dashboard development cycle, no waiting.
This democratization of creation has profound implications. Insights spread through organizations at the pace of conversation, not the pace of development cycles. Content created by domain experts incorporates business context that central BI teams often lack. And people use analytics they helped create more than analytics created for them. The governance challenge shifts from controlling who can create content to ensuring that created content draws from trusted, centralized definitions – exactly what semantic layers enable.
The human element
Technology enables democratization, but people determine whether it succeeds.
Gartner warns that through 2026, 50% of organizations will require AI-free assessments to ensure employees retain strong reasoning skills. The concern is legitimate: if AI handles all analytical work, human critical thinking may atrophy.
The solution isn’t to limit AI capabilities but to redefine human roles. In a democratized analytics environment, business users need data literacy to interpret AI-generated insights critically. Data professionals need to shift from query fulfillment to model building and governance. Executives need to understand enough about AI capabilities and limitations to make sound technology investments. And everyone needs critical thinking skills to question outputs that don’t make business sense. Organizations investing in both technology and human capability will outperform those who invest in either alone.
Getting started: the 90-day pilot framework
Organizations ready to democratize analytics should begin with focused pilots that prove value before scaling:
Weeks 1-2: Scope and strategy
- Identify a business domain with clear analytical pain points
- Define 3-5 key metrics that drive decisions in that domain
- Select a pilot user group (10-20 people) with varying technical backgrounds
- Establish success criteria: time-to-insight reduction, adoption rates, user satisfaction
Weeks 3-4: Foundation building
- Implement semantic layer for pilot metrics
- Define and document business logic, calculation methods, and edge case handling
- Configure governance: access controls, audit logging, data masking
- Integrate natural language interface with semantic layer
Weeks 5-6: Soft launch
- Train pilot users on new capabilities
- Provide hands-on workshops demonstrating natural language queries
- Establish feedback channels for issues and suggestions
- Monitor usage patterns and error rates
Weeks 7-10: Iteration
- Refine semantic models based on user feedback
- Expand metric coverage based on demand
- Address edge cases and exception handling
- Develop additional training materials
Weeks 11-12: Evaluation
- Measure outcomes against success criteria
- Document lessons learned
- Develop business case for expansion
- Create roadmap for enterprise rollout
Success metrics
Democratization success should be measured across multiple dimensions:
| Category | Metric | Target |
|---|---|---|
| Adoption | Active users / total potential users | >60% within 6 months |
| Velocity | Average time from question to answer | <10 minutes for routine queries |
| Trust | User confidence in data accuracy (survey) | >80% “confident” or “very confident” |
| Backlog | IT analytics request queue size | >50% reduction |
| Coverage | % of key metrics available via self-service | >80% |
| Quality | Error rate in AI-generated queries | <5% |
Governance non-negotiables
Democratization without governance creates chaos. Before expanding self-service access, ensure the foundations are in place. For access control, this means row-level security implemented and tested, role-based access aligned with job functions, and regular access reviews scheduled. For data quality: data validation rules in place, quality dashboards monitoring key metrics, and clear ownership for data sources. Audit capability requires query logging enabled, user activity tracking operational, and compliance reporting automated. And change management needs semantic model versioning implemented, change approval workflow defined, and a communication process for metric updates.
Key Takeaways
-
90% of organizations depend on 10% of employees for analytics. This bottleneck costs billions – business users wait days or weeks for answers that should take minutes while data teams drown in ad-hoc query requests.
-
Natural language interfaces achieve 95% SQL accuracy. Snowflake Cortex Analyst and similar platforms translate plain English questions into database queries, eliminating the SQL barrier that kept most business users locked out of direct data access.
-
Semantic layers are non-negotiable for AI success. Without explicit metric definitions, AI systems guess what “revenue” means – producing the same inconsistency that plagued manual analytics. Semantic layers encode business logic once and serve consistent answers everywhere.
-
Time-to-insight collapses from weeks to minutes. When queries take minutes instead of days, exploration becomes practical. Users can follow threads of inquiry, refining questions based on initial results rather than submitting batch requests and waiting.
-
IT report backlogs drop 71%. Self-service analytics shifts data team focus from reactive query fulfillment to proactive capability building – data modeling, advanced analytics, quality management, and strategic projects.
-
Agentic analytics shifts from pull to push. Next-generation systems don’t just answer questions – they proactively discover insights, identify anomalies, and recommend actions before users recognize the need to ask.
-
By 2026, 80% of employees will consume insights within operational applications. Analytics breaks free from dedicated BI tools, embedding directly in CRM, ERP, and workflow systems where insights immediately influence action.
-
90% of analytics consumers become content creators. When natural language interfaces let anyone create visualizations, the distinction between dashboard builders and dashboard viewers collapses – spreading insights at conversation speed.
-
Governance must scale with access. Democratization without row-level security, audit logging, and centralized metric definitions produces chaos faster than insights. Enhanced governance is prerequisite, not afterthought.
-
Human critical thinking remains essential. Data literacy programs ensure business users can interpret AI-generated insights critically. Technology enables democratization; people determine whether it succeeds.
Frequently asked questions
What is natural language analytics?
Natural language analytics allows users to ask business questions in plain English rather than writing SQL queries. AI-powered interfaces translate human questions into database queries, execute them, and return visualized results. Platforms like Snowflake Cortex Analyst achieve 95% accuracy on natural language to SQL conversion.
What is a semantic layer in analytics?
A semantic layer sits between raw data and applications, translating technical database structures into business-friendly concepts. It encodes metric definitions (how “revenue” is calculated), entity relationships, business rules, time logic, and access policies. This ensures consistent answers regardless of who asks or which tool generates the report.
Why do 90% of companies depend on 10% of employees for analytics?
SQL – the language required to query databases – is alien to most business users. Business expertise doesn’t translate to database expertise. The result is a translation layer where analysts interpret business questions, write queries, and iterate on results – a process that takes days for questions that should take minutes.
What is agentic analytics?
Agentic analytics refers to AI systems that don’t just answer questions but proactively discover insights, identify anomalies, and recommend actions. Rather than requiring users to formulate precise questions, these systems break complex inquiries into parts, synthesize results, and surface trends without being asked.
How much can natural language interfaces reduce analysis time?
Advanced NLP implementations result in a 40% reduction in analysis time for non-technical users while reducing dependency on data specialists. Self-service analytics with proper governance has reduced report backlogs by 71% for IT departments while increasing adoption company-wide.
What ROI can organizations expect from democratized analytics?
Retailers using predictive analytics reduced stockouts 30%. Financial institutions reduced fraud detection false positives 37%. One manufacturer identified supply chain efficiencies saving $3.2 million annually. Organizations report 25% sales increases and 30% customer satisfaction improvements with embedded analytics.
What are the common pitfalls in analytics democratization?
Key pitfalls include starting without business strategy (selecting tools before defining objectives), underinvesting in data quality (self-service amplifies errors), ignoring change management (technical deployment without adoption), semantic layer sprawl (incompatible definitions across teams), and neglecting maintenance (models drifting from reality).
What is decision intelligence?
Decision intelligence blends analytics, AI/ML, and decision modeling to move beyond insights to automated decision-making. Systems predict outcomes, recommend optimal choices, automate routine decisions within guardrails, and escalate exceptions requiring human judgment. The market is projected to reach $74.23 billion by 2033.
How will embedded analytics change business operations?
By 2026, 80% of employees will consume insights directly within business applications – CRM, ERP, collaboration tools – rather than separate BI tools. This “data comes to you” model means insights translate immediately into decisions without context-switching. Sales reps see win probability in their CRM; supply chain managers see forecasts in planning systems.
What governance is required for democratized analytics?
Essential governance includes row-level security (users see only authorized data), role-based access aligned with job functions, data validation and quality monitoring, query logging and user activity tracking, semantic model versioning with change approval workflows, and regular access reviews. Democratization without governance creates chaos.