A comprehensive guide to understanding how these two disciplines intersect, diverge, and work together to drive business growth. Learn when to use each approach, how to measure success, and why the distinction matters for your marketing strategy.
Spend enough time in digital marketing conversations and you will hear these terms used interchangeably. A CMO mentions their “performance marketing strategy” when describing lead generation campaigns. An agency pitches “lead generation services” while showing conversion rate metrics that belong in a performance marketing discussion. A job posting seeks a “performance marketer” whose primary responsibility is generating and distributing leads.
The confusion makes sense. Both disciplines share DNA. Both obsess over measurable results. Both live and die by conversion metrics. But treating them as synonyms leads to strategic mistakes: misallocated budgets, misaligned teams, and misunderstood results.
Performance marketing and lead generation are not the same thing, but they are deeply connected. Understanding the distinction, and the overlap, unlocks clearer thinking about marketing investment, team structure, and business model design.
This guide breaks down both disciplines in depth. You will learn what performance marketing actually means, how lead generation operates as both a tactic and a business model, where the two intersect, and how to choose the right approach for your specific situation. Whether you are building a marketing team, evaluating agencies, or designing acquisition strategy, clarity on these concepts will sharpen every decision you make.
Defining Performance Marketing
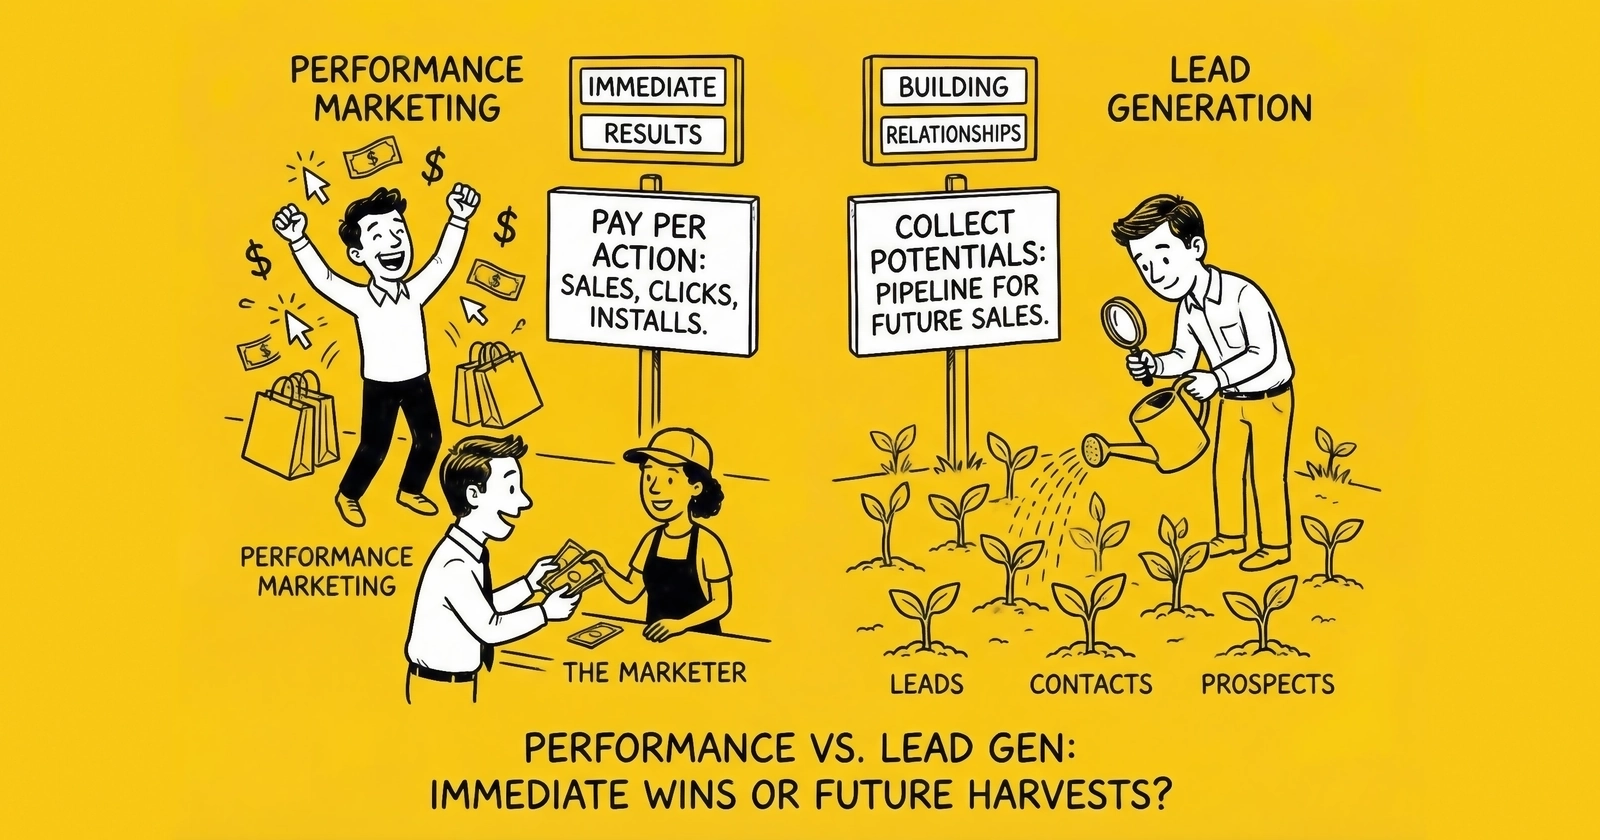
Performance marketing is a marketing approach where payment is tied directly to measurable actions. Unlike brand advertising purchased on impression or reach metrics, performance marketing connects spend to outcomes: clicks, leads, sales, app installs, or other defined conversions.
The fundamental principle: you pay for results, not exposure.
The Performance Marketing Model
Traditional advertising operates on a promise. You pay for airtime, print space, or digital impressions, hoping those exposures translate into business outcomes. The connection between spend and results remains indirect, measured through brand lift studies and correlation analysis rather than direct attribution.
Performance marketing inverts this relationship. The transaction happens after the desired action occurs. An affiliate partner earns commission only when their referred traffic makes a purchase. A cost-per-lead campaign charges only when someone fills out a form. A cost-per-acquisition model bills only upon completed sales.
This structure creates several dynamics that define the discipline:
Accountability. Every dollar spent connects to a measurable outcome. Campaign performance becomes transparent, enabling rapid optimization and clear ROI calculation.
Risk transfer. Publishers and platforms assume more risk, since they invest in traffic generation before knowing if that traffic will convert. This risk premium gets built into pricing.
Optimization pressure. Because payment ties to conversion, every participant in the chain optimizes relentlessly. Creative testing, landing page optimization, and audience refinement become continuous activities rather than periodic projects.
Core Performance Marketing Channels
Several channels and models fall under the performance marketing umbrella:
Affiliate marketing. Partners (affiliates) promote products or services in exchange for commissions on sales or leads they generate. The affiliate assumes traffic acquisition risk; the advertiser pays only for results. The affiliate marketing industry reached approximately $17 billion globally in 2024.
Paid search (PPC). While technically paying per click rather than per conversion, paid search functions as performance marketing because clicks represent a measurable action with direct connection to conversion tracking. Google Ads processed over $237 billion in advertiser spending in 2024.
Paid social advertising. Facebook, Instagram, TikTok, and LinkedIn offer conversion-optimized campaigns where advertisers bid toward specific actions. Meta alone generated over $132 billion in advertising revenue in 2024.
Display and programmatic. Performance-oriented display campaigns optimize toward clicks, conversions, or other actions rather than pure impression delivery.
Influencer marketing (performance-based). Increasingly, influencer partnerships structure compensation around measurable outcomes rather than flat fees. Performance-based influencer campaigns grew 30% year-over-year in 2024.
Connected TV and streaming. Emerging performance models allow direct-response advertising on streaming platforms with conversion tracking and attribution.
Key Performance Marketing Metrics
Performance marketers live by metrics that connect investment to outcome:
| Metric | Definition | Purpose |
|---|---|---|
| CPA (Cost Per Acquisition) | Total cost to acquire one customer | Comprehensive efficiency measure |
| CPC (Cost Per Click) | Cost for each ad click | Traffic efficiency |
| CPL (Cost Per Lead) | Cost to generate one lead | Lead generation efficiency |
| ROAS (Return on Ad Spend) | Revenue generated per dollar spent | Investment return |
| Conversion Rate | Percentage of visitors completing desired action | Funnel efficiency |
| LTV (Lifetime Value) | Total revenue from one customer over time | Long-term value assessment |
| CAC (Customer Acquisition Cost) | Full cost to acquire a customer | Complete cost picture |
The distinction between CPA and CAC matters. CPA typically measures media spend divided by conversions. CAC includes all acquisition costs: media, creative production, agency fees, platform costs, and labor. True CAC often runs 40-60% higher than platform-reported CPA.
The Performance Marketing Ecosystem
Performance marketing operates through a complex ecosystem of interconnected players:
Advertisers want customers at acceptable acquisition costs. They set budgets, define target outcomes, and measure results against business objectives.
Publishers and platforms provide inventory where ads appear. Google, Meta, TikTok, and thousands of smaller publishers sell access to audiences.
Agencies and buying teams manage campaigns, optimize performance, and navigate platform complexity on behalf of advertisers.
Tracking and attribution providers measure what happens across the customer journey, connecting marketing touchpoints to conversions.
Affiliate networks aggregate supply and demand for performance partnerships, handling tracking, payments, and relationship management.
This ecosystem has grown enormously. Global digital advertising spending exceeded $600 billion in 2024, with the majority operating on some form of performance basis.
Defining Lead Generation
Lead generation is the process of identifying and capturing potential customers who have expressed interest in a product or service. A lead is not merely contact information. A lead represents consumer intent, captured at the moment of expression, packaged with permission to make contact, and sold or used within a time window where that intent retains commercial value.
Lead Generation as a Process
At its core, lead generation transforms anonymous traffic into identified prospects. Someone searching for auto insurance quotes finds a comparison website. They fill out a form, providing their contact information, vehicle details, and coverage preferences. That form submission creates a lead: a package of data representing someone actively shopping for a product.
The lead generation process typically follows this flow:
Awareness. Consumer encounters advertising, content, or search results matching their intent.
Capture. Consumer provides contact information and relevant data through a form, call, or chat interaction.
Validation. Systems verify the data is accurate: phone number works, email is deliverable, address exists.
Routing. The lead enters systems that match it to potential buyers based on geography, product interest, and qualification criteria.
Delivery. Buyer receives the lead data through API integration, CRM sync, or manual transfer.
Contact. Buyer reaches out to convert the lead into a customer.
The value chain involves multiple specialized players. Lead generators create leads from traffic. Aggregators and distributors match supply with demand. Buyers convert leads into customers. Each position requires different skills, capital, and risk tolerance.
Lead Generation as a Business Model
Lead generation is not just a marketing tactic. It is an entire industry operating its own economy. The lead generation market represents approximately $5-10 billion annually in the United States, with projections reaching $15-32 billion globally by the early 2030s.
More than 21,000 lead generation businesses operate in the United States alone. Public companies in this space include MediaAlpha (2024 revenue: $864.7 million), EverQuote ($500.2 million), QuinStreet ($613.5 million), and LendingTree (approximately $900 million).
Unlike traditional marketing where companies generate leads for their own use, the lead generation industry treats leads as tradeable assets. Leads are created, valued, bought, sold, and distributed through marketplace mechanisms.
The economics vary by vertical:
| Vertical | CPL Range | Customer LTV | Typical Conversion |
|---|---|---|---|
| Auto Insurance | $25-75 | $1,500-3,000 | 4-7% |
| Medicare | $30-80 | $800-1,200 | 6-10% |
| Mortgage | $50-150 | $3,000-8,000 | 1-2% |
| Solar | $75-200 | $5,000-15,000 | 1-3% |
| Legal (PI) | $200-500 | $10,000+ | 0.5-1% |
These numbers illustrate why lead generation functions as its own economy. The spread between lead cost and customer value creates margin for specialized intermediaries who can generate, validate, route, and deliver leads more efficiently than end buyers could do themselves.
Key Lead Generation Metrics
Lead generation businesses track metrics specific to their position in the value chain:
| Metric | Definition | Who Tracks It |
|---|---|---|
| CPL (Cost Per Lead) | Cost to generate one lead | Generators, buyers |
| EPL (Earnings Per Lead) | Net revenue per lead after returns | Generators, aggregators |
| Conversion Rate (Traffic to Lead) | Percentage of visitors who submit forms | Generators |
| Contact Rate | Percentage of leads successfully reached | Buyers |
| Return Rate | Percentage of leads rejected by buyers | All participants |
| Fill Rate | Percentage of pings resulting in posts | Aggregators |
| Sell-Through Rate | Percentage of leads that actually sell | Generators |
Return rate deserves special attention. Industry average return rates run 8-15%, meaning a significant percentage of leads that appear sold actually generate refund requests. A source with 5% returns is worth multiples more than a source with 20% returns at identical CPL.
The Key Differences
Understanding where performance marketing and lead generation diverge clarifies when to use each approach and how to evaluate success.
Objective and Outcome
Performance marketing optimizes toward a defined conversion event. That event might be a purchase, a signup, an app install, or a lead submission. The discipline remains agnostic about what happens after conversion. A performance marketer succeeds when the target CPA is achieved, regardless of downstream outcomes.
Lead generation focuses specifically on capturing qualified prospects and, often, monetizing them as tradeable assets. The objective extends beyond the form submission to include lead quality, buyer acceptance, and actual revenue collection. A lead generator who hits CPL targets but faces 25% return rates has not succeeded.
This distinction matters operationally. Performance marketing teams celebrate when campaigns hit efficiency targets. Lead generation operations celebrate when cash actually collects after returns, chargebacks, and float costs.
Revenue Model
Performance marketing typically serves as a cost center or customer acquisition function within a larger business. The company sells products or services; marketing generates customers who buy those products. Marketing success is measured by customer acquisition efficiency and contribution to revenue.
Lead generation often operates as a revenue-generating business model itself. The lead is the product. Revenue comes from selling leads to buyers, not from downstream product sales. This creates fundamentally different incentive structures.
A performance marketer at an insurance carrier wants leads that convert to policyholders. A lead generator selling to that carrier wants leads the carrier accepts and pays for. These objectives align imperfectly. The carrier cares about claim ratios and customer lifetime value. The generator cares about passing validation and avoiding returns.
Time Horizon
Performance marketing typically operates on campaign timelines: daily optimization, weekly reporting, monthly performance reviews, quarterly planning. The focus is on current-period results with forward projections based on recent trends.
Lead generation involves longer cash flow timelines that complicate measurement. The 60-day float rule governs lead brokerage: you pay suppliers within 7-15 days, but buyers pay you within 30-45 days. This gap means current campaign performance does not translate to current cash position. A “profitable” month of lead generation might precede a cash crisis if return rates spike or buyer payments delay.
Value Attribution
Performance marketing attributes value at the conversion event. When someone completes the target action, the campaign receives credit. Attribution models (first-touch, last-touch, multi-touch) distribute credit across touchpoints, but the conversion itself defines success.
Lead generation requires attributing value further downstream. A lead that submits successfully but gets returned is worth less than a lead that sells, gets contacted, and converts to a customer. True lead value often cannot be known for weeks or months after capture.
This creates measurement challenges. Platform-reported CPL may show $50, but true CPL after returns, validation costs, and compliance expenses might be $75. Lead generators who optimize toward dashboard metrics rather than collected revenue systematically make poor decisions.
Risk Profile
Performance marketing risk concentrates in media spend efficiency. Poor campaigns waste budget. Good campaigns drive profitable growth. The risk is operational and immediate.
Lead generation carries additional risks beyond media efficiency:
Working capital risk. The float between paying suppliers and collecting from buyers can exceed $500,000 for mid-sized operations. Undercapitalization is the most common cause of lead brokerage failure.
Return risk. Leads that appear sold generate refund requests days or weeks later. A sudden spike in returns can transform profitable months into losses after the fact.
Compliance risk. TCPA violations carry $500-$1,500 per call, with class action settlements averaging $6.6 million as covered in our TCPA litigation guide. Consent documentation errors can create existential liability.
Buyer concentration risk. Dependence on a few large buyers creates vulnerability if any relationship sours or if buyers change terms.
Technology Requirements
Performance marketing requires advertising platforms, analytics tools, and attribution systems. Standard technology stacks include ad platforms (Google Ads, Meta), analytics (Google Analytics, Mixpanel), and potentially CDP or marketing automation tools.
Lead generation requires additional specialized infrastructure:
- Lead distribution platforms (boberdoo, LeadsPedia, Phonexa) for routing and selling
- Validation services for phone, email, and address verification
- Consent certification (TrustedForm, Jornaya) for compliance documentation
- CRM integrations for buyer delivery
- Ping/post auction systems for real-time bidding
Platform costs for serious lead generation operations run $500-$2,500 monthly plus per-lead fees of $0.10-$0.50 across validation and compliance services.
Where They Overlap
Despite meaningful differences, performance marketing and lead generation share substantial common ground. Understanding the overlap prevents false dichotomies and enables integrated strategy.
Shared Channels
Both disciplines use the same advertising channels:
Paid search drives high-intent traffic for both performance marketers and lead generators. Google Ads remains the dominant channel for capturing declared purchase intent. The 2025 average CPL across industries runs approximately $70, with significant vertical variation.
Paid social reaches consumers through Facebook, Instagram, TikTok, and LinkedIn. Performance marketers optimize social campaigns toward sales or app installs. Lead generators optimize toward form completions. The same creative testing principles, audience refinement techniques, and bidding strategies apply.
Native advertising through Taboola, Outbrain, and similar platforms serves both disciplines. The global native advertising market reached $104.63 billion in 2024.
SEO and content marketing generate organic traffic that converts to both direct sales and lead submissions.
Shared Optimization Principles
Core optimization principles transcend the distinction:
Conversion rate optimization matters equally. A 2-percentage-point improvement in landing page conversion rate reduces CPL by $20-40 on typical campaigns. The techniques: faster page load, mobile optimization, clear CTAs, multi-step forms, trust signals, reduced friction.
Audience targeting follows the same logic. Lookalike audiences, retargeting, interest-based targeting, and demographic refinement work identically whether optimizing toward sales or lead submissions.
Creative testing drives performance in both contexts. Testing 10+ creative variations per campaign, refreshing ads every 2-4 weeks, and front-loading hooks in the first 2-3 seconds apply universally.
Bidding strategy selection follows parallel paths. Target CPA bidding, manual bidding for control, portfolio strategies for scale, all translate across contexts.
Shared Measurement Challenges
Both disciplines face the same measurement complexities:
Attribution challenges. Multi-touch customer journeys make credit assignment difficult. First-touch, last-touch, and algorithmic attribution models apply equally to performance marketing and lead generation, as explained in our multi-touch attribution guide. In 2024, 57% of brands and agencies used multi-touch attribution despite implementation challenges.
Privacy restrictions. Safari’s Intelligent Tracking Prevention, Chrome’s evolving cookie policies, and App Tracking Transparency affect all digital marketing. An estimated 30% of web traffic now uses privacy-first browsing that limits tracking.
Platform measurement bias. Ad platforms benefit from showing strong performance. Self-reported metrics from Google, Meta, and other platforms systematically favor the platform. Both performance marketers and lead generators need independent measurement validation.
Cross-device fragmentation. Consumers use 3-4 devices during purchase research. Connecting touchpoints across devices challenges both disciplines equally.
Lead Generation as a Performance Marketing Tactic
This is the conceptual bridge that causes confusion: lead generation is often a tactic within a performance marketing strategy.
A mortgage lender running performance marketing campaigns to acquire customers might optimize some campaigns toward direct applications and others toward lead form submissions for phone follow-up. Both are performance marketing. The lead generation campaign is simply targeting a different conversion event.
Similarly, a solar installer might run their own paid search campaigns (performance marketing) while also purchasing leads from third-party generators. The purchased leads originated from someone else’s lead generation business, but the installer evaluates them as part of their overall performance marketing portfolio.
The distinction matters when lead generation becomes a standalone business model rather than a customer acquisition tactic. Selling leads to third parties involves different economics, different metrics, and different risks than generating leads for internal sales teams.
When to Use Each Approach
Choosing between performance marketing focus and lead generation focus depends on your business model, capabilities, and objectives.
Choose Performance Marketing When
You sell directly to consumers. E-commerce companies, SaaS businesses, direct-to-consumer brands, and service providers who close their own sales should focus on performance marketing. The objective is customer acquisition, not lead monetization.
Your sales cycle is short. When purchases happen in a single session or within days, optimizing toward the sale makes more sense than capturing leads for later follow-up.
You have in-house sales capacity. If your team can contact and close leads you generate, keeping the process internal maximizes margin. External lead generation adds margin for intermediaries.
You want full funnel control. Performance marketing enables end-to-end optimization from impression to purchase. Buying leads from third parties introduces quality variance you cannot directly control.
Choose Lead Generation When
You lack sales infrastructure. Businesses without call centers or sales teams often find it easier to buy leads than generate them internally. The lead generator handles traffic acquisition; the buyer handles conversion.
You need specific lead types. Some lead types require specialized expertise to generate. A personal injury law firm excels at litigation, not at media buying. Purchasing leads from specialists can be more efficient than building internal capability.
You want a revenue-generating business model. If your goal is building a lead generation company rather than acquiring customers, you’re choosing lead generation as a business, not a tactic.
Volume requirements exceed internal capacity. Companies needing thousands of monthly leads often find that buying some portion from external sources provides necessary scale while internal generation builds.
The Hybrid Approach
Most sophisticated operations blend both approaches:
Internal lead generation for maximum control and margin on core customer acquisition.
External lead purchasing for incremental volume, geographic expansion, or capacity smoothing.
Performance marketing for direct-to-sale campaigns where the product supports immediate conversion.
Progressive Insurance, for example, runs direct performance marketing campaigns, operates internal lead generation, and purchases leads from third-party aggregators. The combination provides scale, diversity, and optimization across multiple acquisition channels.
The hybrid approach requires unified measurement. A lead generated internally at $40 CPL might seem more expensive than a purchased lead at $35, but if internal leads convert at 10% versus 6% for purchased leads, the internal leads deliver superior customer acquisition cost.
Hybrid Model Implementation: The BRIDGE Framework
The most successful marketing operations do not choose between performance marketing and lead generation – they build bridges between both approaches. The BRIDGE framework provides a structured methodology for implementing hybrid acquisition models that maximize strengths while mitigating weaknesses of each approach.
B – Budget Allocation by Funnel Stage
Hybrid operations require distinct budget pools with different success metrics for each stage of the customer journey.
Recommended Budget Allocation for Hybrid Operations:
| Funnel Stage | Channel Mix | Budget Share | Primary Metric |
|---|---|---|---|
| Awareness | Programmatic, Social, Native | 15-25% | Cost per engaged visitor |
| Consideration | Paid Search, SEO, Content | 25-35% | Cost per qualified lead |
| Decision | Retargeting, Lead Purchasing | 30-40% | Cost per opportunity |
| Conversion | Direct Sales, Remarketing | 10-20% | Cost per acquisition |
Implementation Example: Regional Insurance Agency
A regional insurance agency with $150,000 monthly acquisition budget implemented budget allocation as follows:
- Awareness (18%): $27,000 on programmatic display and Facebook reach campaigns targeting homeowners 35-65 in their service area
- Consideration (32%): $48,000 split between Google Ads for quote-intent keywords ($28,000) and content marketing/SEO ($20,000)
- Decision (35%): $52,500 purchasing exclusive leads from two aggregators ($35,000) plus retargeting campaigns ($17,500)
- Conversion (15%): $22,500 on remarketing to abandoned quotes and direct mail to warm leads
Result: Blended CAC decreased from $385 to $312 while total policy volume increased 28% over six months.
R – Revenue Attribution Across Hybrid Channels
Hybrid models create attribution complexity that must be addressed systematically to prevent misallocation.
The Unified Attribution Model:
Implement a weighted attribution system that acknowledges both first-touch awareness building and last-touch conversion credit:
- First touch: 30% credit (acknowledges awareness investment)
- Lead creation touch: 40% credit (recognizes conversion event significance)
- Last touch: 30% credit (credits final conversion driver)
Practical Attribution Example:
A consumer sees a display ad (first touch), clicks a Google ad for “auto insurance quotes” two weeks later (lead creation), and converts after receiving a remarketing email (last touch).
Attribution distribution:
- Display campaign: 30% of customer value credited
- Paid search campaign: 40% of customer value credited
- Email remarketing: 30% of customer value credited
This prevents the common error of over-crediting last-touch channels (typically remarketing and brand search) while under-investing in awareness channels that fill the funnel.
I – Integration Architecture for Unified Operations
Technical integration determines whether hybrid operations succeed or devolve into siloed teams competing for budget.
Required Integration Points:
| System A | System B | Integration Purpose | Data Flow |
|---|---|---|---|
| Ad platforms | CRM | Attribution, ROAS calculation | Bidirectional |
| Lead vendors | CRM | Lead ingestion, source tracking | Vendor to CRM |
| CRM | Call tracking | Phone attribution, recording | Bidirectional |
| Marketing automation | CRM | Nurture status, lead scoring | Bidirectional |
| BI platform | All sources | Unified reporting | Inbound only |
Integration Implementation Example: Solar Installation Company
A solar installation company unified their hybrid operation through the following integration stack:
- HubSpot CRM as central data hub receiving leads from all sources
- CallRail tracking phone calls with unique numbers per channel (Google Ads, Facebook, Angi, purchased leads)
- Segment CDP collecting behavioral data from website and feeding all downstream systems
- Tableau dashboards pulling unified data for executive reporting
This integration revealed that Angi leads (purchased at $85 each) actually outperformed internal Google leads ($62 each) on a cost-per-installed-system basis because Angi leads had higher average system sizes ($28,500 vs. $22,300).
D – Demand Forecasting Across Channels
Hybrid operations require coordinated demand forecasting to prevent over-purchasing leads when internal generation is strong or under-purchasing during internal slowdowns.
The Demand Cascade Model:
- Sales capacity planning: Determine how many leads sales teams can effectively work (typically 15-25 leads per rep per week for phone sales)
- Internal generation forecast: Project leads from owned channels based on historical performance and planned investment
- Gap calculation: Calculate shortfall between capacity and internal forecast
- External purchasing plan: Contract for lead volume to fill the gap with buffer for variance
Forecasting Example: Mortgage Broker
Monthly sales capacity: 800 leads (20 loan officers × 40 leads/month)
Internal forecast by channel:
- Paid search: 280 leads (35%)
- SEO/organic: 120 leads (15%)
- Referrals: 80 leads (10%)
- Total internal: 480 leads (60% of capacity)
Gap requiring external purchase: 320 leads (40% of capacity)
External lead purchasing plan:
- Primary vendor (exclusive leads): 200 leads at $85 = $17,000
- Secondary vendor (shared leads): 180 leads at $45 = $8,100 (over-purchases to account for lower contact rates)
- Total external investment: $25,100
This structured approach prevents the common failure mode of purchasing leads without capacity to work them, or starving sales teams when internal channels underperform.
G – Governance and Team Structure
Hybrid operations require clear governance to prevent internal conflict between teams with different incentive structures.
Recommended Hybrid Team Structure:
| Role | Responsibility | Reports To |
|---|---|---|
| VP Marketing | Overall acquisition strategy, budget allocation | CMO/CEO |
| Performance Marketing Lead | Owned channel optimization, ROAS targets | VP Marketing |
| Lead Purchasing Manager | Vendor relationships, external lead quality | VP Marketing |
| Marketing Operations | Integration, attribution, reporting | VP Marketing |
| Demand Generation | Content, SEO, awareness campaigns | VP Marketing |
Critical Governance Mechanisms:
- Weekly pipeline review: Joint meeting reviewing lead volume, quality, and conversion by source
- Monthly attribution reconciliation: Formal review of cross-channel attribution to prevent gaming
- Quarterly vendor assessment: Structured evaluation of external lead sources with clear continuation/termination criteria
- Annual strategy alignment: Full review of channel mix, budget allocation, and team structure
Governance Example: Home Services Company
A home services company implemented monthly “source quality councils” where performance marketing, lead purchasing, and sales operations jointly reviewed:
- Contact rate by source (target: >75% for purchased leads, >85% for internal)
- Appointment booking rate by source (target: >35%)
- Close rate by source (target: >40%)
- Average ticket by source (target: >$450)
Sources consistently missing two or more targets for two consecutive months were either paused (internal channels for optimization) or terminated (external vendors).
E – Economic Optimization Across the Hybrid Portfolio
The comprehensive goal of hybrid operations is optimizing total acquisition cost across the entire portfolio, not minimizing cost in any single channel.
The Portfolio Efficiency Matrix:
| Source Type | Volume Role | Cost Role | Quality Role |
|---|---|---|---|
| Branded search | Low volume, high intent | Lowest CAC | Highest quality |
| Non-brand search | Moderate volume | Medium CAC | High quality |
| Paid social | High volume potential | Variable CAC | Variable quality |
| Exclusive leads | Flexible volume | Higher CAC | Quality guaranteed |
| Shared leads | High volume | Lowest CAC | Lower quality |
Portfolio Optimization Example: Legal Services Firm
A personal injury firm analyzed their portfolio and found:
| Source | Monthly Volume | CAC | Signed Cases | Case Value |
|---|---|---|---|---|
| Google Ads (branded) | 45 leads | $125 | 6 cases | $42,000 avg |
| Google Ads (non-brand) | 180 leads | $285 | 12 cases | $38,000 avg |
| LSA | 120 leads | $190 | 10 cases | $35,000 avg |
| Purchased exclusive | 200 leads | $340 | 14 cases | $31,000 avg |
| Purchased shared | 350 leads | $180 | 8 cases | $28,000 avg |
Analysis revealed that while shared leads had the lowest CAC, their lifetime value lagged significantly. The firm reallocated budget from shared leads to LSA and exclusive purchases, accepting higher CAC in exchange for higher case values.
New portfolio allocation increased total signed case value by 18% while reducing marketing spend by 7%.
The Marginal Efficiency Principle:
Add volume to the channel with the best marginal efficiency until efficiency degrades, then shift to the next most efficient channel. This requires ongoing measurement rather than set-it-and-forget-it allocation.
Practical application: A mortgage company found their Google Ads performed well up to $50,000/month spend, after which CPL increased 40%. Rather than pushing further into paid search, they allocated the next $30,000 to purchased leads where CPL remained stable at higher volumes.
The DELTA Framework: Performance Marketing to Lead Generation Transition Assessment
Organizations considering expansion from pure performance marketing into lead generation operations frequently underestimate the operational complexity involved. The DELTA framework provides a systematic assessment methodology for evaluating transition readiness and identifying capability gaps before committing resources.
D – Data Infrastructure Gap Analysis
Lead generation operations require data infrastructure capabilities that most performance marketing organizations lack. The gap between performance marketing data needs and lead generation requirements determines transition complexity.
Data Infrastructure Comparison Matrix:
| Capability | Performance Marketing Standard | Lead Generation Requirement | Gap Severity |
|---|---|---|---|
| Lead storage | Campaign-level aggregation | Individual record management | Critical |
| Contact data handling | Limited PII exposure | Full PII management | Critical |
| Consent documentation | Basic pixel consent | Full TCPA compliance records | Critical |
| Real-time processing | Hourly acceptable | Sub-second required | High |
| Integration count | 5-10 platforms | 20-50+ buyer systems | High |
| Data retention | 90 days typical | 5+ years for compliance | Medium |
| Duplicate detection | Not required | Real-time cross-source | High |
Infrastructure Investment Benchmarks by Transition Scope:
| Transition Scope | Minimum Infrastructure Investment | Time to Operational | Monthly Operating Cost |
|---|---|---|---|
| Single vertical pilot | $15,000-35,000 | 2-4 months | $1,500-3,500 |
| Multi-vertical launch | $50,000-120,000 | 4-8 months | $5,000-12,000 |
| Enterprise scale operation | $200,000-500,000 | 8-18 months | $15,000-40,000 |
Data Quality Benchmarks for Lead Generation:
| Quality Metric | Minimum Viable | Competitive Standard | Market Leader |
|---|---|---|---|
| Phone validity rate | 85% | 92% | 97% |
| Email deliverability | 90% | 95% | 98% |
| Address standardization | 80% | 90% | 95% |
| Duplicate detection accuracy | 90% | 95% | 99% |
| Consent certificate capture | 95% | 99% | 99.9% |
E – Economic Model Transformation Analysis
The economic models of performance marketing and lead generation differ in fundamental ways that affect pricing, cash flow, and profitability calculations.
Cash Flow Timing Comparison:
| Economic Factor | Performance Marketing | Lead Generation | Adjustment Required |
|---|---|---|---|
| Payment timing | Net 30-60 from platforms | Net 7-15 to suppliers | Faster payables |
| Revenue timing | Within platform cycle | Net 30-45 from buyers | Slower receivables |
| Float exposure | Minimal | 45-75 days typical | Working capital |
| Return exposure | Chargebacks only | 10-18% lead returns | Reserve requirements |
| Revenue certainty | High (contracted CPMs) | Variable (market-based) | Forecasting complexity |
Working Capital Requirements by Operation Size:
| Monthly Lead Volume | Minimum Working Capital | Comfortable Reserve | Conservative Reserve |
|---|---|---|---|
| 5,000-15,000 leads | $75,000 | $125,000 | $200,000 |
| 15,000-50,000 leads | $200,000 | $350,000 | $500,000 |
| 50,000-150,000 leads | $500,000 | $850,000 | $1,200,000 |
| 150,000+ leads | $1,000,000+ | $1,750,000+ | $2,500,000+ |
Margin Structure Comparison:
| Margin Component | Performance Marketing | Lead Generation | Variance Impact |
|---|---|---|---|
| Gross margin | 40-65% | 22-38% | Lower ceiling |
| Operating margin | 15-30% | 8-18% | Higher volume required |
| Net margin | 8-20% | 5-12% | Scale sensitivity |
| Revenue per employee | $200K-400K | $400K-800K | Different scaling |
Profitability Transition Formula:
Lead gen profitability = (Average EPL × Monthly volume) - (Media cost + Platform fees + Validation cost + Compliance cost + Returns) - (Fixed operating costs)
Target EPL should exceed media cost per lead by minimum 40% to accommodate variable costs and returns.
L – Legal and Compliance Readiness Assessment
TCPA and state-level regulations create compliance requirements that performance marketing organizations have no experience managing. Non-compliance creates existential liability.
Compliance Capability Assessment:
| Capability | Not Required for Performance Marketing | Critical for Lead Generation | Implementation Cost |
|---|---|---|---|
| Consent capture systems | Basic cookie consent | Full TCPA documentation | $5,000-25,000 |
| DNC scrubbing | Not applicable | Real-time required | $500-2,000/month |
| State registration | Marketing licenses only | Lead seller registration | $10,000-50,000+ |
| Consent archiving | 90 days typical | 5+ years required | $1,000-5,000/month |
| Audit trail documentation | Basic analytics | Full chain of custody | $2,000-10,000 setup |
| Legal review | Standard contracts | Specialized lead contracts | $15,000-50,000/year |
Compliance Risk Benchmarks:
| Risk Category | Exposure Level | Typical Penalty | Mitigation Cost |
|---|---|---|---|
| TCPA class action | High (uncapped) | $6.6M average settlement | $50,000-150,000/year |
| State AG enforcement | Medium | $10,000-500,000 | $25,000-75,000/year |
| FCC enforcement | Medium | $500-$1,500 per call | $15,000-50,000/year |
| Buyer chargebacks | Low-Medium | Revenue impact only | Operational |
| Data breach | Medium | $150-300 per record | $20,000-100,000/year |
Required Legal Documentation:
| Document Type | Performance Marketing Standard | Lead Generation Requirement |
|---|---|---|
| Privacy policy | Standard template | Lead-generation specific |
| Terms of service | Standard template | Lead sale disclosures |
| Consent forms | Basic opt-in | TCPA-compliant PEWC |
| Buyer agreements | N/A | Custom lead sale contracts |
| Seller agreements | Publisher agreements | Source compliance guarantees |
| Indemnification | Standard mutual | Lead-specific provisions |
T – Team Capability Gap Identification
Lead generation requires specialized roles that do not exist in typical performance marketing organizations. Building or acquiring these capabilities takes 6-18 months.
Role Comparison Analysis:
| Function | Performance Marketing Role | Lead Generation Role | Translation Difficulty |
|---|---|---|---|
| Traffic acquisition | Media buyer | Lead source manager | Medium (skills transfer) |
| Campaign optimization | Campaign manager | Distribution manager | High (different KPIs) |
| Analytics | Marketing analyst | Lead quality analyst | High (different metrics) |
| Technology | Marketing ops | Lead platform admin | High (different systems) |
| Partnerships | Agency/vendor management | Buyer relationship manager | Very High (new skillset) |
| Compliance | Privacy/legal liaison | Compliance specialist | Very High (new function) |
Team Building Timeline Benchmarks:
| Team Function | Hire Timeline | Training Timeline | Full Productivity |
|---|---|---|---|
| Lead platform operations | 1-2 months | 3-4 months | 6-8 months |
| Buyer relationship management | 2-3 months | 4-6 months | 9-12 months |
| Lead quality analysis | 1-2 months | 2-3 months | 4-6 months |
| Compliance management | 2-4 months | 3-6 months | 8-12 months |
| Source quality control | 1-2 months | 3-4 months | 6-9 months |
Compensation Benchmarks for Lead Generation Roles:
| Role | Performance Marketing Equivalent | Lead Generation Salary Range | Premium |
|---|---|---|---|
| Lead operations manager | Marketing ops manager | $85,000-130,000 | +15-25% |
| Buyer development director | Business development | $120,000-180,000 | +20-30% |
| Compliance officer | Legal/privacy liaison | $100,000-160,000 | +25-40% |
| Lead quality analyst | Marketing analyst | $70,000-100,000 | +10-20% |
| Platform administrator | Marketing technologist | $80,000-120,000 | +15-25% |
A – Asset and Relationship Inventory Assessment
Successful transition depends on existing assets that transfer value and relationships that open opportunities.
Transferable Asset Evaluation:
| Asset Type | Transfer Value | Lead Gen Application | Modification Required |
|---|---|---|---|
| Traffic sources | High | Lead generation sources | Landing page changes |
| Audience data | Medium-High | First-party lead generation | Consent re-qualification |
| Creative assets | Medium | Lead capture adaptation | CTA and offer revision |
| Technical infrastructure | Low-Medium | Limited direct transfer | Significant rebuild |
| Tracking systems | Medium | Attribution foundation | Lead-specific enhancement |
| Vendor relationships | Variable | Platform leverage | New negotiations |
Relationship Asset Assessment:
| Relationship Type | Value for Lead Gen Transition | Leverage Opportunity |
|---|---|---|
| Publisher relationships | High | Direct source recruitment |
| Platform relationships | Medium | Better terms, early access |
| Agency relationships | Medium | Referral to lead buyers |
| Client relationships | High | Potential lead buyers |
| Technology vendors | Medium | Integration acceleration |
| Legal/compliance vendors | Low | Must establish new relationships |
Strategic Asset Gap Analysis:
| Strategic Asset | Typical PM Operation | Lead Gen Requirement | Gap |
|---|---|---|---|
| First-party data volume | 100K-500K records | 1M+ records preferred | Medium-High |
| Buyer relationships | Zero | 10+ active buyers minimum | Critical |
| Compliance infrastructure | Basic | Comprehensive | Critical |
| Working capital | $50K-200K reserves | $200K-1M+ required | High |
| Industry expertise | General marketing | Vertical specialization | Medium |
DELTA Framework Scoring Matrix
Calculate transition readiness using component scores:
| Factor | Score (1-10) | Weight | Weighted Score | Notes |
|---|---|---|---|---|
| Data infrastructure (D) | ___ | 2.0x | ___ | Current capabilities vs requirements |
| Economic model (E) | ___ | 2.5x | ___ | Working capital and margin readiness |
| Legal/compliance (L) | ___ | 2.0x | ___ | Infrastructure and expertise |
| Team capability (T) | ___ | 1.5x | ___ | Current skills vs requirements |
| Asset inventory (A) | ___ | 1.0x | ___ | Transferable value assessment |
| Total | 9.0x | ___ |
Interpretation:
- Score under 35: Not recommended without major investment
- Score 35-50: Proceed with pilot in single vertical, significant buildout required
- Score 50-65: Reasonable foundation, targeted investments needed
- Score 65-80: Strong foundation, focus on specific gaps
- Score over 80: Well-positioned for rapid transition
Measurement and Success Metrics
Success measurement differs meaningfully between performance marketing and lead generation contexts.
Performance Marketing Success Metrics
Performance marketers typically evaluate success through:
ROAS (Return on Ad Spend). Revenue generated per dollar of advertising investment. A 4:1 ROAS means each dollar spent generated four dollars in revenue.
CPA (Cost Per Acquisition). Cost to acquire one customer. Target CPA depends on customer lifetime value. A sustainable ratio is typically 3:1 LTV to CAC.
Conversion Rate. Percentage of visitors who complete the desired action. Industry averages run 3-7% for most verticals.
Customer Lifetime Value. Total revenue expected from one customer over time. This determines maximum acceptable acquisition cost.
Incrementality. The true causal impact of marketing spend. Incrementality testing reveals that platform-reported performance often overstates actual lift. Companies implementing incrementality measurement achieve 10-20% efficiency improvements.
Lead Generation Success Metrics
Lead generators evaluate success through different lenses:
EPL (Earnings Per Lead). Net revenue actually collected per lead after returns, chargebacks, and costs. Target EPL should be 15-20% of gross sale price for healthy operations.
Sell-Through Rate. Percentage of generated leads that successfully sell to buyers. Low sell-through indicates buyer mismatch or quality issues.
Return Rate. Percentage of sold leads that buyers reject post-purchase. Industry average runs 8-15%. Above 18% indicates serious problems.
Float Management. Cash position relative to payables and receivables. The 60-day float rule requires maintaining working capital equal to approximately 60 days of operation.
Source-Level Profitability. Lead-level P&L analysis by traffic source, geography, and buyer. Aggregate metrics hide that some sources profit while others destroy margin.
True Cost Per Lead Calculation
Both disciplines benefit from understanding true CPL, which extends far beyond platform-reported numbers.
Dashboard CPL captures media spend divided by leads generated. True CPL includes:
| Cost Category | Typical Per-Lead Impact |
|---|---|
| Returns/refunds | 8-15% of CPL added |
| Compliance (TrustedForm, Jornaya) | $0.15-0.75 |
| Validation (phone, email) | $0.05-0.25 |
| Platform fees | $0.10-0.50 |
| Testing costs | 15-25% of media spend |
| Creative production | $0.50-3.00 |
| Agency fees | 10-20% of media spend |
| Labor allocation | $1.00-5.00 |
| Float cost | $0.50-1.50 |
A $50 dashboard CPL often translates to $75-90 true CPL when all costs are allocated. Decisions made on dashboard CPL systematically overstate profitability.
Building the Right Team
Team structure differs between performance marketing organizations and lead generation businesses.
Performance Marketing Team Structure
Typical performance marketing teams include:
Paid Media Specialists. Platform experts managing Google, Meta, TikTok, and other advertising channels. Specialization by platform is common at scale.
Creative/Design. Producing ad creative, landing pages, and conversion assets. The same targeting with different creative produces 5x performance variation.
Analytics/Data. Managing measurement infrastructure, attribution modeling, and performance reporting.
CRO Specialists. Optimizing landing pages and conversion funnels through testing and analysis.
Strategy/Planning. Setting budgets, defining targets, and coordinating across channels.
Lead Generation Team Structure
Lead generation businesses require different roles:
Media Buying. Similar to performance marketing, but optimized toward lead submission rather than direct sales.
Compliance. Managing consent documentation, TCPA requirements, and regulatory obligations. This function is critical in lead generation; violations carry catastrophic consequences.
Buyer Management. Maintaining relationships with lead buyers, negotiating terms, managing returns, and developing new buyer partnerships.
Distribution Operations. Managing lead routing, delivery integrations, and platform operations.
Quality Assurance. Monitoring lead quality by source, managing validation, and identifying fraud.
Finance/AR. Managing the complex cash flows of lead brokerage including float, collections, and source payments.
Skills Overlap and Gaps
Marketers transitioning between performance marketing and lead generation find some skills transfer perfectly:
- Media buying and optimization
- Creative testing
- Analytics and measurement
- Conversion rate optimization
Other skills require development:
- Compliance expertise (specific to lead generation)
- Buyer relationship management
- Distribution operations
- Working capital management
- Lead-level P&L analysis
Frequently Asked Questions
What is the main difference between performance marketing and lead generation?
Performance marketing is a broad discipline where payment ties to measurable actions like clicks, leads, or sales. Lead generation is specifically focused on capturing potential customer information and, in many cases, operates as a standalone business model where leads are the product being sold. Performance marketing encompasses many tactics including lead generation, while lead generation can be both a performance marketing tactic and an independent industry.
Can a company do both performance marketing and lead generation?
Yes, and most sophisticated marketing operations do exactly this. A company might run performance marketing campaigns optimized toward direct sales while simultaneously generating leads for phone follow-up. Some companies also sell leads to third parties as a revenue stream alongside their core business. The hybrid approach provides diversification and optimizes for different customer journey preferences.
How do I calculate ROI for performance marketing versus lead generation?
Performance marketing ROI typically uses ROAS (Return on Ad Spend): revenue divided by ad spend. Lead generation ROI requires tracking through to actual cash collection: leads sold minus returns minus all costs (compliance, validation, platform fees, labor, float) divided by total investment. True lead generation ROI often cannot be calculated until 60-90 days after lead capture due to return windows and payment timing.
What metrics matter most for lead generation businesses?
The most critical metrics are EPL (Earnings Per Lead), which measures actual collected revenue after returns and costs; return rate, which indicates buyer acceptance; and source-level profitability, which reveals which traffic sources generate margin versus destroy it. Dashboard CPL is useful but misleading. It typically understates true costs by 30-60%.
Is lead generation a form of performance marketing?
Lead generation can be a performance marketing tactic when used to acquire customers for your own business. When you pay for leads on a cost-per-lead basis, you are engaging in performance marketing. However, lead generation also exists as an independent industry where leads themselves are the product. In this context, lead generation is a business model, not just a marketing tactic.
How do compliance requirements differ between performance marketing and lead generation?
Lead generation faces significantly higher compliance requirements. The Telephone Consumer Protection Act (TCPA) governs how leads can be contacted, requiring Prior Express Written Consent for marketing calls and texts. Violations carry $500-$1,500 per call, with class action settlements averaging $6.6 million. Performance marketing for direct sales faces fewer regulatory constraints, though data privacy regulations apply universally.
Which has higher margins, performance marketing or lead generation?
Neither inherently has higher margins. Performance marketing margin depends on the underlying business model: e-commerce, SaaS, and services have their own margin profiles. Lead generation gross margins typically range from 25-40%, but net margins after returns, float, compliance, and operations often compress to 12-18%. Both can be highly profitable or unprofitable depending on execution.
How does the attribution challenge differ between the two approaches?
Attribution challenges are similar for both disciplines: multi-touch journeys, cross-device fragmentation, and privacy restrictions complicate measurement equally. The key difference is that lead generation requires attribution to extend further downstream. A lead that converts to a form submission but later gets returned represents different value than one that sells and stays sold. Lead generation attribution must connect marketing touchpoints not just to lead creation but to revenue collection.
Should I build an in-house team or use agencies for performance marketing?
The answer depends on scale and expertise. At lower spend levels (under $50,000 monthly), agencies often provide better expertise than a single in-house hire could offer. At higher spend levels, in-house teams provide better alignment, faster optimization, and lower total cost. Many companies use hybrid models: in-house strategy and management with specialized agency support for execution.
What technology stack do I need for lead generation specifically?
Lead generation requires specialized technology beyond standard marketing tools: a lead distribution platform (boberdoo, LeadsPedia, or Phonexa starting at $450-$1,000+ monthly), validation services for phone and email verification ($0.05-$0.25 per lead), consent documentation through TrustedForm or Jornaya ($0.15-$0.50 per lead), and CRM integrations for buyer delivery. Budget $500-$2,500 monthly for platform costs plus per-lead fees across validation and compliance.
Key Takeaways
-
Performance marketing is a discipline where payment ties to measurable actions. It encompasses multiple channels and tactics, with lead generation being one of many approaches under this umbrella.
-
Lead generation can function as both a performance marketing tactic (generating leads for internal sales) and a standalone business model (creating leads as tradeable assets sold to third parties).
-
The core distinction: performance marketing optimizes toward conversions as defined by the advertiser. Lead generation, as a business, optimizes toward revenue collection after leads sell to buyers, get contacted, and avoid returns.
-
Shared foundations include channels (paid search, paid social, native), optimization principles (CRO, creative testing, audience refinement), and measurement challenges (attribution complexity, privacy restrictions).
-
Risk profiles differ significantly. Performance marketing risk concentrates in media efficiency. Lead generation adds working capital risk (the 60-day float), return risk (8-15% average), and compliance risk (TCPA violations average $6.6 million in settlements).
-
True cost per lead exceeds dashboard CPL by 30-60% when accounting for returns, compliance, validation, platform fees, and labor. Decisions based on dashboard metrics systematically overstate profitability.
-
Most sophisticated operations blend both approaches: internal lead generation for margin and control, external lead purchasing for scale, and direct performance marketing where products support immediate conversion.
-
Team structure differs: lead generation requires specialized compliance, buyer management, and distribution operations roles that performance marketing teams typically do not need.
-
Success metrics must match the model. Performance marketers track ROAS and CPA. Lead generators track EPL, return rates, and source-level profitability after cash collection.
This guide reflects industry practices and data current as of late 2024 and early 2025. Digital marketing and lead generation landscapes evolve continuously. Validate specific metrics and regulatory requirements before making significant investment decisions.