The metric Google uses to determine whether you pay premium rates or steal traffic from competitors. Master Quality Score and watch your cost per lead drop 30-40% while maintaining volume.
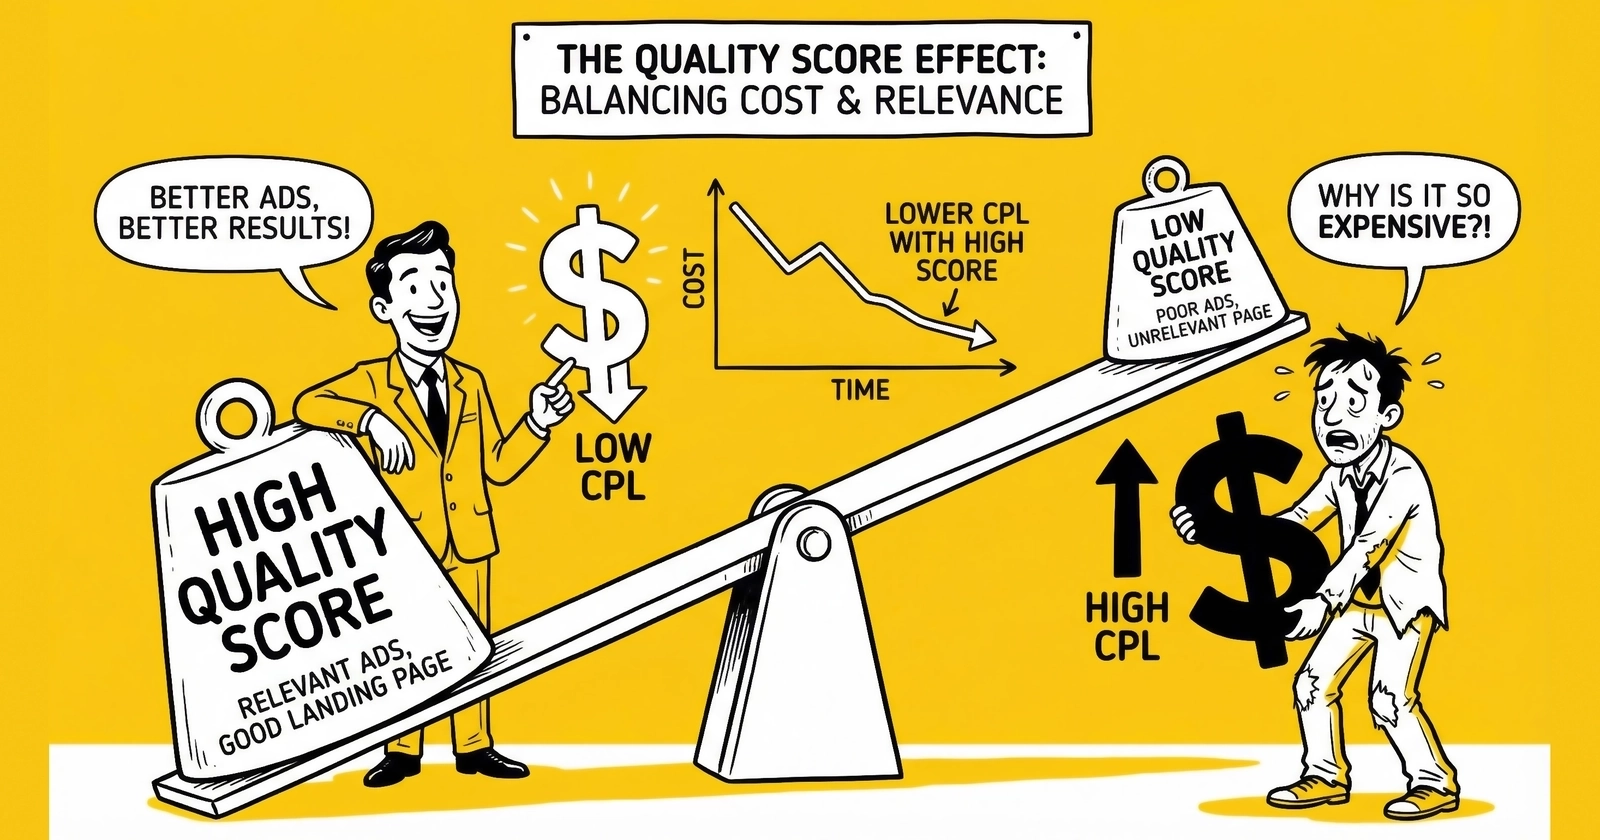
Your competitor pays $3.50 per click for the same keyword that costs you $6.25. Same auction, same keyword, same ad position. The difference is not bidding strategy. The difference is Quality Score.
Quality Score is Google’s 1-10 rating of your ad relevance, expected click-through rate, and landing page experience. This single metric determines whether you operate with a built-in cost advantage or fight uphill against every competitor in your auction. A Quality Score of 8 pays roughly 37% less per click than a Quality Score of 5 for the same position. In lead generation, where traffic costs directly determine profitability, that spread represents the difference between sustainable margins and slow bankruptcy.
This guide explains exactly how Quality Score works, why it matters for lead generation specifically, and the optimization strategies that move the needle. The data comes from platform research, operator experience, and documented campaign results. Where I cite specific numbers, they reflect current 2024-2025 benchmarks that you can verify against your own campaigns.
What Is Quality Score and Why Does It Matter?
Quality Score is Google’s estimate of how relevant and useful your ad and landing page are to someone searching for your targeted keyword. Google assigns a score from 1 to 10 for each keyword in your account, with 10 being the highest possible rating.
The metric matters for one simple reason: it directly affects how much you pay per click.
Google Ads does not operate as a pure auction where the highest bidder wins. Instead, Google uses a formula called Ad Rank to determine both your ad position and your actual cost per click. The formula combines your maximum bid with your Quality Score:
Ad Rank = Maximum Bid x Quality Score
This means a competitor with a lower bid but higher Quality Score can outrank you while paying less. Consider two advertisers competing for the same keyword:
| Advertiser | Max Bid | Quality Score | Ad Rank | Position |
|---|---|---|---|---|
| Advertiser A | $5.00 | 8 | 40 | 1st |
| Advertiser B | $7.00 | 5 | 35 | 2nd |
Advertiser A wins the top position despite bidding $2.00 less per click. They achieve better visibility at lower cost because their Quality Score multiplies their bid’s effectiveness.
The impact on actual cost per click is even more dramatic. Google calculates what you actually pay using this formula:
Actual CPC = (Ad Rank of competitor below you / Your Quality Score) + $0.01
This creates a compounding effect where high Quality Score advertisers pay progressively less while maintaining strong positions.
Quality Score Impact on Cost Per Click
The relationship between Quality Score and cost is not linear. Each point of Quality Score translates to meaningful CPC reduction or increase:
| Quality Score | CPC Adjustment vs. Baseline | Effective CPC at $5 Base |
|---|---|---|
| 10 | -30% | $3.50 |
| 9 | -25% | $3.75 |
| 8 | -20% | $4.00 |
| 7 | -10% | $4.50 |
| 6 | Baseline (0%) | $5.00 |
| 5 | +10% | $5.50 |
| 4 | +25% | $6.25 |
| 3 | +67% | $8.35 |
| 2 | +150% | $12.50 |
| 1 | +400% | $25.00 |
The asymmetry is intentional. Google penalizes low Quality Score advertisers severely to discourage irrelevant ads that degrade user experience. The spread between Quality Score 8 and Quality Score 5 represents a 37% cost difference. At scale, this compounds into hundreds of thousands of dollars annually.
Why Quality Score Matters Specifically for Lead Generation
Lead generation operates on tighter margins than e-commerce or brand advertising. When you sell leads for $50-100 and pay $4-15 per click, your cost per lead economics depend entirely on traffic acquisition efficiency.
Consider the math for an insurance lead campaign:
With Quality Score 8:
- CPC: $4.00
- Conversion Rate: 7%
- Cost Per Lead: $57.14
With Quality Score 5:
- CPC: $5.50
- Conversion Rate: 7% (same landing page)
- Cost Per Lead: $78.57
The Quality Score difference alone adds $21.43 per lead. If you sell leads for $75, the high Quality Score campaign generates $17.86 profit per lead while the low Quality Score campaign loses $3.57 per lead.
This is why successful lead generators treat Quality Score as a core operational metric rather than a secondary diagnostic.
The Three Components of Quality Score
Google calculates Quality Score from three factors, each rated as “Above Average,” “Average,” or “Below Average” in your account:
- Expected Click-Through Rate (Expected CTR)
- Ad Relevance
- Landing Page Experience
Understanding each component reveals where optimization efforts generate the highest return.
Expected Click-Through Rate (Expected CTR)
Expected CTR measures how likely your ad is to be clicked when shown for a particular keyword. Google compares your historical click-through rate to other advertisers competing for the same keywords, adjusting for factors like ad position and extensions.
Why it matters: A higher expected CTR signals to Google that your ad satisfies user intent. Ads that get clicked are ads that answer what searchers are looking for.
Factors that influence Expected CTR:
- Ad copy relevance: Headlines containing the exact keyword tend to perform better
- Clear value proposition: Specific claims outperform generic messaging
- Call-to-action clarity: Users need to understand what happens when they click
- Ad extensions: Sitelinks, callouts, and structured snippets increase click surface area
- Historical account performance: Accounts with strong CTR history receive benefit of the doubt
What drives Expected CTR ratings:
| Rating | Typical CTR Range | Characteristics |
|---|---|---|
| Above Average | 6%+ for search | Compelling copy, strong relevance, effective extensions |
| Average | 3-6% for search | Acceptable relevance, room for improvement |
| Below Average | Under 3% | Weak headlines, poor relevance, missing extensions |
Improvement strategies:
Test multiple headline variations continuously. Responsive Search Ads allow up to 15 headlines; use all available slots with meaningfully different approaches. Headlines that directly incorporate keywords, include numbers, and promise specific benefits consistently outperform generic copy.
Example headline progression:
| Version | Headline | Expected Performance |
|---|---|---|
| Weak | ”Get a Quote Today” | Below Average |
| Average | ”Compare Insurance Quotes” | Average |
| Strong | ”Compare 5+ Auto Insurance Quotes in 2 Minutes” | Above Average |
The strong version includes specificity (5+ quotes, 2 minutes), action clarity (compare), and direct relevance to insurance searchers.
Ad Relevance
Ad Relevance measures how closely your ad matches the intent behind a user’s search. Google evaluates whether your ad copy addresses what the searcher is actually looking for.
Why it matters: Irrelevant ads waste advertiser money and frustrate users. Google prioritizes ads that align with search intent.
Factors that influence Ad Relevance:
- Keyword-ad copy alignment: Does your ad directly address the keyword?
- Search intent match: Does your ad satisfy the underlying user goal?
- Ad group structure: Are keywords tightly themed so one ad can serve all?
- Dynamic Keyword Insertion: Used appropriately, this improves relevance
What drives Ad Relevance ratings:
| Rating | Characteristics |
|---|---|
| Above Average | Primary keyword appears in headlines; ad directly addresses search intent |
| Average | Keyword theme present but not specific; acceptable alignment |
| Below Average | Ad copy does not reflect keyword intent; mismatch between search and message |
Improvement strategies:
The most reliable way to improve Ad Relevance is tightening ad group structure. Large ad groups with 50+ keywords make relevant ad copy impossible. No single ad can speak to “auto insurance quotes,” “car insurance near me,” and “cheap vehicle coverage” with equal relevance.
Modern best practice uses tightly themed ad groups of 5-15 closely related keywords. This allows responsive search ads to test headlines while maintaining relevance across the group.
| Ad Group Structure | Keywords | Ad Relevance Impact |
|---|---|---|
| Too Broad | 50+ diverse keywords | Below Average expected |
| Theme Cluster | 10-15 related terms | Average to Above Average |
| Single Keyword | 1 exact match | Above Average (but limited scale) |
Include your primary keyword in at least one headline. Use the keyword in the description where natural. Ensure the display URL reflects the keyword theme.
Landing Page Experience
Landing Page Experience evaluates how useful and relevant your landing page is to someone who clicks your ad. Google considers content relevance, page speed, mobile optimization, and overall user experience.
Why it matters: Google wants users to find what they are looking for after clicking. Landing pages that frustrate or mislead users generate complaints and reduce platform trust.
Factors that influence Landing Page Experience:
- Content relevance: Does the page address the keyword’s intent?
- Load speed: Under 3 seconds is table stakes; sub-2 seconds is competitive
- Mobile experience: Over 60% of search traffic is mobile; responsive design is mandatory
- Navigation clarity: Can users easily find what they need and take action?
- Trust signals: Secure connection (HTTPS), privacy policy, testimonials
- Original, useful content: Substantive information beyond just a lead form
What drives Landing Page Experience ratings:
| Rating | Characteristics |
|---|---|
| Above Average | Fast load, mobile-optimized, content matches search, clear value |
| Average | Acceptable speed, some relevance, functional experience |
| Below Average | Slow load, poor mobile, content mismatch, thin or misleading content |
Improvement strategies:
Create dedicated landing pages for each major keyword theme. A generic website homepage handling all insurance queries will score lower than dedicated pages for auto, home, and life insurance. Multi-step forms can further improve both conversion rates and landing page experience scores.
The page headline should echo the ad promise. If your ad says “Get Auto Insurance Quotes in 60 Seconds,” the landing page headline should reinforce that specific value proposition. Message mismatch tanks both conversion rates and Quality Score.
Speed optimization delivers compound returns. Each additional second of load time reduces conversions by approximately 7% while also degrading Landing Page Experience rating. Target sub-3-second loads; sub-2-second is competitive advantage. Server-side tracking implementations can help maintain page speed while preserving attribution accuracy.
How Quality Score Impacts CPL: The Real Math
Quality Score affects cost per lead through two mechanisms: direct CPC reduction and indirect conversion rate improvements.
Direct CPC Impact
The most obvious effect is paying less per click. At constant conversion rates, lower CPC directly reduces CPL:
CPL = CPC / Conversion Rate
If your CPC drops from $5.50 to $4.00 (Quality Score improvement from 5 to 8) and conversion rate stays at 7%, your CPL drops from $78.57 to $57.14. That is a 27% reduction in lead acquisition cost from Quality Score improvement alone.
Indirect Conversion Rate Impact
Quality Score optimization often improves conversion rates as a side effect. The same factors that Google rewards, such as relevant landing pages, fast load times, and clear value propositions, also improve user experience and conversion likelihood.
A landing page optimized for Quality Score with fast load, mobile-first design, and matched messaging typically converts 15-30% better than an unoptimized page. This compounds with CPC reductions:
| Scenario | CPC | CVR | CPL |
|---|---|---|---|
| Unoptimized (QS 5) | $5.50 | 5% | $110.00 |
| Optimized (QS 8) | $4.00 | 7% | $57.14 |
| Improvement | -27% | +40% | -48% |
The combined effect cuts CPL nearly in half. This is not theoretical. Practitioners who systematically optimize Quality Score routinely achieve 30-50% CPL reductions.
Quality Score by Vertical: Benchmarks
Different lead generation verticals see different baseline Quality Scores due to varying competitive intensity and advertiser sophistication:
| Vertical | Typical QS Range | High Performers | Notes |
|---|---|---|---|
| Auto Insurance | 5-7 | 8-10 | Highly competitive; creative differentiation critical |
| Medicare | 6-8 | 8-10 | Regulated copy limits options |
| Mortgage | 5-7 | 8-10 | Rate messaging creates differentiation |
| Solar | 5-7 | 7-9 | Geographic targeting affects relevance |
| Legal (PI) | 4-6 | 7-9 | Highest CPCs magnify QS impact |
| Home Services | 6-8 | 8-10 | Local relevance easier to achieve |
High performers consistently achieve Quality Scores of 7+ across their keyword portfolios. The operators running at Quality Score 4-5 pay 25-50% more per click than competitors in the same auctions.
Deep-Dive: Vertical-Specific Quality Score Benchmarks and Optimization
Each lead generation vertical presents unique Quality Score challenges based on regulatory constraints, competitive dynamics, and consumer behavior patterns. Understanding these vertical-specific factors helps practitioners set realistic targets and prioritize optimization efforts appropriately.
Auto Insurance: The Most Competitive Battleground
Auto insurance represents the highest-volume lead generation vertical in Google Ads, with national carriers, regional insurers, and independent agencies all competing for the same high-intent traffic. This competitive intensity creates distinct Quality Score dynamics.
Typical Quality Score distribution in auto insurance:
- Top 10% of advertisers: Quality Score 8-10
- Middle 60% of advertisers: Quality Score 5-7
- Bottom 30% of advertisers: Quality Score 3-5
The primary Quality Score differentiator in auto insurance is Expected CTR. With dozens of advertisers competing for identical keywords, ad copy quality determines click share. Generic messaging like “Get a Quote” scores poorly because consumers see identical headlines from multiple competitors. Advertisers achieving Quality Score 8+ typically employ specific value propositions: “Compare 5+ Quotes in 2 Minutes” or “Drivers Who Switch Save $600/Year on Average.”
Landing Page Experience shows less variation in auto insurance because most sophisticated advertisers have already optimized load times and mobile experience. The differentiation comes from content depth. Pages that explain coverage types, provide rate factor education, and offer comparison tools score higher than simple form-only pages.
Benchmark targets for auto insurance:
- New campaigns: Target Quality Score 6 within 30 days
- Optimization goal: Quality Score 7+ on core keywords within 90 days
- Top performer benchmark: Quality Score 8+ on 80% of keyword portfolio
Medicare: Regulatory Constraints Shape Possibilities
Medicare advertising operates under CMS (Centers for Medicare and Medicaid Services) marketing guidelines that restrict claims, language, and presentation. These regulatory constraints limit creative flexibility and create a narrower band of achievable Quality Scores.
Typical Quality Score distribution in Medicare:
- Top 20% of advertisers: Quality Score 7-9
- Middle 50% of advertisers: Quality Score 6-7
- Bottom 30% of advertisers: Quality Score 4-6
Ad Relevance presents the greatest challenge in Medicare due to regulatory restrictions on claims. Advertisers cannot make comparative statements, guarantee savings, or use urgency language that might mislead beneficiaries. This limits headline options and forces advertisers toward similar compliant messaging.
Landing Page Experience becomes the primary differentiator. Medicare seekers are typically older adults who may be less familiar with online forms. Pages that provide clear explanations, use larger fonts, offer phone-based alternatives, and include educational content about Medicare options score significantly higher than minimal form pages.
Benchmark targets for Medicare:
- AEP campaigns: Target Quality Score 6+ immediately (competition intensifies during enrollment)
- Year-round campaigns: Target Quality Score 7+ within 60 days
- Top performer benchmark: Quality Score 8+ achievable but requires exceptional landing page experience
Mortgage: Rate Sensitivity Drives Dynamics
Mortgage lead generation Quality Scores fluctuate with interest rate environments. During low-rate periods with high refinance volume, competition intensifies and Quality Scores compress. During high-rate periods with limited activity, Quality Scores rise as weaker competitors exit.
Typical Quality Score distribution in mortgage (current high-rate environment):
- Top 15% of advertisers: Quality Score 8-10
- Middle 55% of advertisers: Quality Score 5-7
- Bottom 30% of advertisers: Quality Score 3-5
Expected CTR varies dramatically based on rate messaging. Advertisers who can legitimately claim competitive rates in headlines (“Rates from 6.25% Today”) achieve significantly higher CTR than those using generic messaging. This creates a circular advantage: lenders with better rates achieve better Quality Scores, which reduces their CPCs, which allows more aggressive bidding.
Ad Relevance improves substantially with tight keyword-to-ad-group mapping. Mortgage searches span purchase, refinance, HELOC, jumbo, and FHA categories with entirely different intents. Advertisers using single ad groups for all mortgage terms cannot achieve Ad Relevance scores above Average.
Benchmark targets for mortgage:
- Purchase mortgage: Target Quality Score 7+ (less competitive than refinance historically)
- Refinance mortgage: Target Quality Score 6+ during active markets, 7+ during slow markets
- HELOC/Home Equity: Target Quality Score 7+ (currently strong demand with limited competition)
Solar: Geographic Variation Creates Complexity
Solar lead generation Quality Scores vary significantly by geography because of different state policies, utility rates, and installer competition levels. A Quality Score optimization strategy that works in California may fail in Texas.
Typical Quality Score distribution in solar:
- Top 20% of advertisers: Quality Score 7-9
- Middle 50% of advertisers: Quality Score 5-7
- Bottom 30% of advertisers: Quality Score 4-6
Landing Page Experience shows the widest variation in solar because consumer education needs differ substantially. Markets with mature solar penetration (California, Massachusetts) have sophisticated consumers who expect detailed savings calculations, financing comparisons, and installer reviews. Emerging markets (Texas, Florida) have consumers who need basic solar education before they are ready to submit lead forms.
Geographic targeting affects Ad Relevance significantly. Keywords like “solar panels” without geographic modification attract national traffic that cannot convert for local installers. Tightly geo-targeted campaigns with location-specific ad copy achieve meaningfully higher Ad Relevance scores.
Benchmark targets for solar:
- High-competition states (CA, MA, NY): Target Quality Score 6+ (extremely competitive)
- Growth states (TX, FL, AZ): Target Quality Score 7+ (less competition, better positioning possible)
- Emerging markets: Target Quality Score 8+ (limited competition allows strong positioning)
Legal (Personal Injury): Highest Stakes Magnify Quality Score Impact
Personal injury legal represents the highest CPC environment in lead generation, with clicks costing $50-200+ for competitive terms. At these price points, Quality Score differences translate to massive budget implications.
Typical Quality Score distribution in personal injury legal:
- Top 10% of advertisers: Quality Score 7-9
- Middle 50% of advertisers: Quality Score 5-7
- Bottom 40% of advertisers: Quality Score 3-5
The bottom-heavy distribution reflects a common pattern: many law firms run Google Ads without sophisticated optimization, accepting poor Quality Scores because their case values justify almost any acquisition cost. This creates opportunity for optimized competitors to capture premium positions at relatively lower CPCs.
Expected CTR separates high performers because legal advertising requires balancing professionalism with compelling messaging. Ads that communicate urgency (“Free Case Review Today”) without appearing ambulance-chasing achieve the best click rates. Trust signals in ads (years of experience, case results, recognizable firm names) significantly improve CTR for established firms.
Benchmark targets for personal injury legal:
- General PI keywords: Target Quality Score 6+ (highly competitive)
- Specific case types (car accident, slip and fall): Target Quality Score 7+ (less competition per category)
- Geographic/local PI: Target Quality Score 8+ (local relevance advantages)
Home Services: Local Relevance Creates Advantage
Home services (HVAC, plumbing, roofing, electrical) represent a more accessible Quality Score environment because of inherent local targeting. Searches are geographically bounded, and local businesses can achieve strong Ad Relevance through location-specific messaging.
Typical Quality Score distribution in home services:
- Top 25% of advertisers: Quality Score 8-10
- Middle 50% of advertisers: Quality Score 6-8
- Bottom 25% of advertisers: Quality Score 4-6
Ad Relevance is typically the strongest component for home services because searches are naturally aligned with service offerings. Someone searching “AC repair near me” receives an ad for “AC Repair in [City] - Same Day Service Available.” The alignment is direct.
Landing Page Experience separates winners from also-rans in home services. Consumers expect to see licensing information, service area maps, reviews, and clear pricing guidance. Pages that provide this information comprehensively score significantly higher than minimal contact forms.
Benchmark targets for home services:
- Core service keywords: Target Quality Score 7+ within 60 days
- Emergency services: Target Quality Score 8+ (high intent, clear relevance)
- Geographic variations: Target Quality Score 8+ (local matching advantages)
Diagnosing Your Quality Score Problems
Before optimizing, you need accurate diagnosis. Quality Score issues cluster into predictable patterns.
Finding Your Quality Score Data
In Google Ads, Quality Score appears at the keyword level. Navigate to Keywords, then modify columns to include:
- Quality Score
- Quality Score (historic)
- Expected CTR
- Ad Relevance
- Landing Page Experience
Filter for keywords with Quality Score below 6 and sufficient impression volume to matter. A keyword generating 10 impressions monthly does not warrant optimization effort.
Common Problem Patterns
Pattern 1: Low Expected CTR Across the Account
Symptoms: Expected CTR shows “Below Average” for most keywords regardless of theme.
Root cause: Typically indicates weak ad copy or missing extensions across campaigns.
Solution: Implement comprehensive ad copy testing. Add all available extensions. Test headlines with specific numbers, clear benefits, and strong calls-to-action.
Pattern 2: Low Ad Relevance in Specific Ad Groups
Symptoms: Ad Relevance shows “Below Average” for certain keyword clusters while others perform well.
Root cause: Ad group structure is too broad. Keywords within the group have different intents that one ad cannot satisfy.
Solution: Split ad groups by intent clusters. Create 3-5 tightly themed ad groups from one broad ad group.
Pattern 3: Universal Landing Page Experience Problems
Symptoms: Landing Page Experience shows “Below Average” or “Average” across most campaigns.
Root cause: Site speed issues, mobile problems, or thin content affecting all traffic.
Solution: Run PageSpeed Insights analysis. Address Core Web Vitals issues. Ensure mobile responsiveness. Add substantive content beyond the lead form.
Pattern 4: Keyword-Specific Quality Score Issues
Symptoms: Some keywords have Quality Score 8+ while similar keywords score 4-5.
Root cause: Historical performance differences. Low-volume keywords may lack data. Some keywords may have landed on less relevant pages historically.
Solution: Pause consistently underperforming keywords. Create dedicated landing pages for important low-score keywords. Rebuild keyword history with improved targeting.
The Quality Score Audit Process
A systematic audit identifies your highest-impact improvement opportunities:
-
Export keyword data including Quality Score, Expected CTR, Ad Relevance, Landing Page Experience, impressions, clicks, conversions, and cost.
-
Calculate opportunity size: For each below-average keyword, estimate the CPC reduction if Quality Score improved by 2 points. Multiply by monthly clicks to find dollar impact.
-
Prioritize by impact: A keyword with 1,000 monthly clicks and potential $1.50 CPC savings represents $1,500 monthly opportunity. A keyword with 50 clicks and $0.50 savings represents $25 monthly. Focus on high-impact keywords first.
-
Categorize by component: Group problem keywords by which component (Expected CTR, Ad Relevance, Landing Page Experience) shows Below Average. This guides solution approach.
-
Create action plan: Map specific interventions to each keyword cluster. Set timeline and accountability.
Quality Score Optimization Strategies That Work
With diagnosis complete, apply proven optimization approaches for each Quality Score component.
Optimizing Expected Click-Through Rate
Strategy 1: Headline Testing at Scale
Responsive Search Ads allow up to 15 headlines. Most advertisers use 3-5. Use all available slots with meaningfully different approaches:
- Include exact keyword in multiple headlines
- Test benefit-focused vs. feature-focused messaging
- Try questions, statements, and commands
- Include numbers and specifics
- Test urgency versus value messaging
Run tests for 2-4 weeks before evaluating winners. Statistical significance requires adequate data.
Strategy 2: Extension Implementation
Ad extensions increase click surface area and provide additional reasons to click. Required extensions for lead generation:
| Extension Type | Lead Gen Application | Impact |
|---|---|---|
| Sitelinks | Link to specific product pages, FAQ, contact | +10-15% CTR |
| Callouts | Highlight benefits: “Free Quotes,” “No Obligation” | +5-10% CTR |
| Structured Snippets | List coverage types, services, features | +5-8% CTR |
| Call Extensions | Enable click-to-call on mobile | +8-12% for high-intent |
| Location Extensions | For local/regional lead gen | +5-10% local CTR |
Full extension implementation typically lifts CTR by 10-20% in aggregate.
Strategy 3: Dynamic Keyword Insertion
Dynamic Keyword Insertion (DKI) automatically includes the user’s search term in your ad. Used appropriately, this improves relevance:
Headline: “{KeyWord:Compare Insurance Quotes}”
If someone searches “auto insurance quotes,” they see “Auto Insurance Quotes” as the headline. This creates relevance at scale without creating thousands of ad variations.
Caution: DKI can insert awkward or truncated terms. Use fallback text and review search terms regularly.
Optimizing Ad Relevance
Strategy 1: Tighten Ad Group Structure
The single highest-impact Ad Relevance improvement is restructuring ad groups. Move from broad groups with 30-50 keywords to tight clusters of 5-15 related terms.
Before restructuring:
| Ad Group | Keywords | Issue |
|---|---|---|
| Insurance Quotes | auto insurance quotes, home insurance comparison, life insurance rates, cheap car coverage, home protection plans | No ad can be relevant to all terms |
After restructuring:
| Ad Group | Keywords | Benefit |
|---|---|---|
| Auto Insurance Quotes | auto insurance quotes, car insurance quotes, vehicle insurance quotes online, compare auto insurance | All terms match “Get Auto Insurance Quotes” headline |
| Home Insurance Quotes | home insurance quotes, homeowners insurance comparison, home protection quotes | All terms match “Compare Home Insurance” headline |
Strategy 2: Keyword-Headline Mapping
Ensure at least one headline in each ad group contains the primary keyword theme. Use pinning strategically to guarantee keyword presence:
- Pin exact-keyword headline to Position 1
- Allow other headlines to rotate
- Monitor performance; unpin if CTR drops
Strategy 3: Search Term Review
Regular search term review reveals irrelevant queries triggering your ads. Add negative keywords to eliminate mismatches that harm Ad Relevance:
- Informational queries (how to, what is, can you)
- Job-related queries (careers, salary, hiring)
- DIY queries (free, template, do it yourself)
- Competitor brand queries (unless intentionally targeting)
Weekly search term review prevents gradual Ad Relevance degradation.
Optimizing Landing Page Experience
Strategy 1: Speed Optimization
Page speed directly affects Landing Page Experience. Target these Core Web Vitals thresholds:
| Metric | Target | Impact |
|---|---|---|
| Largest Contentful Paint (LCP) | Under 2.5 seconds | Measures perceived load time |
| First Input Delay (FID) | Under 100 milliseconds | Measures interactivity |
| Cumulative Layout Shift (CLS) | Under 0.1 | Measures visual stability |
Common speed improvements:
- Compress and lazy-load images
- Minimize JavaScript execution
- Use content delivery networks (CDNs)
- Implement browser caching
- Remove unnecessary plugins and scripts
Strategy 2: Create Keyword-Specific Landing Pages
Generic pages underperform dedicated pages by 2-3x. Create specific pages for each major keyword theme:
| Keyword Theme | Landing Page | Headline |
|---|---|---|
| Auto insurance quotes | /auto-insurance-quotes/ | Get Auto Insurance Quotes in 60 Seconds |
| Home insurance comparison | /compare-home-insurance/ | Compare Home Insurance Rates from 5+ Carriers |
| Medicare plans | /medicare-plans/ | Find the Right Medicare Plan for You |
The page headline, hero content, and form should all align with the specific keyword intent.
Strategy 3: Message Match
The landing page must deliver what the ad promised. Audit your highest-spend keywords and verify:
- Page headline echoes ad headline
- Value proposition matches ad claims
- Form fields align with ad offer
- No jarring disconnect between ad promise and page experience
Message mismatch tanks conversion rates (users feel misled) and degrades Landing Page Experience (Google detects the inconsistency through user behavior signals).
Strategy 4: Mobile-First Design
Over 60% of search traffic comes from mobile. Your landing page must be optimized for mobile users:
- Touch-friendly form fields (48px minimum tap targets)
- No horizontal scrolling
- Click-to-call prominently placed
- Auto-fill enabled for common fields
- Fast load on mobile connections
Test on actual devices, not just browser simulation. Mobile experience issues are the most common source of Landing Page Experience problems.
Strategy 5: Trust and Content Signals
Google evaluates whether your landing page provides useful, trustworthy content:
- HTTPS is mandatory (no secure connection = penalty)
- Privacy policy and terms must be accessible
- Testimonials and social proof increase trust signals
- Substantive content beyond just a lead form
- Clear business identity and contact information
A page with only a lead form and no explanatory content signals low value. Add FAQ sections, benefit explanations, or comparison information that genuinely helps users.
Quality Score and Automated Bidding
Google’s automated bidding strategies (Target CPA, Target ROAS, Maximize Conversions) adjust bids dynamically based on conversion likelihood. Quality Score interacts with these systems in important ways.
How Quality Score Affects Smart Bidding
Smart Bidding optimizes for conversions, not clicks. But Quality Score still matters because it affects auction eligibility and cost efficiency.
A campaign with high Quality Score enters more auctions at competitive positions. Smart Bidding then optimizes within those auctions based on conversion probability. Low Quality Score campaigns enter fewer auctions or enter at poor positions, limiting Smart Bidding’s optimization options.
Practical implication: Do not assume Smart Bidding eliminates Quality Score importance. Campaigns with higher Quality Score give Smart Bidding more opportunities to find efficient conversions.
Quality Score Impact by Bidding Strategy
| Bidding Strategy | Quality Score Impact |
|---|---|
| Manual CPC | Direct CPC and position impact |
| Enhanced CPC | CPC impact plus conversion optimization |
| Maximize Clicks | CPC impact affects volume at budget |
| Maximize Conversions | Affects auction eligibility; indirect conversion impact |
| Target CPA | Affects ability to hit target efficiently |
| Target ROAS | Affects return efficiency at given value targets |
Target CPA bidding with Quality Score 5 may struggle to hit targets that Quality Score 8 campaigns achieve easily. The underlying economics are more favorable with higher Quality Score.
Recommended Approach
Optimize Quality Score before scaling automated bidding. Establish strong Quality Score baselines (7+ across portfolio) then enable Smart Bidding. This gives algorithms more favorable auction economics to work with.
Advanced Quality Score Strategies
Beyond the fundamentals, sophisticated practitioners employ advanced tactics.
Quality Score by Match Type
Different match types show different Quality Score behaviors:
| Match Type | Quality Score Behavior |
|---|---|
| Exact Match | Most accurate QS; based on precise term performance |
| Phrase Match | Aggregates performance across matching queries |
| Broad Match | Most variable; includes many query variations |
Best practice: Use exact match for your most important keywords to get accurate Quality Score readings. Broad match Quality Scores can be misleading because they blend performance across diverse queries.
Quality Score for High-CPL Verticals
In legal, mortgage, and other high-CPL verticals where clicks cost $10-50, Quality Score impact is magnified:
| Vertical | Base CPC | QS 5 CPC | QS 8 CPC | Monthly Savings at 1,000 Clicks |
|---|---|---|---|---|
| Personal Injury | $40 | $44 | $32 | $12,000 |
| Mortgage | $25 | $27.50 | $20 | $7,500 |
| Auto Insurance | $8 | $8.80 | $6.40 | $2,400 |
High-CPL verticals should prioritize Quality Score optimization as a core strategy, not a secondary concern.
Account-Level Quality Score Effects
While Quality Score is calculated at the keyword level, account history influences expectations. Accounts with consistently strong Quality Score across campaigns receive some benefit of the doubt for new keywords.
Practical implication: Maintain Quality Score discipline across all campaigns, not just high-volume keywords. Poor performers in one campaign can influence expectations elsewhere.
Competitor Quality Score Arbitrage
In competitive auctions, if you achieve higher Quality Score than competitors, you can win positions at lower bids. This creates strategic opportunity:
- Identify auction competitors through Auction Insights reports
- Analyze competitor landing pages and ads
- Find Quality Score improvement opportunities they are missing
- Invest in optimization to achieve cost advantage
The advertisers who outwork competitors on Quality Score fundamentals win auctions at lower cost than those competing purely on bid.
Frequently Asked Questions
What is Quality Score in Google Ads?
Quality Score is Google’s 1-10 rating of how relevant and useful your ad and landing page are to someone searching for your keyword. The score is calculated from three components: Expected Click-Through Rate, Ad Relevance, and Landing Page Experience. Higher Quality Scores result in lower cost per click and better ad positions, directly impacting your cost per lead.
How does Quality Score affect my cost per lead?
Quality Score directly affects cost per click through Google’s Ad Rank formula. A Quality Score of 8 typically pays 37% less per click than a Quality Score of 5 for the same ad position. Since CPL equals CPC divided by conversion rate, this reduction flows directly to lower lead acquisition costs. Additionally, the factors that improve Quality Score (fast pages, relevant content, clear messaging) typically improve conversion rates as well, compounding the CPL benefit.
What is a good Quality Score for lead generation?
For lead generation campaigns, target Quality Score of 7 or higher across your keyword portfolio. Scores of 8-10 indicate strong optimization and cost efficiency. Scores of 6 are acceptable but represent improvement opportunity. Scores below 5 indicate significant problems that are actively increasing your costs. High performers in competitive verticals like insurance and mortgage consistently achieve Quality Scores of 8+ on their core keywords.
How can I check my Quality Score in Google Ads?
Navigate to the Keywords tab in your Google Ads account. Modify columns to add Quality Score and its three components: Expected CTR, Ad Relevance, and Landing Page Experience. You can also add Quality Score (historic) to see trends over time. Filter for keywords with Quality Score below 6 and sufficient impression volume to prioritize optimization efforts where they will have the most impact.
Why is my Quality Score low despite good conversion rates?
Quality Score and conversion rate are different metrics that sometimes diverge. Quality Score measures relevance signals that Google can observe before conversion: CTR, keyword-ad alignment, and landing page experience. You might have a landing page that converts well but loads slowly, or an ad that converts but has below-average CTR. Address the specific component (Expected CTR, Ad Relevance, or Landing Page Experience) showing “Below Average” in your account.
Does Quality Score affect automated bidding strategies?
Yes, Quality Score affects automated bidding by determining which auctions your ads can enter and at what positions. Low Quality Score campaigns give Smart Bidding algorithms fewer opportunities to find efficient conversions. High Quality Score campaigns enter more auctions at favorable positions, giving algorithms more options to optimize. Establish strong Quality Score baselines before scaling automated bidding for best results.
How long does it take to improve Quality Score?
Quality Score updates in near real-time as Google collects new performance data. However, meaningful improvement typically takes 2-4 weeks of sustained better performance. Landing page changes may show faster impact (days) while CTR improvements require accumulating click data (weeks). Avoid making multiple changes simultaneously; this makes it impossible to identify what worked.
Can Quality Score go down after optimization?
Yes, Quality Score can decline if changes backfire. New ad copy that reduces CTR will hurt Expected CTR scores. Landing page changes that increase load time will hurt Landing Page Experience. Always A/B test significant changes before full rollout. Monitor Quality Score weekly to catch declines early.
What is the difference between Quality Score and Ad Rank?
Quality Score is the 1-10 relevance rating for each keyword. Ad Rank determines your actual ad position and cost in each auction. Ad Rank combines your maximum bid with your Quality Score (and other factors like expected extension impact). High Quality Score increases your Ad Rank at any given bid level, allowing you to achieve better positions at lower cost.
Should I pause keywords with low Quality Score?
It depends on the keyword’s strategic importance and improvement potential. For non-critical keywords with Quality Score below 4 and limited optimization opportunity, pausing often makes sense. The poor Quality Score is actively increasing costs. For strategically important keywords, invest in targeted optimization: tighter ad groups, dedicated landing pages, improved ad copy. Set a timeline for improvement; if Quality Score does not improve within 4-6 weeks of optimization effort, consider pausing.
Key Takeaways
-
Quality Score is the hidden multiplier in every Google Ads auction. A Quality Score of 8 pays roughly 37% less per click than Quality Score 5 for the same position. This compounds to 30-50% CPL reductions at constant conversion rates.
-
Three components determine Quality Score: Expected CTR, Ad Relevance, and Landing Page Experience. Diagnose which component is dragging down specific keywords before optimizing. Each component requires different interventions.
-
Ad group structure is the highest-leverage Ad Relevance improvement. Move from broad ad groups with 30-50 keywords to tight clusters of 5-15 related terms. No single ad can be relevant to diverse intents.
-
Landing page speed is foundational. Target sub-3-second load times; sub-2-second is competitive advantage. Every additional second costs approximately 7% conversions and degrades Landing Page Experience rating.
-
Create dedicated landing pages for each major keyword theme. Generic website pages underperform dedicated pages by 2-3x. The page headline must echo the ad promise.
-
Quality Score matters more in high-CPL verticals. Legal keywords at $40 CPC see $12,000 monthly savings from Quality Score improvement at 1,000 clicks. Insurance and mortgage show proportional impact.
-
Server-side tracking and first-party data preserve Quality Score accuracy. As browser-based tracking degrades, accurate conversion data becomes critical for automated bidding systems that affect Quality Score indirectly through auction participation. The shift toward first-party data collection becomes increasingly important for maintaining optimization accuracy.
-
Treat Quality Score optimization as an ongoing discipline, not a one-time project. Weekly monitoring, continuous ad testing, and regular landing page audits maintain competitive advantage as competitors and market conditions evolve.
Quality Score benchmarks and CPL relationships reflect Google Ads data current as of late 2024/early 2025. Platform algorithms and auction dynamics change continuously. Verify current conditions against your own account data before making significant investment decisions.