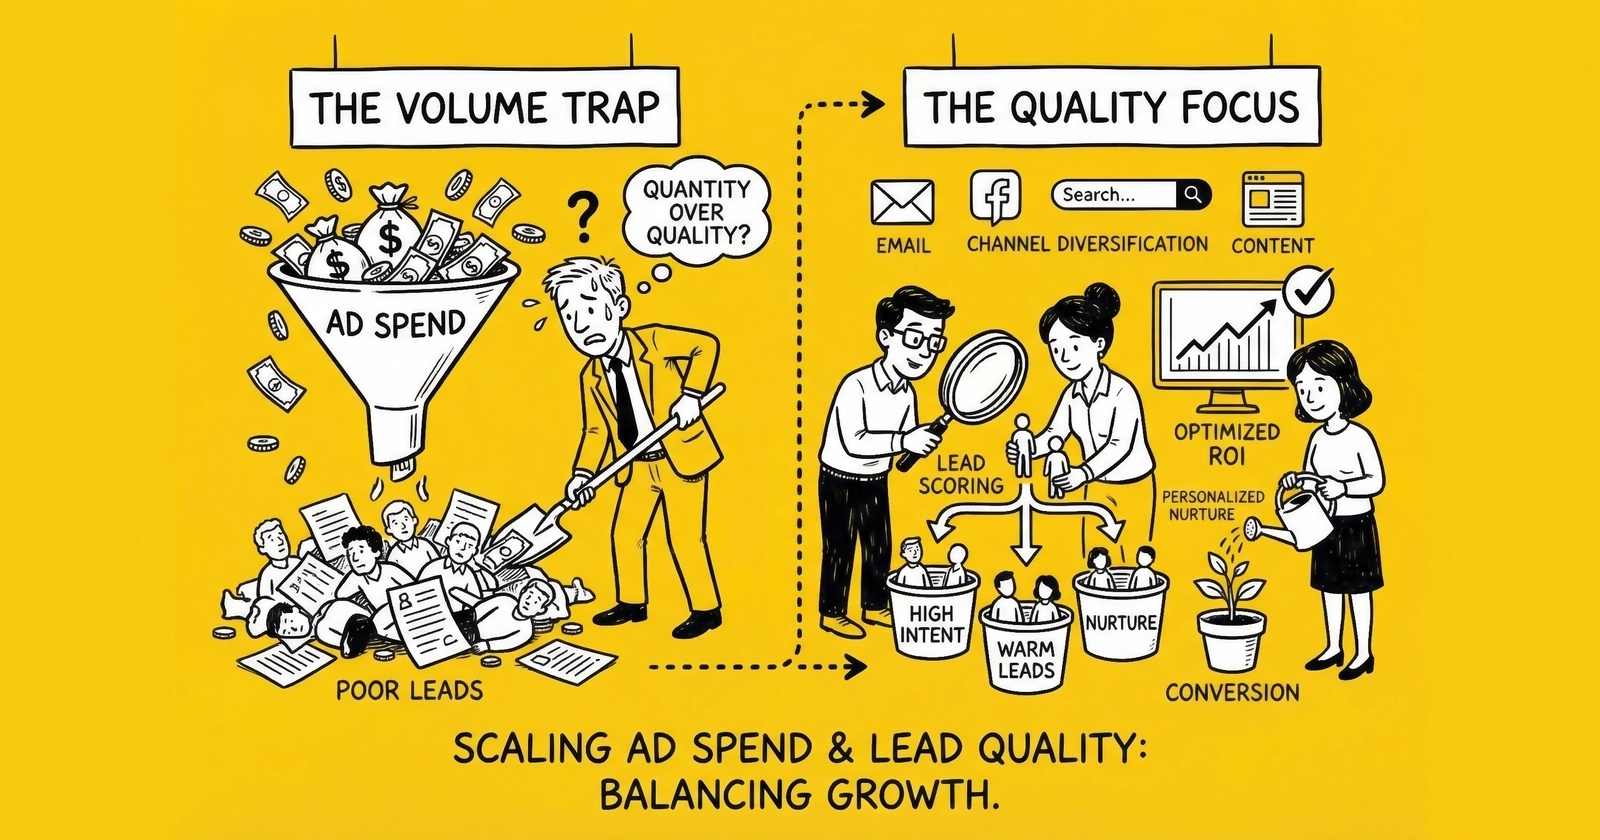
A failure-first examination of what actually goes wrong when lead generation operations scale ad spend aggressively – from $25K to $250K monthly and the wreckage left behind.
Most scaling guides explain what to do. This one examines what operators actually did, and what broke.
The failure patterns are specific. Quality collapse does not arrive as a single catastrophic event. It arrives as a 4% contact rate decline in week two, which becomes 11% by week five, which becomes a buyer pause call in week eight – after the operation has already committed to $180K monthly in spend. By then, cutting back means breaching vendor agreements and losing queue position with three buyers who spent months developing confidence in the volume.
These post-mortems pull from campaigns in insurance, solar, mortgage, and home services that scaled aggressively and hit the walls. The specific numbers differ by vertical. The structural failures repeat.
The Quality Collapse Pattern
Quality does not collapse all at once. It collapses by mechanism, and each mechanism has a different timeline.
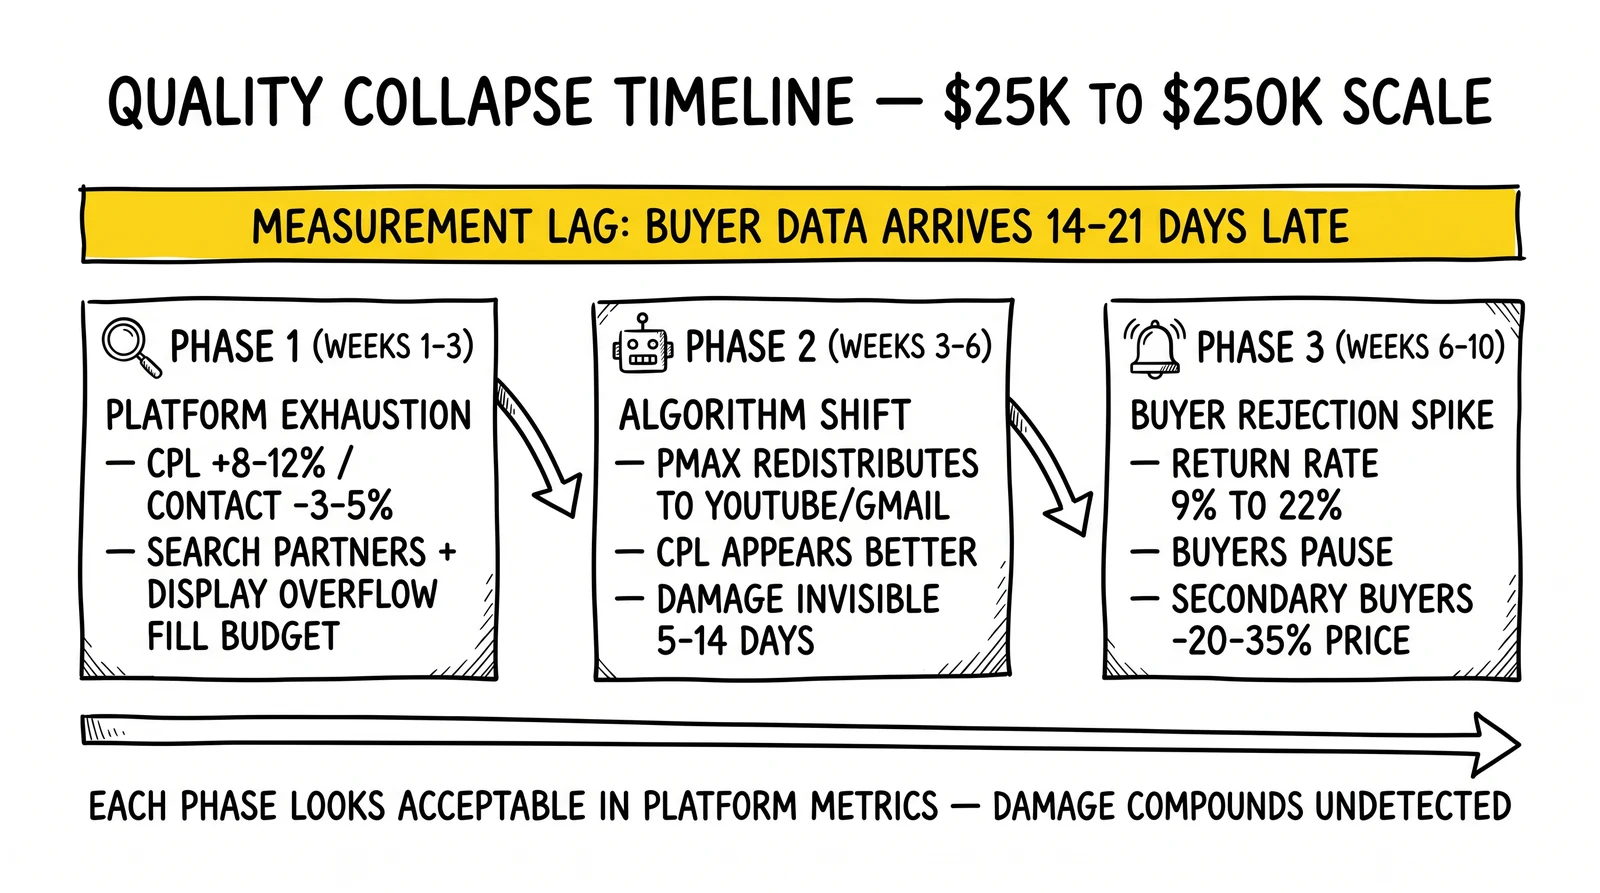
Phase One: The Platform Exhaustion Signal (Weeks 1-3)
At $25K monthly on Google Search, a campaign targeting “auto insurance quotes” in five southeastern states reaches roughly 85% of available high-intent searches within budget. Increase to $50K and the platform faces a choice: charge more for the same inventory or find cheaper inventory to fill the budget. It finds cheaper inventory.
The exhaustion signal is subtle. CPL increases 8-12%, which looks like normal volume-related friction. Contact rates drop 3-5%, which falls within normal variance. The operator reads these as acceptable growth costs.
What is actually happening: the platform has started accessing Search Partner network inventory, Display network overflow, and expanded geographic radius beyond the original targeting. The leads look identical on the form – same demographic profile, same stated intent – but they come from fundamentally different traffic contexts.
A lead captured from a user actively searching “auto insurance quote Georgia” at 10 AM on Tuesday represents different intent than a lead captured from an ad served on a sports score aggregator site to a user who may have clicked inadvertently. Both complete the same form. The buyer’s phone team calls both. One answers.
In the insurance vertical, the exhaustion signal typically arrives between days 14-21 after a 100% spend increase. In solar, it arrives faster – around days 7-12 – because the addressable high-intent audience is smaller and exhausts more quickly.
Phase Two: The Algorithm Shift (Weeks 3-6)
Modern performance campaigns run on machine learning. The algorithm learns what converts. At low spend, “converts” means completing the lead form with high downstream value. At high spend, the algorithm has exhausted that audience and recalibrated “converts” to mean whatever it can find.
Google’s Performance Max campaigns demonstrate this failure mode clearly. A campaign running at $300/day might allocate 90% of spend to Search – the highest-intent channel – based on historical performance data. Increase budget to $1,200/day and Performance Max redistributes to YouTube, Gmail, and Display to fill volume. These channels deliver completions at lower CPL, which the algorithm reports as improved efficiency.
The buyer’s contact center calls those YouTube-sourced leads and finds people who do not remember submitting the inquiry, do not have their insurance information handy, and express surprise at being contacted. Contact rate collapses. Return rate climbs.
Meta’s Advantage+ exhibits parallel behavior. A campaign targeting homeowners in specific income brackets expands to “similar audiences” that may meet some demographic criteria but not the homeownership or income characteristics that determine actual purchase intent.
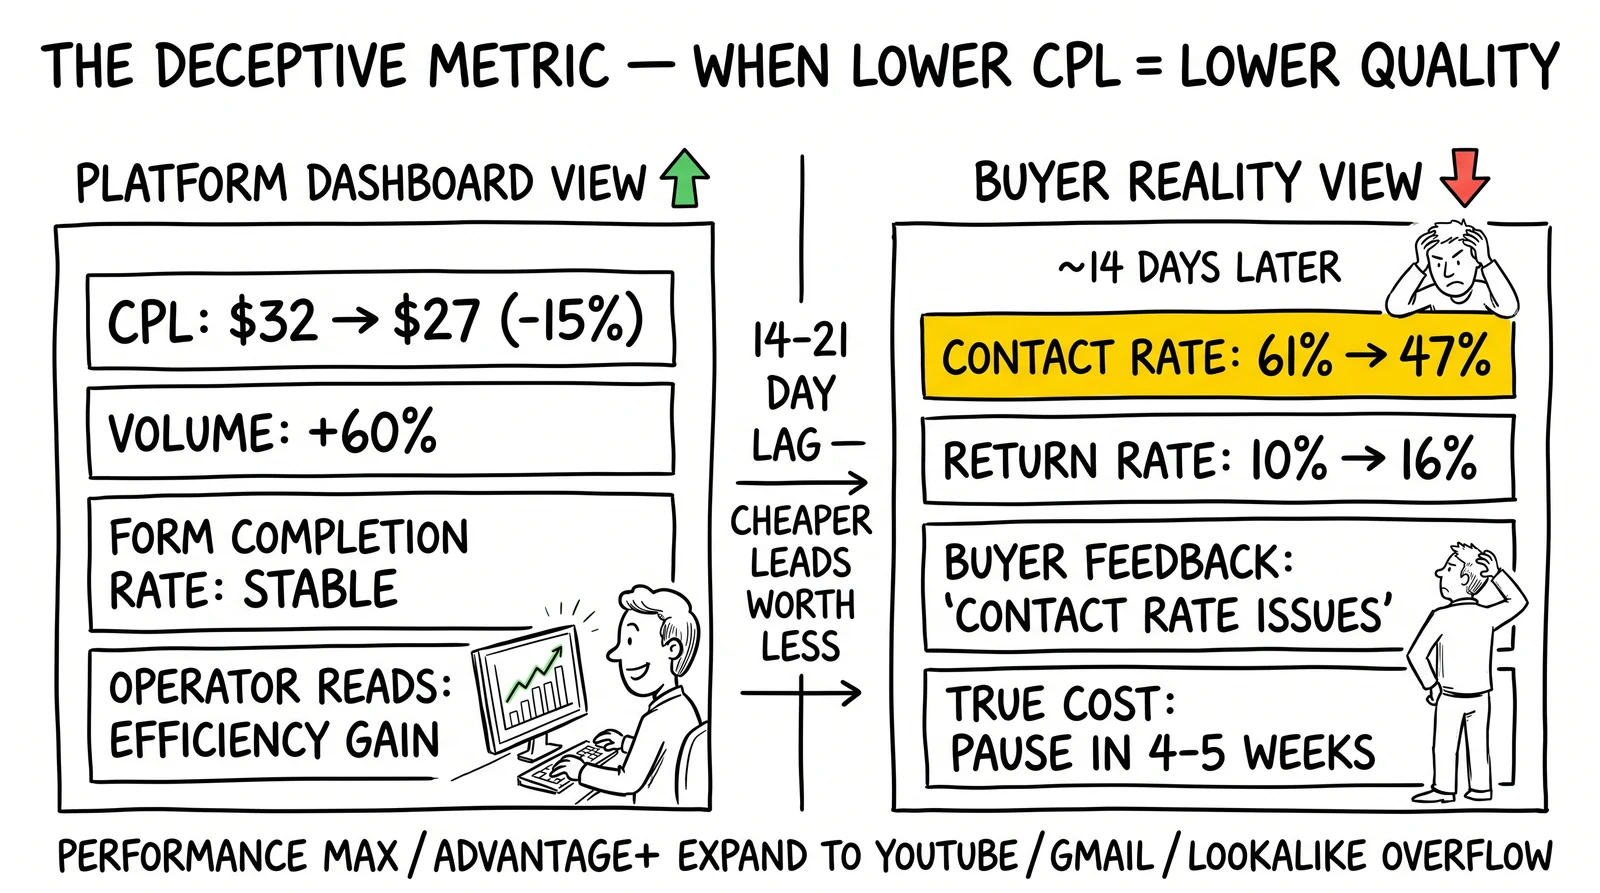
The critical detail: the algorithm shift often looks like improvement on platform metrics. Lower CPL, higher volume, stable form completion rates. The damage only becomes visible when buyer data arrives 5-14 days later – after the operator has already spent two more weeks at elevated budgets.
Phase Three: The Buyer Rejection Spike (Weeks 6-10)
Buyer rejection spikes are lagging indicators. By the time return rates climb from 9% to 22%, the underlying quality degradation has been compounding for six weeks.
The spike triggers a cascade. Buyers pause volume while investigating. The operator, losing primary outlet, routes to secondary buyers at 20-30% lower prices. Margins collapse. Meanwhile, the platform campaigns have already spent the budget for the week.
In one mortgage operation that scaled from $40K to $160K monthly over eight weeks, the sequence looked like this:
- Weeks 1-2: CPL increases 14%, contact rate holds at 61%
- Weeks 3-4: CPL stabilizes, contact rate declines to 54%
- Weeks 5-6: Return rate climbs from 10% to 16%
- Week 7: Primary buyer pauses, cites “contact rate issues” – actual contact rate is now 47%
- Week 8: Operation is running $160K/month generating leads it cannot sell at target pricing
- Weeks 9-12: Spend reduction, quality recovery attempt, buyer re-engagement – total cost in margin destruction exceeds $200K
The operator did not make bad decisions in real-time. The problem was a measurement lag that made the damage invisible until it was already compounding.
Creative Fatigue: Faster Than Expected
Creative fatigue timelines surprise almost every operator who has not tracked them explicitly. The common assumption: rotate creative quarterly. The reality: aggressive scaling burns creative 4-6x faster.
The Frequency Collapse Timeline
At $25K monthly on Meta, a campaign running three creative variants reaches a target audience at roughly 1.5x frequency over 30 days. Each user sees each ad approximately half a time per month. Engagement metrics hold steady. Creative feels fresh.
Scale to $100K monthly and frequency increases to 6-8x. Users see each variant every 3-4 days. Engagement drops first – click-through rates fall 35-45% by day 14. Quality falls second – the remaining clicks come from the bottom of the intent curve, users who were never likely to convert but who eventually clicked from repeated exposure.
This creates a particularly destructive pattern: CPL appears to decrease as spend increases, because click volume stays high while click quality collapses. The operator sees lower CPL and interprets it as improved efficiency. The buyer sees lower contact rates and plans a conversation about pausing.
Documented creative fatigue timelines from campaigns tracked through the full cycle:
| Vertical | Initial Spend | Scale To | Creative Fatigue Onset | Quality Drop at Fatigue |
|---|---|---|---|---|
| Insurance (Meta) | $30K/month | $120K/month | Day 11-14 | Contact rate -22% |
| Solar (Meta) | $20K/month | $80K/month | Day 8-12 | Return rate +14% |
| Mortgage (Meta) | $50K/month | $150K/month | Day 14-18 | Qualification rate -31% |
| Home Services (Meta) | $15K/month | $60K/month | Day 10-15 | Contact rate -18% |
The pattern holds: 4x spend increase cuts creative lifespan to roughly 30-40% of its original duration.
What “Rotating Creative” Actually Requires at Scale
An operator at $30K monthly might maintain five creative variants and rotate one monthly. At $120K monthly, maintaining quality requires 15-20 active variants with 4-6 new variants introduced weekly. This is not a minor operational adjustment – it requires a fundamentally different content production infrastructure.
Operations that did not build this infrastructure before scaling consistently hit the same wall: creative fatigue onset, quality collapse, buyer complaints, emergency creative production under pressure, and a recovery period where the new creative underperforms because the algorithm has to re-learn on degraded audience signals.
The post-mortem pattern: operators acknowledge they knew creative needed to refresh more frequently at scale, but did not resource it before accelerating spend. The creative team lagged the media buy by 3-4 weeks, and those 3-4 weeks cost significantly more than the production investment would have.
Platform Algorithm Shifts: The Invisible Budget Destroyer
Algorithm shifts represent a different category of failure than audience exhaustion or creative fatigue. They arrive externally, often without announcement, and can destroy months of optimization work.
The Google Broad Match Expansion Event
In early 2025, Google adjusted how Phrase Match and Broad Match keywords expanded in Performance Max and Smart Bidding campaigns. Operations that had built stable quality on Exact Match and Phrase Match targeting found their campaigns serving an expanded keyword set that included semantically related but intent-different queries.
A solar campaign targeting “solar panel installation cost” began serving for “how do solar panels work” and “solar energy facts” – informational queries from users in research mode rather than purchase consideration. The lead form captured the same information. The buyer’s qualification team found contacts who could not describe what kind of roof they had or whether they owned their home.
The algorithm shift’s impact was gradual but compounding:
- Week 1 post-shift: No visible metric changes (algorithm still learning)
- Week 2: CPL decreases 8% (shift to cheaper informational-intent traffic)
- Week 3: Contact rate declines 12%
- Week 4: Return rate climbs 7 percentage points
- Week 5: Buyer escalates quality concerns
Operations running manual campaign management with explicit match type controls were less affected. Operations running automated campaign types with broad targeting were hit full force.
The Meta iOS Targeting Degradation
Meta’s targeting capabilities on iOS devices have degraded progressively since Apple’s App Tracking Transparency changes. Operations that built quality metrics on Meta campaigns before mid-2021 found those benchmarks increasingly unreliable as iOS traffic (typically 30-45% of Meta’s audience depending on vertical and geography) became progressively less targetable.
For operations that scaled aggressively through 2024-2025, the practical impact was a slow increase in what we can call “targeting decay” – the growing gap between who the campaign theoretically targets and who actually sees and clicks the ads on iOS devices.
The targeting decay does not show up in audience reports. It shows up in contact rate comparisons between Android and iOS leads (which require phone-level attribution to detect), and in buyer feedback about lead quality from particular geographic markets with higher iOS market share.
Operators who discovered this pattern retroactively found that 20-35% of their contact rate decline was attributable to iOS targeting decay, not campaign optimization failures. The fix – server-side tracking and CAPI integration – recovers some signal, but cannot fully reverse the underlying data loss.
When Algorithm Shifts Meet Scale
The critical compounding factor: algorithm shifts affect operations at scale disproportionately. A $25K monthly operation losing 15% of its quality from a platform change loses $3,750/month in effective value. A $200K monthly operation loses $30,000/month. The second operation also has more buyers affected, more buyer relationships at risk, and more capital committed before the problem becomes visible.
Operators who scaled into algorithm shifts without protective diversification typically recovered on the timeline of 12-16 weeks – the time required to identify the problem, test alternative sources, build quality baselines on new sources, and convince buyers to resume after the pause.
Buyer Rejection Spike Anatomy
Buyer rejection spikes are the most publicly visible failure mode but often the last thing operators investigate deeply. The common response: improve lead quality. The less common but more accurate response: understand why the spike happened at the specific time it did.
The 6-Week Lag Problem
Buyer rejection data has an inherent lag. A lead generated on November 1 reaches the buyer’s sales team on November 1. The contact attempt happens on November 1-3. The qualification assessment happens on November 1-7. The return decision happens on November 7-14. The return is processed and reported on November 14-21.
An operator analyzing return rates on November 21 is looking at quality data from three weeks ago. If they scaled spend on November 1, the return spike they see on November 21 reflects quality at the time of scaling – but by November 21, they have been running at elevated spend for three weeks, compounding the quality problem.
This lag creates a specific failure pattern: operators who scale on a Monday, see no quality signals by Friday, and conclude the quality is holding – then face a return spike in week three that reflects quality from week one.
The Return Rate Cliff
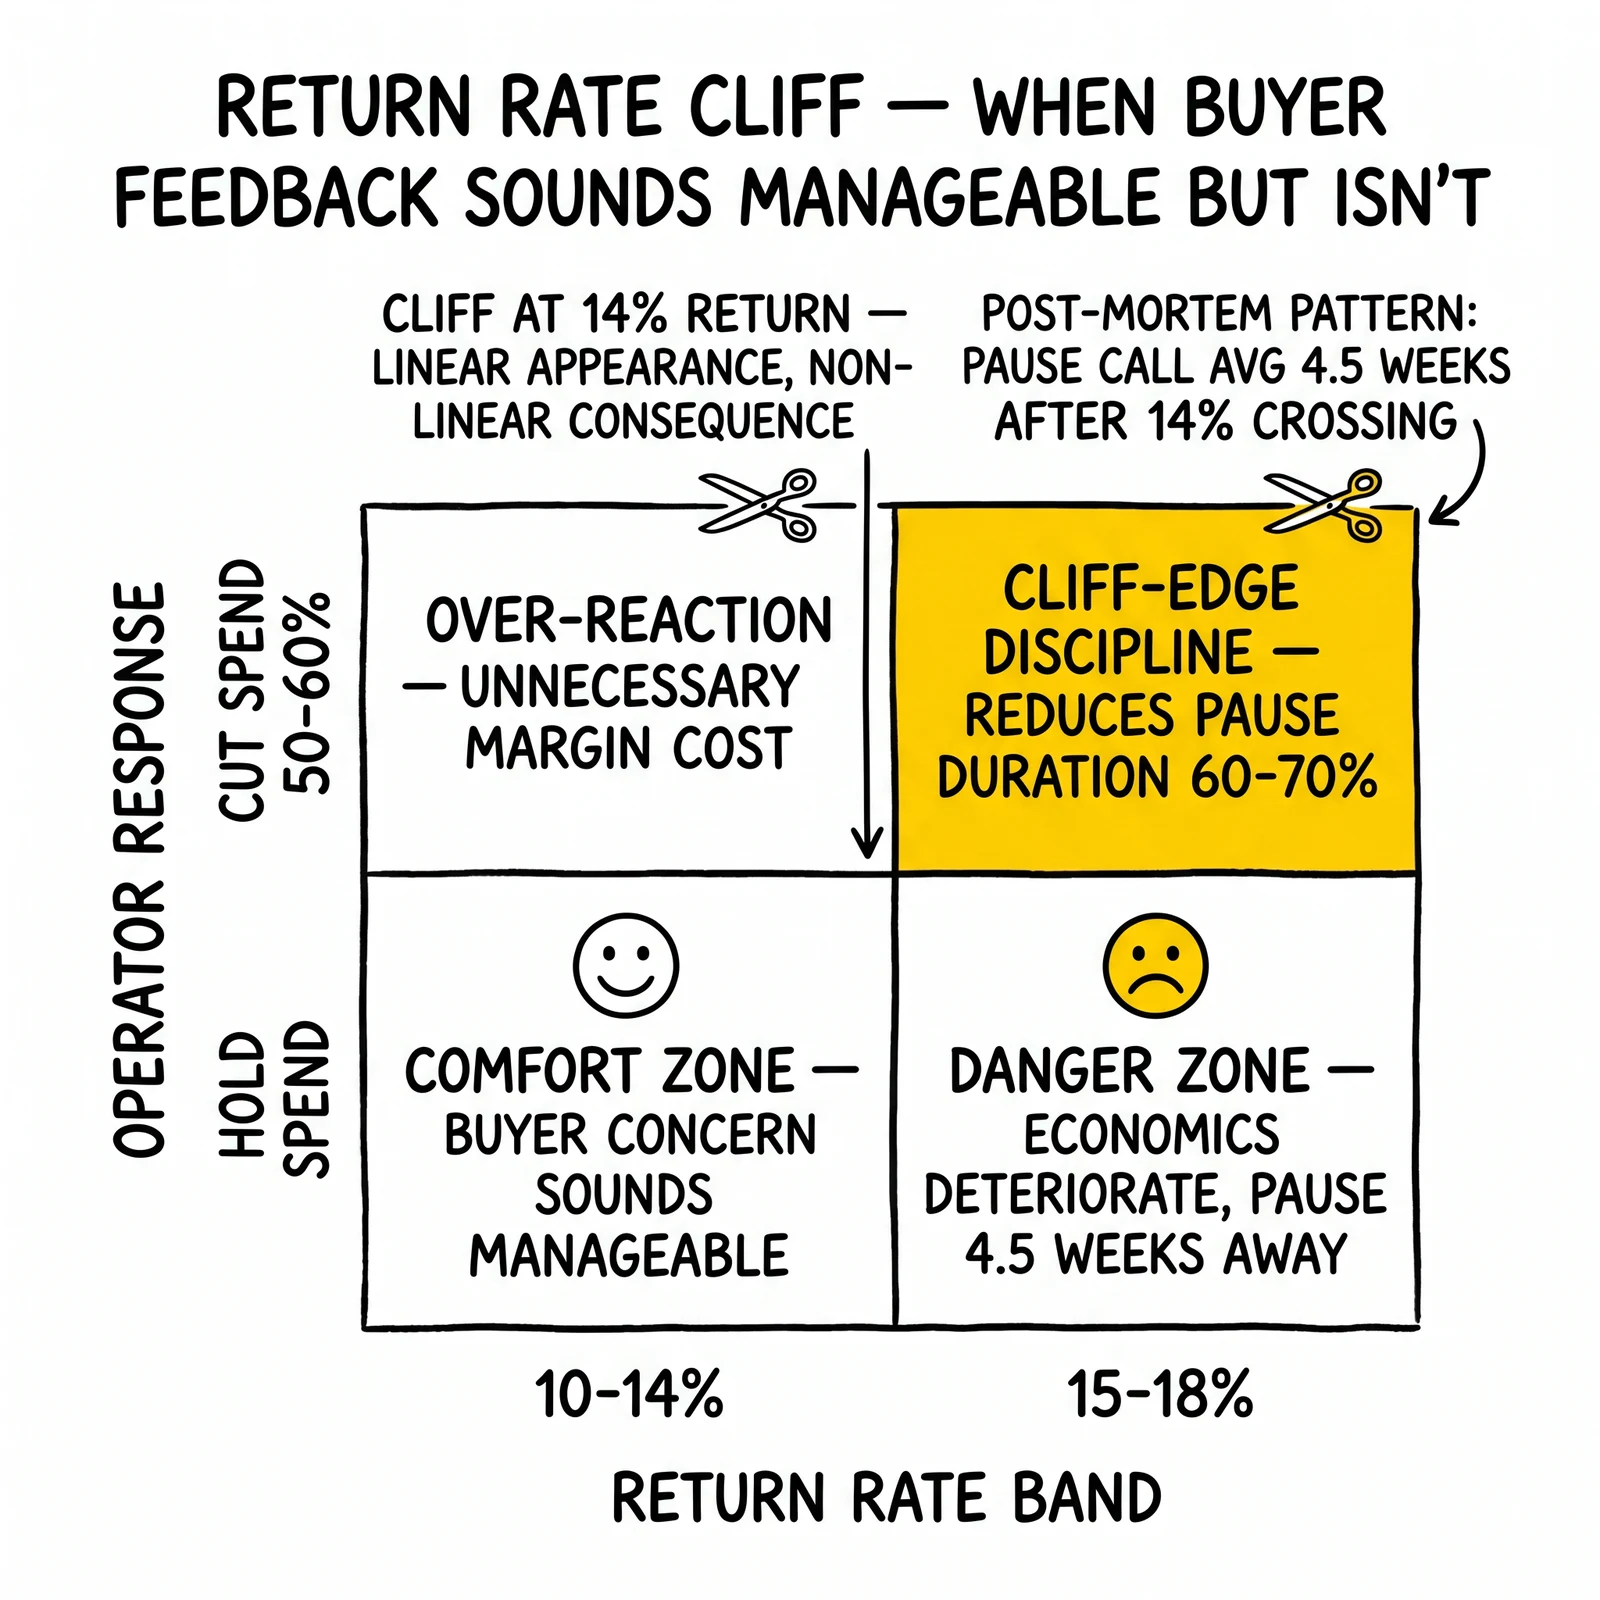
Return rates do not increase linearly during quality degradation. They increase in a cliff pattern.
From baseline 10% return rate through approximately 14% return rate, buyers express concern but continue purchasing. They make calls, request improvements, adjust pricing. At 15-18%, the economics of their sales operation deteriorate to where buying the leads at current prices becomes unprofitable. At 19%+, buyers pause.
The cliff is dangerous because of what happens between 14% and the pause decision. Operators who see return rates at 14% often receive buyer feedback that reads as manageable – “quality has softened, we’d like to see improvement” – and continue operating. Return rates climb to 17%, then 19%, then the pause arrives. By then, the operator has accumulated three additional weeks of buyer expectation that leads will improve, while the underlying quality continues to degrade.
The post-mortem pattern across multiple operations: the pause call came an average of 4.5 weeks after return rates first crossed 14%. Operators who recognized 14% as a cliff edge and cut spend immediately reduced the pause duration by 60-70%.
Vertical-Specific Rejection Timing
Rejection spike timing varies by vertical because sales cycles differ:
Insurance: Short sales cycles mean rejection signals arrive within 7-10 days. A Monday quality collapse shows up as Thursday buyer feedback by the following week. This faster feedback loop gives insurance operations more time to course-correct.
Mortgage: Longer consideration cycles mean rejection signals take 14-21 days to surface. Operators scaling mortgage leads have less time between quality collapse and buyer damage, because by the time the data appears, the problem is already 3 weeks compounded.
Solar: Consultation-heavy sales processes mean qualification failures surface in 10-14 days, but conversion failure data takes 30-60 days. Operators see contact rate issues early but may not see the full rejection impact for 6-8 weeks.
Legal (mass tort): Rejection timelines stretch to 30-45 days as firms assess case quality. Quality collapse can run for two months before the return data creates buyer pressure.
The Cash Flow Trap
Quality failure during scaling creates a cash flow problem that makes recovery harder. This is one of the least-discussed failure modes and one of the most financially destructive.
How the Trap Works
An operation scaling from $50K to $150K monthly typically operates on 30-45 day payment terms with buyers. During the scaling phase, they are spending $150K and collecting on previous months’ $80-100K volume. The float requirement – the gap between spending and collection – increases as volume scales.
When quality fails and buyers pause, incoming payments stop. Outgoing ad spend takes days to reduce (campaigns in flight, platform billing cycles). The operation faces a window of 7-21 days where spend continues at elevated levels while revenue collection stops.
In documented failure cases, the cash flow gap during a pause event ranged from $40K-$120K, depending on the payment timing and the speed at which campaigns could be wound down. Operations without adequate reserves found themselves choosing between cutting campaigns faster than was strategically optimal or drawing on credit at high rates.
The sixty-day float rule for lead generation operations becomes a survival requirement during scaling – not because scaling is likely to fail, but because the combination of quality failure and payment lag creates the largest cash flow stress the operation will face.
The Secondary Buyer Price Compression
When primary buyers pause, operations route to secondary buyers at reduced prices. This compression occurs at the worst possible moment – when volume is high and cost basis is high – creating a margin compression that can turn profitable operations negative.
The typical secondary buyer pricing discount runs 20-35% below primary buyer rates. If primary buyers absorb 70% of volume and secondary buyers take 30% at a 25% discount, the blended revenue decline is approximately 17%. On $150K monthly revenue, that is $25,500/month in margin compression, concurrent with no decrease in ad spend during the first week of the quality event.
What Recovery Actually Looks Like
Recovery from a quality failure during scaling is slower than operators expect. The post-mortem pattern: operators plan 2-3 week recovery. Actual recovery takes 6-10 weeks.
The Buyer Trust Rebuild Problem
Buyers who paused during a quality event do not immediately resume at pre-pause volumes when quality metrics improve. They resume cautiously – typically at 30-50% of previous volume – and require 3-5 weeks of stable quality data before increasing back toward prior levels.
This creates a recovery period where the operation is running at reduced volume, with improved quality, but still not generating the revenue it needs to justify the infrastructure built for higher volume. The fixed cost structure built for $150K monthly revenue sits largely idle while the operation proves its quality at $60K monthly.
The Algorithm Re-Learning Phase
After cutting spend significantly, platform algorithms re-learn against the new, smaller budget. The targeting and creative mix that performed well before the quality event may not re-establish immediately. Operations typically see 2-4 weeks of elevated CPL and variable quality as algorithms recalibrate.
This re-learning cost is invisible in standard analysis. Operators expect to cut back to their previous baseline and see previous baseline performance. Instead, they see 15-25% CPL elevation and 10-15% quality reduction for the first 2-3 weeks of the recovery period.
The algorithm re-learning phase is why aggressive scale-downs followed by rapid scale-ups fail. Each cycle degrades platform performance data, making efficient targeting harder and recovery slower.
The Three-Step Recovery Protocol
Operations that recovered fastest from quality failures followed a consistent pattern:
Step one: Cut spend immediately and decisively. Not 20-30% reduction – 50-60% reduction to a level definitively below the quality collapse threshold. This hurts in the short term but prevents additional compounding.
Step two: Communicate proactively with buyers before they call. Buyers who receive proactive communication recover trust faster than buyers who discover the problem independently. The conversation: “We identified a quality issue originating from [specific source/campaign]. We have reduced volume by X% while we investigate and resolve. We expect to have data on quality recovery by [specific date]. We will check in on [specific date].”
Step three: Identify the specific failure mechanism before resuming scale. Not “quality degraded during scaling” – the specific mechanism: audience exhaustion on a specific platform, creative fatigue in a specific campaign, algorithm shift in a specific campaign type, carrier filtering in a specific SMS flow. Resuming scale without identifying the mechanism means repeating the failure.
Platform-Specific Failure Signatures
Each platform produces characteristic failure patterns. Recognizing the signature helps identify the problem faster.
Google Failure Signatures
Performance Max quality collapse: Return rates spike 8-15 percentage points within 21 days of budget increase. Contact rates hold longer than expected before dropping sharply. The signature is a delay period of apparent stability followed by rapid decline – because Search placements maintain quality briefly while Display and YouTube traffic accumulates.
Smart Bidding over-expansion: CPL decreases while contact rates decline simultaneously. This is the counterintuitive signature of algorithm-driven quality collapse – cheaper leads that are worth less. Operations that celebrate CPL reduction without checking contact rates walk into this failure mode.
Search Partner degradation: Contact rate declines most sharply during specific hours (typically evening hours when Search Partner traffic dominates), while Google.com-origin traffic maintains quality. Requires placement-level reporting to identify.
Meta Failure Signatures
Advantage+ expansion: Geographic drift – leads appearing from ZIP codes outside the original target area. In multi-state campaigns, specific states show elevated return rates while others maintain quality. The signature: buyer reports that leads are “out of our service area” or “don’t know local providers.”
Audience fatigue: Contact rate decline correlates with frequency increase. Frequency metrics above 3.0 in any 7-day window, concurrent with contact rate decline, is the classic fatigue signature.
Lookalike degradation: Lookalike audiences based on historical conversion data degrade over time as the seed audience becomes less representative of current converters. Campaigns running on lookalikes built more than 6 months prior show progressive quality decline even with stable creative and budget.
Multi-Platform Failure Signatures
Budget concentration failure: One platform receives >60% of total spend and shows quality decline while others hold. The signature is quality divergence between platforms – some holding, one failing.
Simultaneous exhaustion: All platforms show quality decline simultaneously following a large budget increase across all channels. This indicates the overall scale exceeded what the market could support with quality inventory.
Frequently Asked Questions
What is the most common reason scaling from $25K to $100K monthly fails within 90 days?
Platform audience exhaustion combined with a measurement lag that makes the problem invisible until it is already compounding. The operator sees acceptable early metrics, continues scaling, and faces buyer rejection spikes 5-7 weeks after the quality started degrading. By then, they have accumulated months of buyer expectation damage and a cash flow problem from elevated spend concurrent with reduced revenue.
How long does creative fatigue take to cause real quality problems at 4x scale?
In the insurance and solar verticals on Meta, creative fatigue creates measurable quality problems within 11-14 days of a 4x spend increase. Mortgage takes slightly longer – 14-18 days – because the audience is more tolerant of repeated exposure. Home services is fastest – 8-12 days. The key point: most operators think quarterly about creative rotation. At 4x scale, the rotation requirement becomes weekly.
How do you distinguish algorithm noise from real quality degradation in the first two weeks?
Look for the directional pattern across multiple metrics simultaneously. Algorithm noise produces metric fluctuations that are inconsistent – some metrics up, some down, reverting within 48-72 hours. Real quality degradation produces consistent directional movement: contact rate declining, qualification rate declining, return rate increasing, all moving the same direction over multiple measurement periods. When two or more quality metrics move in the same direction for two consecutive weekly measurement periods, treat it as real degradation, not noise.
What is the realistic recovery timeline after a quality failure that caused a buyer pause?
Six to ten weeks for full recovery to pre-failure buyer confidence and volume levels. The first two weeks are spend reduction and quality stabilization. Weeks three and four are proactive buyer communication and limited volume tests to establish quality data. Weeks five through eight are gradual buyer volume recovery as trust rebuilds. The recovery timeline can be compressed if the failure mechanism is identified quickly and the operation demonstrates it is resolved – not improved, resolved.
What percentage of quality failures during scaling are caused by algorithm changes versus operator decisions?
The post-mortem data points toward approximately 60-70% of quality failures being operator-decision related – scaling too fast, inadequate creative rotation, insufficient source diversification, poor threshold monitoring. The remaining 30-40% involve platform algorithm shifts or external factors that would have been difficult to anticipate. However, operations with proper monitoring and diversification catch algorithm shifts faster and limit the damage, so the practical impact of external factors is amplified in operations with poor monitoring.
Can scaling be resumed after a quality failure, or does the failure permanently damage the operation?
Scaling can typically be resumed successfully after quality failure, but the path back is slower than operators expect. The keys: identify the specific failure mechanism before resuming; rebuild quality at reduced spend before increasing; communicate proactively with buyers throughout recovery; and do not resume to the same scale using the same approach – modify the scaling strategy based on what the failure revealed. Operations that resume identical strategies after quality failures typically repeat the failure within 60-90 days.
Key Takeaways
Quality failures during scaling follow predictable mechanisms: audience exhaustion, algorithm shifts, creative fatigue, and buyer rejection spikes. Each has a characteristic timeline and signature. Recognizing the mechanism early – rather than responding to buyer complaints – is the difference between a contained quality event and an existential one.
The measurement lag is the fundamental enemy. Buyer feedback arrives 14-21 days after quality degrades. An operation that sees “acceptable” metrics on day 7 and scales further has already committed to the damage it will face on day 21.
Creative rotation requirements at scale are not incremental adjustments to a functional system. They are a different operational model. Operations that scale budgets without scaling creative infrastructure consistently hit the same wall.
Recovery takes longer than operators plan for. The buyer trust rebuild, algorithm re-learning, and quality stabilization period typically adds up to 6-10 weeks – not the 2-3 weeks operators estimate when planning recovery.
The cash flow trap during quality failure is frequently underestimated. Float requirements during scale-up, combined with payment lag during buyer pauses, create the largest capital requirement the operation will face. Planning for this before scaling is not pessimistic – it is operational.
The lead operations that scale from $25K to $250K without catastrophic failure share a common discipline: they monitor for failure signatures rather than waiting for buyer complaints. The complaints arrive too late to be useful. The signatures arrive in time to act.
Sources
- InsideSales.com / MIT Lead Response Management Study (lead contact timing and conversion rates)
- Apple App Tracking Transparency documentation and third-party audience signal impact studies
- The Campaign Registry (TCR) carrier filtering and deliverability documentation
- WebRecon TCPA litigation tracking data
- Google Ads Performance Max campaign type documentation and placement reporting specifications
- Meta Business Suite Advantage+ campaign targeting documentation