Undercapitalization kills more lead generation businesses than competition. Learn the working capital requirements that determine survival – and how to calculate exactly how much float your operation needs.
Cash flow, not profit, determines survival in lead generation.
This statement confuses newcomers. They run profitable P&Ls while their bank accounts hemorrhage toward zero. They sign bigger buyer contracts while making increasingly desperate calls to factoring companies. They celebrate record months while quietly missing payroll.
The disconnect between profit and cash creates cognitive dissonance that traps even experienced business operators. How can a business be dying while growing? How can success create failure? The answer lies in timing.
The lead generation industry operates on a fundamental timing mismatch that makes cash flow management more critical than in almost any other business model. You pay for traffic today. You collect from buyers in thirty, forty-five, or sixty days. Every dollar of growth widens that gap. Scale becomes a cash trap for the underprepared.
Bank studies consistently show that 82% of small business failures stem from cash flow problems. In lead generation, the numbers are worse. The industry’s payment timing dynamics create structural cash flow challenges that catch even experienced business owners off guard.
This guide gives you the frameworks to survive and scale. The math is unforgiving, but the solutions are knowable.
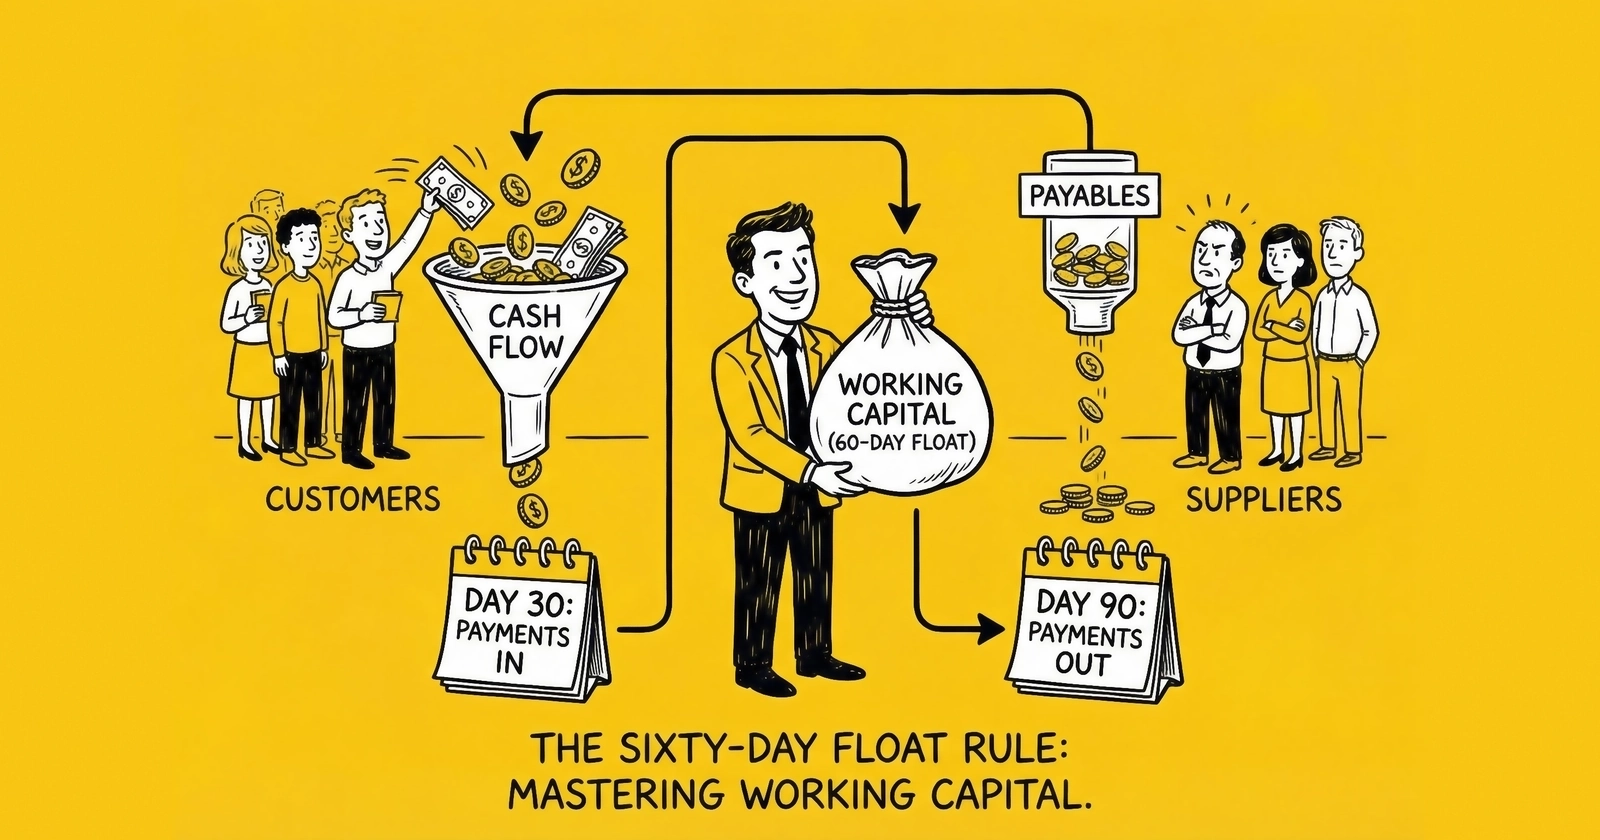
What Is Float in Lead Generation?
Float is the amount of cash you need on hand to bridge the gap between paying for leads and getting paid for them. It represents money locked in the cash conversion cycle – capital that’s already been spent but hasn’t yet returned as collected revenue.
In most businesses, the gap between spending and collection is measured in days or a couple of weeks. In lead generation, it stretches to two months. This creates a working capital requirement that scales with volume, compounds with growth, and cannot be negotiated away.
The Timing Gap Explained
The fundamental problem is structural. Traffic platforms demand immediate payment. Google charges your credit card daily. Facebook bills weekly. Native platforms often require prepayment. There is no net-30 from Meta. You pay before you see a single conversion.
Meanwhile, lead buyers operate on standard accounts payable cycles. Insurance carriers have corporate finance departments that process invoices monthly. Mortgage lenders have established AP systems that don’t bend for lead vendors. Even buyers who want to pay faster often can’t – their systems aren’t built for it.
This creates an unavoidable gap: your money goes out immediately, but your revenue comes back in 30 to 60 days.
Why This Matters More Than Margin
Consider a concrete scenario. You generate 1,000 leads at $25 cost and sell them at $50, yielding $25,000 gross profit on $50,000 revenue. Your cost structure looks healthy: 50% gross margin, solid contribution to overhead.
But your cash flow tells a different story.
Week 1: You spend $25,000 on traffic. Cash position: negative $25,000.
Weeks 2-3: Leads delivered and invoiced. Cash position: negative $25,000 (no change – invoices aren’t cash).
Weeks 4-5: Buyer processes invoice. Cash position: negative $25,000 (still waiting).
Week 6: Payment received for $48,000 (after 4% returns). Cash position: positive $23,000.
You’ve made $23,000 in profit, but you needed $25,000 available for six weeks to make it happen. Now multiply this by fifty-two weeks and continuous scaling. The capital requirement becomes enormous.
The 60-Day Rule Explained
The 60-day float rule states: maintain a cash reserve equal to sixty days of operating expenses plus media spend before scaling traffic. This number isn’t arbitrary – it’s derived from the actual cash conversion cycle in lead generation.
The Cash Conversion Timeline
Here’s how the typical cash cycle works:
Day 1: You run a paid search campaign and your credit card gets charged.
Days 3-7: Those clicks convert into leads on your landing pages.
Days 7-14: You deliver those leads to buyers through your distribution system.
Days 30-45: Those buyers process your invoices and issue payment.
Days 45-60: That payment clears into your operating account.
Throughout this entire cycle, you’re continuing to spend on media. Day two’s traffic costs hit your card while day one’s leads haven’t even been invoiced yet. Day fifteen’s campaigns are running while day one’s payments are still thirty days away from collection.
Payment Terms Breakdown
Understanding typical payment terms reveals why sixty days is the minimum:
| Party | Typical Terms | Your Cash Impact |
|---|---|---|
| Google Ads | Daily billing, due immediately | Cash out Day 1 |
| Facebook Ads | Weekly billing, due within 7 days | Cash out Days 1-7 |
| Publishers/Affiliates | Net-7 to Net-15 | Cash out Days 7-15 |
| Lead Buyers | Net-30 to Net-45 | Cash in Days 30-45 |
| Enterprise Buyers | Net-45 to Net-60 | Cash in Days 45-60 |
| Payment Processing | 3-5 business days | Additional delay |
The math creates a 45 to 60-day gap between outflow and inflow. Add time for payment processing, returns and disputes, and you’re looking at a full 60-day float requirement at minimum.
What the 60-Day Requirement Actually Means
If you spend $10,000 per day on traffic and collect net-45, you need approximately $450,000 to $600,000 floating at any given time just to maintain operations. This is before accounting for growth, returns, or delayed payments.
The float requirement equals your daily cash outflow multiplied by 60 days:
Daily Media Spend + Daily Operating Expenses x 60 = Float Requirement
For a business spending $333 per day on traffic (roughly $10,000 monthly), the float requirement is approximately $20,000 to $30,000. For a business spending $3,333 per day ($100,000 monthly), the requirement jumps to $200,000 to $300,000.
Calculating Your Float Requirements
Working capital requirements vary dramatically based on operational scale. Understanding these thresholds helps you plan financing before you hit crisis points.
Working Capital by Volume Tier
| Monthly Lead Volume | Monthly Media Spend | Working Capital Needed | Typical Funding Source |
|---|---|---|---|
| 5,000-10,000 leads | Under $50K | $100K-$150K | Personal savings, credit cards |
| 10,000-25,000 leads | $50K-$100K | $150K-$300K | Personal capital plus factoring |
| 25,000-50,000 leads | $100K-$200K | $300K-$600K | Lines of credit, revenue-based financing |
| 50,000-100,000 leads | $200K-$500K | $500K-$1M | Bank credit facilities |
| 100,000+ leads | $500K+ | $1M-$10M+ | Institutional credit, private equity |
The Float Calculation Formula
Calculate your specific float requirement using this formula:
Float Requirement = (Average Daily Spend x Days to Collection) + Return Reserve
Where:
- Average Daily Spend = Total monthly costs / 30
- Days to Collection = Weighted average of buyer payment terms + processing time
- Return Reserve = 10-20% buffer for disputed leads and returns
Example Calculation:
Monthly media spend: $100,000 Monthly operating costs: $30,000 Total monthly spend: $130,000 Daily spend: $4,333
Weighted average collection: 45 days Basic float: $4,333 x 45 = $195,000
Return reserve (15%): $29,250 Total Float Required: $224,250
Why Return Reserves Matter
Returns create additional timing complications. Most buyer agreements allow returns within 7 to 14 days for duplicate leads, disconnected phones, or invalid data. If a buyer returns leads after you’ve paid your supplier, you bear the loss unless you can dispute it upstream.
These returns often cluster unpredictably, creating cash flow spikes that can overwhelm under-reserved operations. Understanding lead return rate benchmarks helps operators set appropriate reserve levels. A 10% return reserve – held separately from operating capital – provides buffer against this timing mismatch.
Why Undercapitalization Kills Businesses
The fundamental problem is that growth accelerates cash consumption, not profit. When you’re stable – spending the same amount each month, collecting consistent payments – your float requirement remains constant. You funded that sixty-day gap once, and payments roll in to cover ongoing operations.
But the moment you grow, everything changes.
The Growth Paradox
Each incremental dollar of traffic spend widens the gap. Increased volume means delayed collections on a larger base. Faster scaling means you’re funding more and more “day zero” spending before “day sixty” collections catch up.
A business growing 20% month-over-month – not unusual for a successful lead operation – needs to fund that incremental growth for sixty days before seeing any return. The private equity consolidation trend in lead generation often brings capital that solves this growth financing challenge:
Month 1: $100,000 spend, $120,000 additional float needed Month 2: $120,000 spend, $144,000 additional float needed (20% of $120K on 60-day delay) Month 3: $144,000 spend, $172,800 additional float needed
By month six, you’ve invested hundreds of thousands in growth capital that hasn’t cycled back yet.
The math creates a paradox: the faster you grow, the more cash you need, even as profitability improves. Success can bankrupt you if you don’t plan for it.
Common Undercapitalization Traps
The “Successful Month” Trap: A particularly strong month – higher volume, better conversion rates, improved margins – creates confidence precisely when it should create caution. That strong month increases the float requirement for the following months. Without additional capital, operators find themselves stretched thin exactly when they should be celebrating success.
The “I’ll Grow Into It” Trap: Operators assume that revenue growth will naturally fund the working capital increase. But the lag means you need the capital 60 days before the revenue arrives. By the time you realize the gap, you’re already underfunded.
The “Credit Card” Trap: Using credit cards to fund float works at small scale, but cards have limits and require monthly payments. A $50,000 limit sounds generous until you’re spending $3,000 daily on traffic.
Float Cost: The Hidden P&L Line Item
Float isn’t free. The capital tied up in your cash conversion cycle has a cost, whether you’re using your own money (opportunity cost) or borrowed money (interest cost).
Calculating Your Float Cost
The cost of float equals your average receivables multiplied by your annual cost of capital, divided by 12 for monthly cost:
Monthly Float Cost = Average Receivables x (Annual Cost of Capital / 12)
Example:
Average receivables: $300,000 Annual cost of capital: 12% (line of credit rate) Monthly float cost: $300,000 x (0.12 / 12) = $3,000/month
That’s $36,000 annually – pure cost of doing business that most practitioners never account for in their unit economics.
Float Cost by Financing Method
| Financing Source | Approximate Annual Rate | Float Cost per $100K |
|---|---|---|
| Credit cards (if carrying balance) | 18-26% | $18,000-$26,000 |
| Factoring | 15-36% (effective) | $15,000-$36,000 |
| Revenue-based financing | 25-45% (effective) | $25,000-$45,000 |
| Bank line of credit | 8-15% | $8,000-$15,000 |
| SBA-backed line | 10-13% | $10,000-$13,000 |
| Personal capital (opportunity cost) | 8-12% | $8,000-$12,000 |
Impact on Unit Economics
most practitioners calculate unit economics as:
Revenue per lead - Cost per lead = Gross margin
But true unit economics must include float cost:
Revenue per lead - Cost per lead - (Float cost per lead) = True gross margin
For a business with $300,000 average receivables generating 10,000 leads monthly at 12% annual capital cost:
Float cost per lead: $3,000 monthly cost / 10,000 leads = $0.30 per lead
On a lead with $5 gross margin, that $0.30 represents 6% margin erosion. At higher capital costs or longer collection cycles, this erosion increases significantly.
Strategies to Reduce Float Requirements
The timing mismatch is structural, but it can be compressed. Every day you shift in your favor reduces working capital requirements and improves true profitability.
Strategy 1: Faster Buyer Payments
Offer early payment discounts. A 2% discount for payment in fifteen days rather than forty-five might seem expensive, but calculate the effective APR. If you’re paying 12% to 24% annually for working capital, 2% for thirty days of acceleration is economically superior. Many corporate buyers have treasury functions seeking early payment discount opportunities.
Require deposits from new buyers. Until a buyer establishes payment history, require 25% to 50% prepayment. Position this as standard onboarding procedure. You’re extending them credit – deposits are normal.
Negotiate shorter terms with reliable buyers. If a buyer has paid on time for twelve months, propose moving from net-45 to net-30 in exchange for volume commitment or modest price discount. The working capital benefit often exceeds the price concession.
Net-15 vs. Net-30 vs. Net-45 Impact:
| Payment Terms | Float Days Saved vs. Net-45 | Cash Freed per $100K Revenue |
|---|---|---|
| Net-15 | 30 days | $100,000 (full cycle faster) |
| Net-30 | 15 days | $50,000 |
| Net-45 | 0 days | $0 (baseline) |
Strategy 2: Slower Publisher Payments
Negotiate extended terms with suppliers. Move from net-7 to net-15 or net-30 where possible. Every day of extension reduces your float requirement.
Use credit cards strategically. A business credit card with thirty-day billing plus twenty-five-day grace period gives you fifty-five days of float on purchases. This is interest-free float if you pay in full.
Negotiate quarterly payments where possible. Landlords, some technology platforms, and professional services may prefer predictable quarterly payments.
Strategy 3: Prepayment Programs
Create prepayment incentives. Offer buyers 3-5% discount for quarterly prepayment. You receive cash now; they lock in favorable pricing.
Implement deposit structures. For exclusive leads or premium verticals, require deposits that reduce float exposure.
Strategy 4: Credit Facilities
Establish lines of credit before you need them. Revenue-based financing, factoring, and lines of credit are available to lead generation businesses with documented cash flows. Build these relationships when your business is healthy – not when you’re in crisis.
Current credit options and rates (late 2025):
- Bank lines: Prime + 1.75% to Prime + 9.75% (approximately 8.75% to 16.75%)
- SBA-backed lines: Starting around 10.5%
- Online lenders: 20% to 35% APR
- Factoring: 85-93% advance rate, 1-5% fees (24%+ effective APR)
The right line of credit size covers sixty to ninety days of operating expenses. Unused lines don’t cost much (modest annual fees), but maintain utilization below 50% to preserve your credit profile.
Vertical-Specific Float Considerations
Different lead generation verticals create different working capital dynamics. Understanding how your specific vertical affects cash flow helps calibrate float requirements appropriately.
Insurance Lead Operations
Insurance lead operations often benefit from faster payment terms than average. Insurance carriers and agencies typically pay net-15 to net-30, and some carriers offer prepayment programs for high-volume, high-quality suppliers. Return windows are well-defined (typically 7-14 days), making cash flow prediction more reliable.
However, insurance carries seasonality risks. AEP/OEP for Medicare creates concentrated volume that requires float capacity exceeding normal months. P&C insurance fluctuates with carrier appetite – when carriers tighten underwriting, lead acceptance drops and return rates rise, compressing effective revenue while float remains locked.
Mortgage Lead Operations
Mortgage presents the most volatile float requirements. Rate sensitivity creates dramatic volume swings – when rates drop, refinance volume surges, requiring immediate scaling capacity. When rates rise, volume collapses, leaving operators with float committed to traffic programs that no longer deliver expected returns.
Payment terms in mortgage tend toward the longer end (net-30 to net-45), and return windows can extend based on loan processing timelines. Operators should maintain float reserves 20-30% above baseline calculations to accommodate rate-driven volatility.
Legal Lead Operations
Legal leads, particularly personal injury, often provide the most favorable float economics. Attorneys on contingency arrangements need cases urgently and frequently offer net-15 terms or even prepayment for quality leads. Return windows are short because attorneys quickly assess case merit.
The trade-off is higher CPLs that require larger absolute float despite faster turnover. A $300 CPL operation with 15-day collection cycles still requires significant capital – the faster turnover helps but does not eliminate float requirements.
Float During Growth Phases
The transitions between scales create the most dangerous moments. Businesses often grow from micro to small organically, then hit a wall where their capital structure cannot support continued expansion.
Scale Transition Points
| Current Scale | Target Scale | Float Increase Needed | Danger Zone |
|---|---|---|---|
| $50K spend | $100K spend | +$150K-$200K | 60-90 days of scaling |
| $100K spend | $200K spend | +$200K-$400K | 90-120 days of scaling |
| $200K spend | $500K spend | +$600K-$1M | 120-180 days of scaling |
The Scale Transition Problem
The capital that worked at $40,000 monthly spend suddenly becomes insufficient at $60,000. Revenue grew 50%, but working capital requirements may have grown 100%. Planning for scale transitions before you hit them is essential.
Pre-transition checklist:
- Calculate working capital required at target scale
- Identify financing sources for the gap
- Establish credit facilities 90+ days before needed
- Build cash reserves during stable periods
- Model worst-case scenarios (slower collections, higher returns)
Growth Pacing Decisions
The most important financing decision isn’t how to fund growth but how fast to grow.
Conservative pacing (20-30% annual growth): Maintains financial flexibility, reduces external capital dependency, allows gradual team and process scaling. Risk: competitive displacement by faster operators.
Moderate pacing (30-50% annual growth): The most common successful path – fast enough to matter, slow enough to manage.
Aggressive pacing (50-100%+ annual growth): Captures market share but creates operational and financial risk. Requires robust capital base and operational readiness.
One principle holds universally: underfunded aggressive growth destroys more lead generation businesses than conservative growth ever did. If you’re going to scale fast, ensure your capital base supports it.
Managing Float During Market Disruptions
External events can disrupt carefully planned float management. Rate changes in mortgage, carrier appetite shifts in insurance, regulatory changes affecting lead practices, and economic downturns that reduce buyer demand all create float stress that cannot be predicted through normal forecasting.
The most resilient operations maintain buffer reserves beyond calculated requirements – typically 15-25% additional capacity held in reserve for unexpected disruptions. This buffer appears expensive during stable periods but becomes essential when market conditions shift rapidly.
Pandemic disruptions in 2020-2021 demonstrated the importance of buffer reserves. Operations with adequate float survived temporary buyer payment delays and marketplace disruptions. Operations running at calculated minimums faced existential crisis when collection cycles extended by even two weeks.
Cash Flow Forecasting for Lead Businesses
You cannot manage what you cannot see. Cash flow forecasting transforms reactive panic into proactive planning.
The 13-Week Cash Flow Model
The gold standard for operational cash management is the 13-week cash flow forecast. Real-time analytics help operators maintain visibility into cash positions, though batch processing often suffices for financial forecasting. This model provides weekly granularity over a full quarter – enough detail to catch timing issues, enough duration to see patterns and plan interventions.
Building your 13-week model requires three components:
- Beginning cash: What’s in your accounts today
- Cash inflows: Everything coming in (categorized by timing certainty)
- Cash outflows: Everything going out (by category and timing)
The output: projected ending cash position for each of the next thirteen weeks, revealing when you’ll have surplus and when you’ll face shortage.
For lead generation businesses, structure around these categories:
Cash Inflows:
- Regular buyer payments (by client and payment term)
- Return credits received
- Prepayments from new buyers
- Other income (interest, refunds, affiliate commissions)
Cash Outflows:
- Media spend (by platform and billing cycle)
- Payroll and contractor costs
- Technology subscriptions and platforms
- Publisher payments
- Rent and overhead
- Professional services (legal, accounting)
- Loan payments and credit card obligations
- Tax obligations
Early Warning Indicators
Establish early warning indicators that trigger action before problems manifest:
| Indicator | Yellow Warning | Red Alert |
|---|---|---|
| DSO Trend | +3 days vs. baseline | +7 days vs. baseline |
| Buyer Payment Stretch | 1-2 buyers past terms | 3+ buyers past terms |
| Credit Utilization | Above 75% | Above 90% |
| Return Rate | +2% vs. baseline | +5% vs. baseline |
| Cash Reserve | Below 45-day cover | Below 30-day cover |
Monitor DSO weekly, not monthly. If your trailing Days Sales Outstanding creeps up even slightly – from 42 days to 45 days over several weeks – you’re seeing the leading edge of a collection problem.
Track buyer payment behavior individually. A single buyer stretching from net-30 to net-40 matters. A pattern of multiple buyers stretching simultaneously signals either your collection process or broader market conditions need attention.
Frequently Asked Questions
What is float in lead generation?
Float is the working capital required to bridge the gap between when you pay for leads (or traffic to generate leads) and when buyers pay you for those leads. In lead generation, you typically pay traffic platforms immediately and publishers within 7-15 days, but buyers pay you in 30-60 days. This 45-60 day gap multiplied by your daily cash outflow equals your float requirement.
Why is 60 days the standard float requirement?
The 60-day standard reflects the actual cash conversion cycle in lead generation: Day 1 you pay for traffic, Days 7-14 leads are delivered, Days 30-45 buyers process invoices, Days 45-60 payment clears to your account. Add time for processing delays and return windows, and 60 days represents the minimum safe buffer between outflow and inflow.
How much working capital do I need for 10,000 leads per month?
For 10,000 leads monthly, expect working capital requirements of $150,000 to $200,000. This assumes average cost per lead of $15-25, net-45 buyer payment terms, and a 15% buffer for returns. Operations with higher CPLs, slower-paying buyers, or aggressive growth plans need correspondingly more capital.
Can I start a lead generation business with less capital?
You can start at micro-scale ($5,000-$25,000 monthly spend) with personal savings and credit cards. The float requirement at this level is $50,000-$100,000. However, growth will be constrained until you secure additional capital. Many practitioners bootstrap through this phase using credit card float (30-day billing plus 25-day grace period provides 55 days of interest-free float).
What is factoring and should I use it?
Factoring converts accounts receivable into immediate cash by selling your invoices to a factoring company at a discount (typically 85-93% of face value). Factoring makes sense when growth opportunity exceeds factoring cost, your buyers have strong creditworthiness, and you lack access to cheaper capital. Factoring is expensive (24%+ effective APR) compared to traditional credit, but doesn’t require collateral and scales automatically with revenue.
How does growth affect my float requirement?
Growth accelerates cash consumption. A business growing 20% month-over-month needs to fund that incremental growth for sixty days before seeing any return. If you grow from $100,000 to $120,000 monthly spend, you need $120,000 additional float immediately, but that $120,000 won’t return for 60 days. This paradox explains why profitable, growing businesses still face cash crises.
What payment terms should I negotiate with buyers?
Push for net-15 where possible, accept net-30 as standard, and avoid net-45 or longer if you have leverage. Offer 2% discount for net-15 payment – this is economically superior to paying 12%+ annual interest on working capital. For new buyers, require 25-50% prepayment until they establish payment history.
How do I calculate my cost of float?
Monthly Float Cost = Average Receivables x (Annual Cost of Capital / 12). For example, $300,000 in average receivables at 12% annual cost of capital equals $3,000 monthly or $36,000 annually. This cost should be factored into your unit economics – it’s a real cost of doing business that erodes your true margin.
What are the warning signs of a cash flow crisis?
Warning signs include: DSO (Days Sales Outstanding) increasing more than 3 days versus baseline, multiple buyers paying late simultaneously, credit utilization above 75%, cash reserves falling below 45 days of operating expenses, and return rates spiking above normal. Monitor these weekly. When any indicator hits yellow warning, investigate immediately.
How do I build a 13-week cash flow forecast?
Start with current cash position. Project inflows by client and payment timing certainty. Project outflows by category and billing date. Calculate ending cash for each of the next 13 weeks. Update weekly by adding a new week 13, updating actuals, and adjusting projections. Use scenario planning (base case, stress case, crisis case) to understand your vulnerability range.
Key Takeaways
-
The 60-day float requirement is not negotiable. Maintain cash reserves equal to sixty days of operating expenses plus media spend before scaling traffic. This is survival math, not conservative planning.
-
Payment timing mismatches are structural. Traffic platforms demand immediate payment while buyers operate on net-30 to net-45 cycles. This gap cannot be negotiated away – only funded or compressed.
-
Growth accelerates cash consumption, not profit. Every incremental dollar of traffic spend widens the gap between when you pay and when you collect. Success can bankrupt you without adequate capital.
-
Float has a real cost. Capital tied up in receivables costs 8-24% annually depending on your funding source. Include this cost in your unit economics or your true margins are lower than you think.
-
Working capital scales dramatically with volume. Under $50K monthly spend needs $100K-$150K reserves. $500K+ monthly spend requires $1.5M-$10M+ in working capital. Plan financing before reaching transition points.
-
Negotiate payment terms aggressively. Faster buyer payments and slower supplier payments compress your float requirement. A 2% early payment discount is cheaper than 12%+ annual capital cost.
-
Build credit facilities before you need them. The time to establish financing relationships is when your business is healthy, not when you’re in crisis. Lenders can smell desperation.
-
Cash flow management is daily discipline. Those who build sustainable lead generation businesses obsess over cash the way pilots obsess over altitude. They know their numbers. They see problems coming. They act before crisis forces action.
Statistics and financial benchmarks current as of late 2025. Specific rates, terms, and market conditions change continuously – verify current data before making financing decisions.