Understanding the complete supply chain that moves billions of dollars in consumer intent from capture to conversion.
Every lead that moves through the economy passes through multiple hands before reaching its final destination. A consumer fills out a form on a comparison website. That data hits a distribution platform within milliseconds, where it’s validated, scored, and routed to the highest bidder. The winning buyer – an insurance agent, mortgage broker, or solar installer – receives it in their CRM and makes contact within minutes.
This sequence involves at least a half-dozen distinct players, each taking a margin, adding value, and shouldering specific risks. Yet most people entering the lead generation industry see only fragments of this structure. They understand their own position but remain blind to the forces shaping their economics from above and below.
This blindness costs money. Negotiating with a buyer when you don’t understand their conversion economics means leaving margin on the table. Working with publishers when you can’t evaluate their traffic sources means absorbing fraud risk you didn’t know existed. Positioning your business at the wrong tier means fighting for scraps when you could be capturing the lion’s share.
This article maps the complete three-tier marketplace structure that defines the modern lead economy. You’ll understand the business models, incentives, and economics at each tier – and more importantly, you’ll identify which position fits your skills, capital, and risk tolerance.
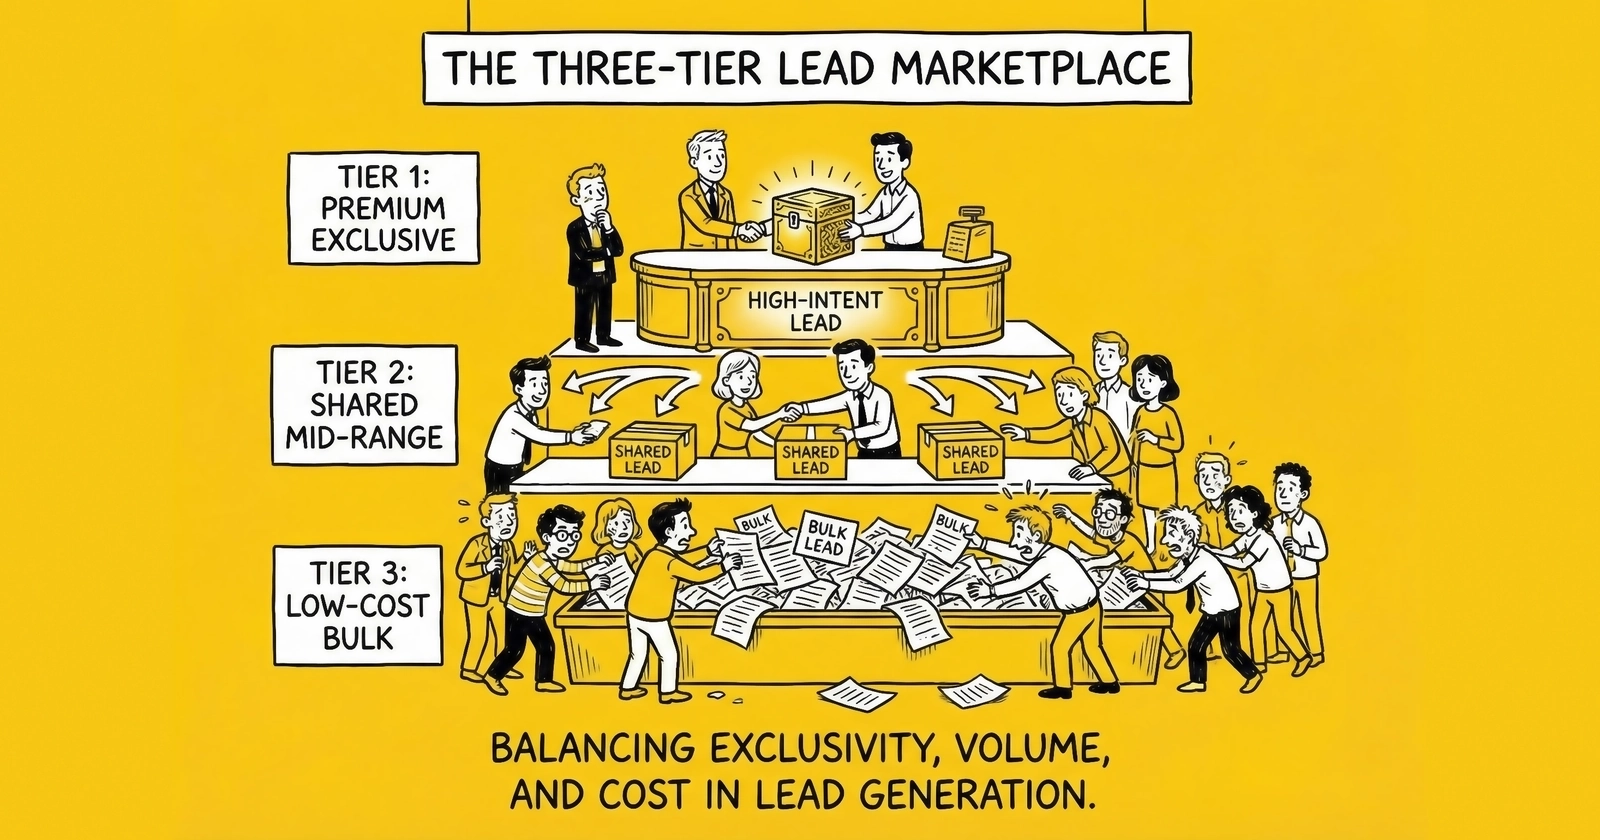
What Are the Three Tiers of the Lead Marketplace?
The lead marketplace operates across three distinct tiers, each with different functions, risk profiles, and margin structures:
Tier 1: Lead Generators (Publishers, Affiliates) create the raw material – consumer intent packaged as contact information with consent documentation. They control traffic sources, landing pages, and forms where consumers express interest.
Tier 2: Aggregators and Distributors (Brokers, Networks, Exchanges) sit in the middle, aggregating supply from multiple generators, routing leads to appropriate buyers, and adding value through quality filtering, compliance verification, and market-making.
Tier 3: Lead Buyers (Carriers, Lenders, Installers) consume leads at the end of the chain, converting them into customers, policies, installations, and retained clients. Their willingness to pay sets the entire market’s economics.
Value flows forward through these tiers – from raw traffic to qualified leads to closed customers. Money flows backward – from buyers through distributors to publishers. Understanding this bidirectional flow reveals where margins concentrate and where leverage exists.
Tier 1: Lead Generators (Publishers and Affiliates)
Lead generators sit at the top of the supply chain. They create the raw material that the entire ecosystem trades on. Without them, there are no leads to buy, sell, or convert.
What Lead Generators Actually Do
A lead generator (also called a publisher in affiliate marketing terminology) captures consumer interest and converts it into a tradeable asset. They own or control the traffic sources, landing pages, and forms where consumers express intent. Their core competency is marketing: finding people who want something and capturing their information efficiently.
The value they create is substantial. A consumer searching for auto insurance quotes has no relationship with any specific carrier. The publisher bridges that gap, turning anonymous search intent into an identified, contactable prospect with documented consent to receive communications.
Types of Lead Generators
Content Sites and SEO Publishers build websites optimized for organic search traffic. Sites like NerdWallet or Bankrate attract millions of visitors looking for financial product information, then monetize that traffic by capturing leads. Building SEO-driven lead generation requires significant content investment but delivers lower acquisition costs over time.
Comparison Engines let consumers input their information once and receive multiple quotes. LendingTree pioneered this model in 1998.
Affiliate Marketers run paid advertising campaigns on platforms like Google and Facebook, driving traffic to landing pages they control.
Call Centers generate leads through outbound calling or inbound response operations, often selling as “live transfers” to buyers who take the call in real-time.
How Lead Generators Make Money
Cost Per Lead (CPL): Fixed payment for each qualifying lead. Mortgage leads sell for $50-150; auto insurance leads range $25-75. Understanding CPL benchmarks across industries helps publishers price competitively.
Revenue Share: Publisher receives 10-20% of downstream conversion revenue. Aligns incentives but requires trust and tracking infrastructure.
Ping/Post Auction: Real-time bidding where multiple buyers compete for each lead. Maximizes revenue but requires technical sophistication.
What Makes Lead Generators Succeed
Successful publishers understand unit economics at a granular level – cost per click, conversion rate, and revenue per lead by source and campaign. Current Google Ads CPC averages $4.66 across industries, with average CPL of $70.11 in 2025 – up 5% year-over-year. Without this visibility, margin compression becomes invisible until it’s catastrophic.
Major Publishers by Revenue
MediaAlpha reported $864.7 million in revenue for 2024, up 123% year-over-year. EverQuote crossed $500.2 million, with their auto insurance vertical generating $446 million. LendingTree reported approximately $900 million in 2024, connecting 30 million borrowers with over 500 lenders. QuinStreet reported $613.5 million across education, financial services, and home services verticals.
Tier 2: Aggregators and Distributors (Brokers, Networks, and Exchanges)
Between publishers and end buyers sits a layer of intermediaries who aggregate supply, route leads to appropriate buyers, and add value through quality filtering and compliance verification.
Why the Distribution Layer Exists
Direct relationships don’t scale. A publisher generating 10,000 leads daily cannot maintain direct relationships with the hundreds of buyers who might want different slices of that inventory. Similarly, an insurance agent wanting 50 leads monthly doesn’t have the purchasing power to negotiate directly with major publishers. Aggregators solve this coordination problem.
The Three Distribution Models
Brokers purchase leads from publishers at one price and resell them to buyers at another, capturing the spread. They take ownership of the inventory, bearing the risk of returns and non-payment. A broker doing $500,000 monthly in lead purchases might need $750,000 or more in working capital to manage the timing mismatch between paying publishers (7-15 days) and collecting from buyers (net-30 or net-45).
Networks facilitate transactions between publishers and buyers, taking a percentage of each transaction as their fee. They provide technology, tracking, and payment infrastructure without taking inventory risk. Networks like CJ Affiliate and ShareASale give publishers access to multiple buyers through a single integration.
Exchanges operate real-time auctions where publishers offer leads and buyers bid for them, typically taking 5-15% of transaction value as a platform fee. The ping/post model powers most modern exchanges. A publisher “pings” the exchange with partial lead data. Multiple buyers respond with bids. The publisher then “posts” the full lead data to the winning bidder(s).
What Are Realistic Distributor Margin Benchmarks?
Aggregator margins vary by model and vertical, but the numbers are often less attractive than newcomers assume:
| Model | Typical Gross Margin | Typical Net Margin | Notes |
|---|---|---|---|
| Broker | 25-40% | 15-18% | Inventory risk, float cost, returns |
| Network | 10-20% | 8-15% | No inventory risk, relationship management |
| Exchange | 5-15% | 4-12% | Platform fee only, requires scale |
| Hybrid | 12-25% | 10-18% | Combination of broker and platform functions |
The gap between gross and net margins is where operators fail. Here’s the real math for a broker buying at $50 and selling at $70:
| Line Item | Amount |
|---|---|
| Gross Margin | $20.00 (28.6%) |
| Returns (12%) | -$6.00 |
| Float Cost | -$0.80 |
| Duplicates | -$1.50 |
| Bad Debt | -$1.00 |
| Processing | -$2.00 |
| Net Margin | $8.70 (12.4%) |
This is a healthy operation. Many brokers run tighter margins. The businesses that survive understand that gross margin is a vanity metric – only net margin pays bills.
Value-Added Services
Quality filtering removes fraudulent, duplicate, or non-contactable leads before they reach buyers. Effective lead validation including phone and email verification catches problems before delivery.
Compliance verification confirms leads have proper consent documentation. With TCPA litigation claiming average settlements of $6.6 million, consent documentation has become essential infrastructure.
Data enhancement appends demographic data, property records, and credit indicators that help buyers prioritize more effectively.
Tier 3: Lead Buyers (Carriers, Lenders, and Installers)
At the bottom of the supply chain sit the businesses that actually want to acquire customers. They convert leads into applications, policies, installations, and retained clients. Their willingness to pay sets the entire market’s economics.
Who Buys Leads?
Insurance Carriers and Agents represent the largest category. Progressive spent $3.5 billion on advertising in 2024 – a 186.8% year-over-year increase. Independent agents typically pay $25-75 per lead for auto insurance or $40-150 for Medicare supplements.
Mortgage Lenders and Brokers face intensely rate-sensitive economics. A mortgage lead costs $50-200 depending on loan type, credit quality, and geography. At 3-5% conversion and $3,000-8,000 average commission, the math can work spectacularly or fail entirely.
Solar Installers see dramatic geographic variation. Customer acquisition cost in California averages $1,929 per closed sale compared to $225 in North Dakota – an 8.5x spread. The complete guide to solar lead generation covers vertical-specific strategies.
Law Firms represent the highest-value buyers. A personal injury lead costs $200-500, but a single successful case can generate $50,000 or more in fees.
Home Service Providers make up a fragmented landscape – millions of small businesses with lead costs ranging $15-100 depending on service type.
How Buyers Evaluate Lead ROI
Understanding buyer economics is essential for anyone selling to them. Here’s how a typical insurance agent evaluates lead ROI:
Lead Investment: $50 per lead x 100 leads = $5,000 monthly spend
Conversion Funnel:
- Contact rate: 45% (45 conversations)
- Quote rate: 60% of contacts (27 quotes)
- Close rate: 25% of quotes (7 policies)
Revenue: 7 policies x $1,200 average annual premium x 12% commission = $1,008
First-Year ROI: $1,008 / $5,000 = 20.2% return
This looks terrible – until you factor in renewals. If that agent retains customers for an average of 5 years with trailing commissions, the lifetime value of those 7 customers might exceed $4,000. Suddenly the math works, but only with excellent retention.
Speed matters enormously. Studies show that leads contacted within one minute have 391% higher conversion rates. The first responder wins 78% of the time. These aren’t marginal improvements – they’re make-or-break economics. Building speed-to-lead response workflows should be every buyer’s priority.
CPL Benchmarks by Vertical
Lead prices vary dramatically by vertical, reflecting customer lifetime value, competitive intensity, and regulatory complexity:
| Vertical | Typical CPL Range | Premium Tier |
|---|---|---|
| Insurance | $25-75 | $100+ |
| Mortgage | $50-100 | $150+ |
| Solar | $75-150 | $200+ |
| Legal | $200-500 | $800+ |
| Home Services | $40-100 | $150+ |
Geographic variation adds another dimension. California solar leads command premiums that would be absurd in North Dakota. Florida auto insurance leads reflect the state’s high premiums and litigation environment.
How Value and Money Flow Through the Tiers
Value flows forward through the ecosystem: raw traffic becomes captured intent, captured intent becomes validated leads, and validated leads become converted customers. At each transition point, value is created – and margin is extracted.
Money flows backward – from buyers through distributors to publishers. Understanding this flow reveals where capital requirements concentrate and why cash flow management determines survival.
The Payment Timing Problem
The timing mismatch between payables and receivables creates the “float” that defines Tier 2 economics:
- Day 0: Lead captured and sold
- Day 7-15: Publisher must be paid
- Day 30-45: Buyer payment received
- Gap: 15-38 days of float per lead
This gap multiplies across volume. A broker processing 10,000 leads monthly at $50 each has $500,000 in monthly purchases. If they pay publishers at Day 15 and collect from buyers at Day 45, they’re financing a 30-day float on that entire volume:
| Monthly Volume | Working Capital Needed |
|---|---|
| 5,000 leads/month | $100,000-$150,000 |
| 10,000 leads/month | $150,000-$200,000 |
| 50,000 leads/month | $500,000-$750,000 |
| 100,000 leads/month | $1,000,000+ |
The 60-day float rule governs lead brokerage economics: you need approximately 60 days of working capital to operate safely. Undercapitalization is the most common cause of broker failure. The business looks profitable on paper while cash bleeds out to fund the receivables-payables gap.
Returns Compound the Problem
Returns flow backward too – but faster than money flows forward. A buyer rejects a lead on Day 3. The publisher already delivered. You already credited the buyer. Now you need to recover from the publisher or absorb the loss.
Industry average return rates run 8-15%. At 12% returns on $50 leads, you’re losing $6 per lead sold in return-related costs. Combined with the float gap, return timing can create acute cash crunches even in nominally profitable operations.
Where Do You Fit in the Ecosystem?
Before choosing a position, honestly assess your resources and capabilities against the requirements at each tier.
Capital Requirements by Tier
| Tier | Minimum Capital | Comfortable Capital |
|---|---|---|
| Publisher | $5,000-$25,000 | $50,000-$100,000 |
| Broker | $100,000-$200,000 | $500,000+ |
| Exchange/Network | $250,000-$500,000 | $1,000,000+ |
Publishers can start with less capital but face immediate traffic risk. Every dollar spent on ads must convert efficiently or it’s gone. Brokers need substantial working capital before the first lead flows. Exchanges require technology investment before generating revenue.
Skill Requirements by Tier
Publishers need: Traffic acquisition expertise (paid media, SEO, content), conversion optimization skills, technical implementation capability, rapid testing and iteration mindset.
Distributors need: Relationship management on both sides, operations and logistics capability, financial management and cash flow skills, quality monitoring and fraud detection.
Buyers need: Sales process optimization, speed-to-contact infrastructure, customer retention capability, vertical-specific expertise.
Choosing Your Position: Pros and Cons
Tier 1: Lead Generator/Publisher
Pros: Highest potential margins (can exceed 50% on optimized campaigns), direct control over traffic and quality, fastest path to initial revenue, no dependency on external relationships for core operations.
Cons: Immediate platform risk (Google, Facebook policy changes), traffic costs are sunk regardless of conversion, constant optimization pressure, compliance exposure at capture point.
Best fit for: Marketers with traffic acquisition skills, those who can tolerate daily variance, operators comfortable with technology and testing.
Tier 2: Distributor/Broker
Pros: Recurring revenue from established relationships, value creation through aggregation and routing, less platform dependency than publishers, higher barriers to entry protect position once established.
Cons: Significant working capital requirements, margin compression from both sides, return and bad debt risk, operationally complex with many moving parts.
Best fit for: Operators with relationship skills, those with access to capital, people who prefer steady operations over daily optimization battles.
Tier 3: Lead Buyer
Pros: Convert leads to actual customer relationships, build long-term asset value through retention, control final conversion experience, can optimize across multiple lead sources.
Cons: Must absorb lead quality variance, conversion economics are unforgiving, require sales infrastructure and personnel, dependent on upstream supply for growth.
Best fit for: Those with existing sales capabilities, vertical expertise, customer retention infrastructure, and desire to own the customer relationship.
Moving Between Tiers: Vertical Integration
Some operators pursue vertical integration, moving up or down the supply chain to capture more margin and control.
Integration succeeds when it leverages genuine synergies:
Volume justifies infrastructure: Building a distribution platform for 500 leads monthly makes no sense. For 50,000 monthly, the economics change.
Skill transfer is real: A publisher with strong tech capability can build distribution infrastructure. A broker with no marketing experience will struggle to generate traffic.
Control solves a real problem: If your biggest issue is lead quality, controlling generation solves it. If your biggest issue is buyer relationships, controlling generation doesn’t help.
Frequently Asked Questions
What is the lead generation marketplace?
The ecosystem where consumer intent – expressed through form submissions, phone calls, or other actions – gets captured, validated, and sold to businesses seeking customers. It operates across three tiers: publishers who generate leads, distributors who aggregate and route them, and buyers who convert them into customers. In 2024, major players like MediaAlpha ($864.7M revenue) and EverQuote ($500.2M revenue) demonstrated the scale of this marketplace.
What is the difference between a lead generator and a lead broker?
A lead generator (publisher) creates leads by running marketing campaigns, capturing consumer information through forms and landing pages, and documenting consent. They control traffic sources and bear traffic acquisition risk. A lead broker purchases leads from generators and resells them to buyers, capturing the spread. Brokers don’t generate traffic – they aggregate supply from multiple publishers and manage the logistics of matching supply with demand. Brokers bear inventory risk and float costs; publishers bear traffic risk and conversion risk.
How much capital do I need to start in lead generation?
Capital requirements vary dramatically by tier. Publishers can start with $5,000-$25,000 in traffic spend, though $50,000-$100,000 provides more comfortable runway for testing and optimization. Brokers need $100,000-$200,000 minimum to manage float (the gap between paying publishers and collecting from buyers), with $500,000+ recommended for stable operations. Exchanges and networks require $250,000-$1,000,000+ for platform development before generating meaningful revenue.
What margins can I expect as a lead broker?
Gross margins for brokers typically range 25-40%, but net margins after operational realities rarely exceed 15-18%. The gap is eaten by returns (typically 8-15% of leads), float costs, duplicate leakage, payment processing, and bad debt. A broker buying at $30 and selling at $50 might show $20 gross margin but only $8-9 net margin after all costs. Below 5,000 leads monthly, fixed costs eat most of that margin.
How do ping/post lead auctions work?
Ping/post is a two-stage distribution system. In the “ping” stage, partial lead information (without personally identifiable information like full phone numbers) goes to potential buyers who evaluate and bid on the lead. In the “post” stage, complete information goes only to the winning bidder(s). This model protects consumer data during evaluation, ensures buyers only pay for leads they explicitly want, and creates true price discovery through real-time auction dynamics.
What is the 60-day float rule in lead brokerage?
The 60-day float rule refers to the working capital needed to bridge the timing gap between paying suppliers and collecting from buyers. Publishers typically expect payment within 7-15 days. Buyers often pay on net-30 or net-45 terms. This creates a 15-38 day gap that must be funded with working capital. At volume, this gap requires substantial capital: a broker doing $500,000 monthly in lead purchases might need $750,000+ in working capital just to manage the float.
Which tier of the lead marketplace has the highest margins?
Publishers can achieve the highest margins (50%+ on well-optimized campaigns) but face the highest variance and immediate capital risk. Exchanges collect 5-15% platform fees with minimal risk but require massive scale. Brokers operate in the 15-18% net margin range with moderate risk. Buyers capture the largest absolute value through customer lifetime value but invest the most per acquisition. There’s no “best” tier – each involves different risk/reward tradeoffs.
How do I evaluate lead quality as a buyer?
Key quality metrics include: contact rate (percentage of leads you successfully reach – industry average is 40-60% for fresh leads), conversion rate (percentage converting to customers), return rate by source (track which publishers deliver leads that perform), and cost per acquisition (true cost to acquire a customer including all lead costs). Speed-to-contact dramatically affects quality perception – leads contacted within one minute convert at 391% higher rates than those contacted later.
What technology do I need to operate a lead distribution business?
Core technology requirements include: a lead distribution platform (boberdoo, LeadsPedia, Phonexa, or similar – starting at $450-$600/month), consent verification integration (TrustedForm, Jornaya), phone/email validation services, CRM for lead management, and reporting/analytics infrastructure. Budget 2-5% of revenue for platform infrastructure. The choice of platform depends on your model – high-volume ping/post operations often require boberdoo’s flexibility; call centers gravitate toward Phonexa’s telephony features.
How are major companies like MediaAlpha and EverQuote positioned in the marketplace?
MediaAlpha operates primarily as a Tier 2 exchange, running a real-time marketplace where publishers offer insurance leads and carriers/agents bid for them. They reported $864.7 million in 2024 revenue with transaction value exceeding $1.5 billion. EverQuote operates as both a Tier 1 publisher (generating leads through their own properties) and Tier 2 distributor, with $500.2 million in 2024 revenue. Both companies demonstrate how scale creates leverage.
What compliance risks exist at each tier of the marketplace?
All tiers face TCPA (Telephone Consumer Protection Act) exposure, with average settlements of $6.6 million. Publishers bear primary responsibility for consent capture and documentation – they must ensure forms have proper disclosures and generate verifiable consent certificates. Distributors must verify consent documentation before passing leads to buyers and maintain audit trails. Buyers bear ultimate calling liability – if they call a lead without proper consent, they’re exposed regardless of what the publisher claimed. All tiers should integrate with consent verification services like TrustedForm or Jornaya.
Key Takeaways
-
The three tiers serve distinct functions: Generators create leads through marketing, distributors aggregate and route them efficiently, and buyers convert them to customers. Each tier takes margin for genuine value creation.
-
Capital requirements vary dramatically: Publishers can start with $5,000-$25,000; brokers need $100,000-$500,000+ for float management; exchanges require $250,000-$1,000,000+ for platform development.
-
Net margin, not gross margin, determines survival: Broker gross margins of 25-40% compress to 15-18% net after returns, float costs, duplicates, bad debt, and processing. Many operations fail because they optimize for the wrong number.
-
The 60-day float rule is non-negotiable: The timing gap between paying publishers (7-15 days) and collecting from buyers (30-45 days) requires substantial working capital. Undercapitalization is the most common cause of broker failure.
-
Your position should match your skills and capital: Publishers need marketing expertise and traffic risk tolerance. Distributors need relationship skills and working capital. Buyers need sales infrastructure and vertical expertise. Choose based on honest self-assessment, not aspiration.
-
Power flows to those with options: Publishers with diversified traffic and buyers, distributors with strong relationships on both sides, and buyers with reliable payment histories all command better terms. Dependency – on a single platform, buyer, or source – is weakness.
-
Vertical integration works when synergies are real: Moving between tiers succeeds when volume justifies infrastructure, skills genuinely transfer, and control solves an actual problem. Integration fails when it’s just margin-chasing without operational capability.
Statistics and company revenue figures based on 2024 public filings and reported earnings. Traffic costs and CPL benchmarks reflect 2024-2025 industry data. Market structures and major players evolve continuously – verify current status before making significant business decisions.