Performance has a ceiling. Brand has a floor. The marketers who stop arguing about which is “real” stop losing money.
Why the brand-performance debate is back
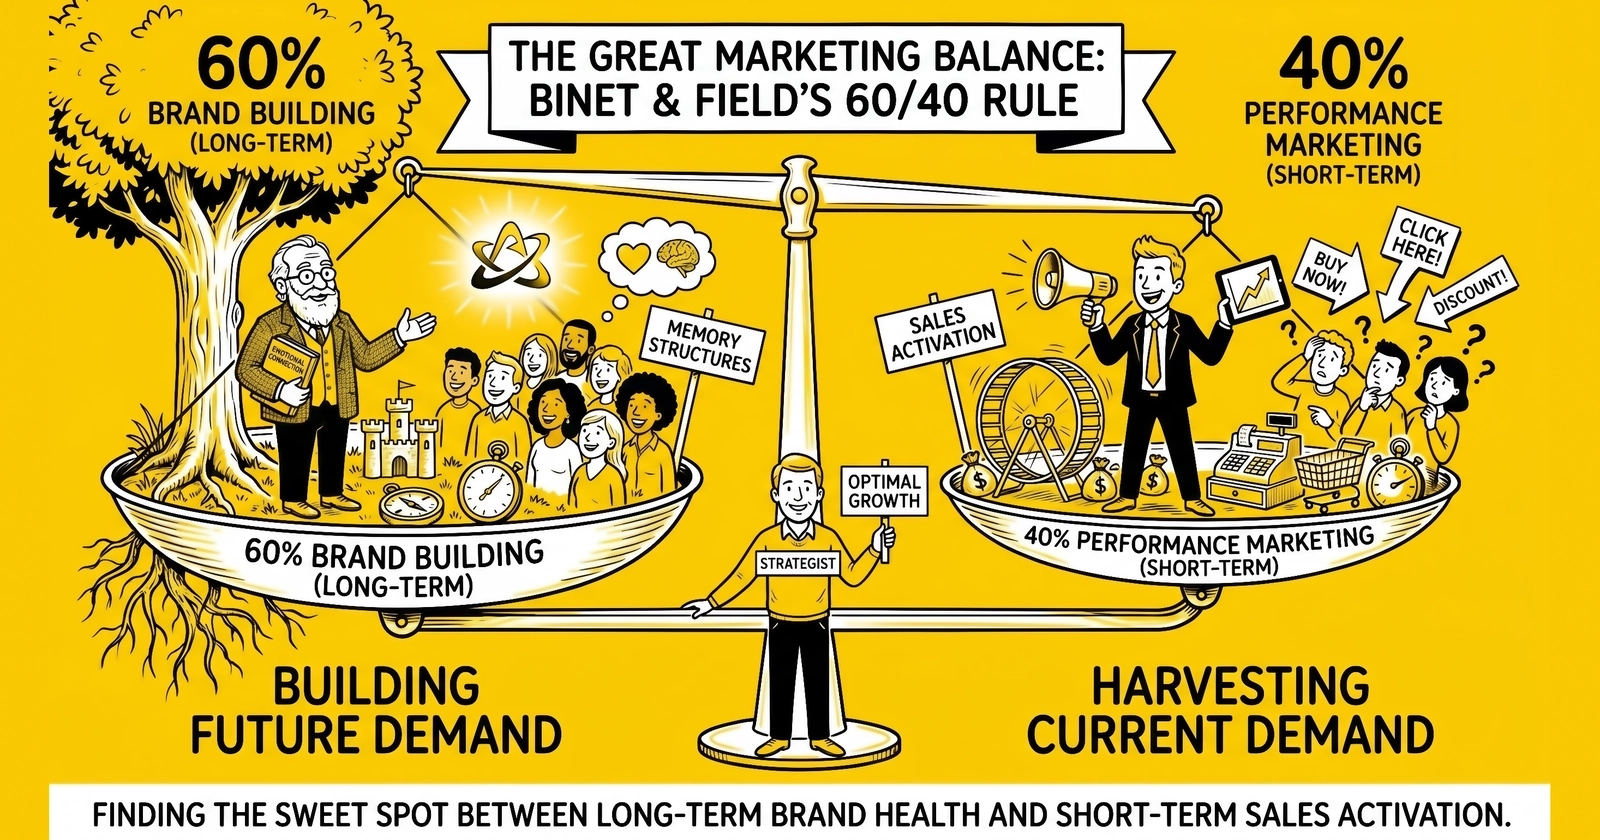
The brand-versus-performance argument should have died a decade ago. Les Binet and Peter Field published The Long and the Short of It in 2013 with data from 996 IPA Effectiveness Awards case studies covering 700 brands across 83 sectors and more than 30 years of measurement. The conclusion was unambiguous: consumer brands that grew long-term market share allocated roughly 60 percent of marketing spend to brand building and 40 percent to sales activation. Brands that pushed past 70 percent activation showed short-term gains and long-term decline.
The argument did not die. Instead, performance marketing won the budget war between 2014 and 2024, propelled by attribution dashboards, retargeting platforms, and the false confidence that every dollar could be measured to a click. WARC’s 2024 data captured the result: 68.8 percent of marketing budgets flowed to short-term performance tactics, up from 59.9 percent the prior year, while brand-building share fell to 31.2 percent. The market had inverted the 60/40 rule and convinced itself the inversion was progress.
Three forces reopened the debate in 2025 and 2026. The first is the structural inflation of customer acquisition costs. DTC ecommerce CAC climbed roughly 25 to 40 percent between 2021 and 2025, with some category benchmarks showing increases of 222 percent over an eight-year window. Google Ads CPCs rose 12.88 percent year over year. Meta’s March 2026 attribution update shifted the platform from auction-based placement optimization to outcome-based optimization and pushed CPMs up 15 to 40 percent across retail, lead gen, and ecommerce verticals. Performance buyers ran into the wall their measurement systems told them did not exist.
The second force is the AI Overviews compression event. Seer Interactive analyzed 3,100 queries between June 2024 and September 2025 and documented a 61 percent drop in organic click-through rates and a 68 percent drop in paid CTR for queries surfacing AI Overviews. The same study found brands cited within AI Overviews saw 35 percent higher organic CTR and 91 percent higher paid CTR. Citation depends on entity strength, brand recognition, and editorial authority – none of which performance budgets buy directly. The brands that win in AI-mediated search are the ones with mental availability already in the system.
The third force is the resurgence of marketing mix modeling. Meta’s Robyn open-sourced in 2023 and Google’s Meridian followed on January 29, 2025. Both libraries restored statistical visibility into the channels and time-lags that deterministic attribution had stopped measuring. When marketers finally re-introduced media-mix models to budgets that had been allocated by last-click for a decade, the lift estimates for brand-building media frequently outperformed the apparent efficiency of bottom-funnel channels. The performance-marketing dashboard had been telling a flattering story about the wrong question.
This analysis revisits Binet and Field’s framework with 2026 specifics: what brand actually means in an AI-search era, how the 95-5 rule reframes the conversation for B2B operators, and how lead-gen verticals – insurance, mortgage, solar, legal, and B2B SaaS – should adjust the canonical 60/40 split for their unit economics. The closing section is a 90-day reallocation playbook for operators who already suspect their performance-heavy allocation has stopped scaling.
The 60/40 rule’s research foundation
Binet and Field did not invent a theory and find data to support it. They examined the IPA Effectiveness Awards database, the largest peer-reviewed advertising effectiveness archive in the world, and looked for the spending pattern that correlated with sustained business outcomes. The dataset spanned 1980 to 2010 in the original analysis and now extends past 2020 in subsequent updates. Each case study was submitted by an agency, peer-reviewed by IPA judges, and required documented business outcomes – not media metrics.
The pattern that emerged was the 60/40 split. Brands that allocated approximately 60 percent of working media to brand-building campaigns – defined as broad-reach, emotion-led, low-targeting work designed to build memory structures – and approximately 40 percent to sales activation – defined as narrow-reach, rational, conversion-targeted work – outperformed alternative allocations across multiple business outcomes: market share growth, pricing power, profit margin, and reduced price elasticity. The follow-up Effectiveness in Context analysis refined the optimum to 62/38, confirming the original finding rather than displacing it.
The mechanism behind the split is asymmetric. Brand building creates long-term sales effects that compound over years; sales activation creates short-term sales effects that decay within weeks. A campaign that runs only activation produces a sharp sales spike followed by a return to baseline. A campaign that runs only brand building produces a slow accumulation of mental availability with limited short-term lift. The combined effect is non-linear: brand investment increases the elasticity of activation. Spend on activation in a high-brand-equity environment converts more efficiently than spend on activation in a low-brand-equity environment. The 60/40 ratio describes the equilibrium where the two effects amplify each other.
The data also documented the downside of imbalance. Pure-activation allocations – campaigns running 80 to 90 percent on conversion media – produced declining ROI over multi-year horizons. Pure-brand allocations – campaigns running 80 to 90 percent on awareness – failed to capture demand at the point of decision and underperformed the balanced split. Binet and Field’s later work with Mark Ritson reinforced the point: the question is not brand or performance but how the two combine, and the IPA dataset answers that question with a specific number.
The 60/40 split applies to consumer brands at scale. It is a statistical median, not a universal law. Categories with longer purchase cycles, higher consideration, or differentiated business models often optimize at different ratios. The next sections cover the three most consequential variations: B2B (the 95-5 reframing), lead generation verticals (where the lead is the conversion event), and DTC ecommerce post-iOS 14.5 (where attribution decay forced a structural rethink).
Why activation-only marketing breaks down
The mechanics are easy to observe in any account that has been running paid search and paid social for more than 24 months. The first six months show predictable returns. Audiences are fresh, creative is new, and conversion rates reflect genuine demand. By month 12, audience saturation begins. By month 18, creative fatigue and frequency capping force higher CPMs to maintain reach. By month 24, the operator is paying inflation-adjusted CPM increases of 30 to 50 percent for the same conversion volume – and the dashboard still reports “efficient” performance because last-click attribution credits whatever channel touched the buyer most recently.
The hidden cost is opportunity cost. The same dollars allocated to brand-building media – high-reach video, podcast sponsorships, category-defining content – would have created branded demand that compounds over time. Branded search queries grow. Direct traffic grows. The CTR of paid search ads on the brand’s own terms rises. The conversion rate of retargeting audiences improves because the audience already recognizes the brand. None of these outcomes show up in last-click attribution. They show up in marketing mix models, holdout tests, and the long-tail effect Binet and Field documented in the IPA dataset.
The 95-5 rule and B2B specifics
LinkedIn’s B2B Institute, led by Peter Weinberg and Jon Lombardo, refined Binet and Field’s framework for B2B marketers in 2021. The reframing came from Professor John Dawes at the Ehrenberg-Bass Institute, who calculated that at any given moment only about 5 percent of B2B buyers are in-market for a category – actively evaluating vendors and ready to purchase – while the remaining 95 percent are out-of-market and will not buy for months or years. Lombardo asked Dawes to formalize the analysis. The resulting paper, The 95-5 Rule, has become the most cited B2B marketing framework of the past five years.
The 95-5 rule does not contradict the 60/40 split. It explains the split. If 95 percent of buyers are out-of-market, then any marketing dollar spent on conversion media – gated content, lead magnets, sales-enablement retargeting – reaches at most 5 percent of the addressable category. The remaining 95 percent of buyers see those messages as irrelevant. The job of brand building is to make the brand familiar to the 95 percent so that when individual buyers transition into the 5 percent – when they get a new mandate, lose a vendor, or hit a budget cycle – the brand is already in their consideration set. Mental availability at the moment of category entry is the entire game.
Binet and Field’s own 2019 B2B research, conducted with the LinkedIn B2B Institute, refined the optimal split for B2B at roughly 46 percent brand and 54 percent activation. The shift toward activation reflects two B2B-specific dynamics: longer sales cycles allow activation media more time to convert, and account-based dynamics enable narrower targeting that improves activation efficiency. But the brand share remains substantial. B2B marketers who push brand below 30 percent see the same compounding decay observed in the consumer dataset.
The 95-5 framing has practical implications for B2B SaaS operators. The category’s dominant playbook for the past decade – gated content, MQL scoring, demand-gen retargeting – is a 100 percent activation strategy aimed at the 5 percent. It produces measurable pipeline in the short term and falling efficiency over multi-year horizons because the 95 percent never enters the funnel. Companies like HubSpot, Gong, and Drift broke from the playbook by investing in category-defining content, podcast sponsorships, and broad-reach awareness campaigns aimed explicitly at out-of-market buyers. The branded search lift those programs produce shows up in MMM analyses but not in last-click dashboards.
Why “lead gen” mislabels the B2B problem
A significant portion of the B2B SaaS market still measures marketing on cost-per-lead and pipeline-influenced revenue. Both metrics ignore the 95-5 rule by construction. A buyer who downloads a whitepaper today and converts in 18 months will be credited to whichever channel touched them in the final 90 days. The brand campaign that planted the memory structure 14 months earlier disappears from the attribution model entirely. The CFO sees a flat line on the brand campaign’s “leads” column and cuts the budget. The activation campaigns that capture the eventual conversion get the budget reallocation. The 95 percent shrinks. CAC rises. The cycle compounds.
The 95-5 rule does not eliminate lead generation. It reorders priorities. Lead generation captures the 5 percent who are in-market today. Brand building seeds the 95 percent who will be in-market over the next 24 to 60 months. Both functions matter. The error is funding only the first because only the first is measurable in a 30-day attribution window.
What “brand” actually means in 2026
The brand-performance debate often stalls on definitions. “Brand” has been used to mean logos, fonts, taglines, awareness percentages, NPS scores, and abstract emotional resonance. None of those definitions are useful for budget allocation. The operative definition, established by Byron Sharp’s How Brands Grow and the Ehrenberg-Bass Institute, is mechanical: a brand is the set of memory structures and distinctive assets that increase the probability of a buyer choosing it at the moment of category consideration. Brand building is the work of creating, refreshing, and reinforcing those memory structures.
Three components matter. First, mental availability – the probability that the brand is recalled when a buyer enters a category-buying situation. A solar customer searching for “solar installer near me” has dozens of options and limited consideration capacity. Brands with high mental availability surface in search behavior, click decisions, and final selection. Second, distinctive brand assets – the colors, sounds, characters, and visual codes that allow buyers to identify the brand instantly across channels. The Geico gecko is a distinctive asset. The State Farm jingle is a distinctive asset. Both reduce cognitive load at decision time. Third, category entry points – the situations, occasions, and need-states that trigger category consideration. Brands that have built associations with multiple entry points capture more demand than brands tied to a single trigger.
In 2026, mental availability faces a new test: AI-mediated search. When a buyer asks ChatGPT, Claude, Gemini, or Perplexity for solar installer recommendations, the model surfaces brands it can cite – brands with documented authority, entity strength in knowledge graphs, and editorial coverage. The brands that surface are the brands that already have brand equity. Performance marketing does not buy AI citation. Brand building does, indirectly, by creating the press coverage, third-party reviews, and category authority that AI systems retrieve as sources. Seer Interactive’s data quantifies the gap: cited brands see 35 percent higher organic CTR and 91 percent higher paid CTR than uncited brands on the same queries.
Share of search captures the measurable proxy. Les Binet introduced the metric at EffWorks Global 2020, defining it as the share of organic Google queries for a brand divided by total queries for all brands in its category. The data is free, available via Google Trends, and goes back to 2004 with weekly granularity. Binet’s research showed share of search predicts share of market with up to a 12-month lead in categories like automotive. When share of search rises, market share rises within a year. When share of search falls, market share falls. The metric is the cleanest available proxy for mental availability and has the additional benefit of being directly measurable in the same dashboard environment that performance marketers already use.
The 2026 update to mental availability is share of voice in AI citations. Seer Interactive recommends marketers stop optimizing primarily for organic traffic and start tracking how often their brand appears in AI Overviews, Perplexity results, and ChatGPT responses. The metric is harder to measure programmatically but follows the same mechanics: brands that build broad authority become the sources AI models cite. The brands that AI models cite become the brands buyers consider. The brands buyers consider win the 5 percent who are in-market at any given time.
Lead-gen vertical applications
Lead generation operates differently from consumer goods or B2B SaaS because the lead – not the purchase – is the conversion event. The buyer of the lead is a downstream advertiser; the seller of the lead is a publisher or aggregator. The 60/40 framework still applies, but the optimal split shifts based on whether the operator is a lead aggregator competing for consumer attention or a downstream advertiser buying leads from aggregators. Operators in the first position face a more concentrated brand-versus-performance trade-off than typical consumer brands. Operators in the second position behave more like B2B buyers and benefit from following the 46/54 B2B split.
The vertical-by-vertical recommended split is below. The numbers reflect observed allocations among top-quartile operators in each vertical, drawn from interviews and public earnings disclosures, and are intended as starting points for an MMM-driven optimization rather than fixed targets.
| Vertical | Recommended brand share | Recommended activation share | Primary brand channels | Primary activation channels |
|---|---|---|---|---|
| Auto and home insurance | 50% | 50% | TV, podcast, sports sponsorship | Paid search, comparison sites |
| Medicare and senior products | 35% | 65% | Direct response TV, broadcast | DRTV call campaigns, direct mail |
| Solar | 30% | 70% | Local TV, neighborhood canvassing brand | Paid social, lead-gen forms |
| Mortgage | 35% | 65% | Branded podcast, PR, refinance education | Paid search, comparison platforms |
| Legal (mass tort and PI) | 40% | 60% | DRTV brand, billboards, radio | Paid search, social pre-qualification |
| B2B SaaS | 46% | 54% | Category content, podcast, conferences | Paid search, ABM, retargeting |
| DTC ecommerce | 50% | 50% | Connected TV, podcast, creator content | Paid social, retargeting, email |
Insurance carriers have understood the 60/40 logic longer than most categories. Geico, Progressive, and State Farm spend heavily on broad-reach brand media – TV, sports sponsorship, and distinctive assets like the gecko, Flo, and Jake – because the category’s purchase trigger is unpredictable. A driver renewing an auto policy enters the market for a 30-day window and exits. The brand that maintained mental availability during the 11 prior months wins the renewal consideration. Activation media – paid search on “auto insurance quote” – captures the 5 percent who are actively shopping today. The carriers that under-invest in brand lose share to carriers that maintain it. Geico’s parent Berkshire Hathaway has documented over $2 billion in annual brand spending across carrier subsidiaries since 2018, a level no insurance lead aggregator has matched.
Solar and mortgage operators face a different equilibrium. Both categories have shorter consideration windows once a buyer enters the market – a homeowner deciding to install solar typically completes the decision within 60 to 120 days – and both have fragmented markets where no single brand commands the recognition that Geico holds in auto insurance. The optimal allocation skews toward activation because branded search volume is small relative to category search volume. But operators who push beyond 80 percent activation see the same diminishing returns documented in the IPA data: rising CPL, falling close rates, and worsening ratios of unique-to-shared leads. The 30 to 35 percent brand floor exists to maintain enough recognition that conversion media works at all. For deeper vertical context, operators can review the marketing mix modeling for lead generation framework that quantifies each channel’s incremental contribution.
Legal lead generation, particularly in mass tort and personal injury, is a special case. The category is dominated by direct-response television advertising that performs both brand and activation functions simultaneously. Morgan and Morgan, Sokolove Law, and Weitz and Luxenberg run DRTV creative that establishes mental availability – the firm name, the toll-free number, the legal category – while also driving immediate inbound calls. The blended creative makes pure-channel allocation harder to measure but does not eliminate the underlying logic. Firms that run only pay-per-call activation campaigns without the underlying DRTV brand support see steeper CPL inflation curves over multi-year periods. The most efficient operators allocate roughly 40 percent of media spend to broad-reach DRTV brand work and 60 percent to call-acquisition activation.
B2B SaaS operators following the LinkedIn B2B Institute’s research target the 46/54 split. The activation half typically includes paid search, account-based retargeting, and bottom-funnel content offers. The brand half increasingly takes the form of category-defining content programs, executive thought leadership, and high-production podcast or video series aimed at out-of-market buyers. Drift’s Conversation Cloud campaign, Gong’s Reveal podcast, and Salesforce’s Trailblazer programs all exemplify the pattern: the work is broad-reach, low-targeting, emotion-aware, and explicitly designed to plant memory structures with the 95 percent who are not buying today. Lead-buyer operators in B2B can complement the framework with the customer lifetime value framework for lead buyers that anchors brand investment in unit economics.
Ecommerce specifics: DTC brand-building post-iOS 14.5
Direct-to-consumer ecommerce ran the most extreme performance-only experiment in marketing history between 2014 and 2021. The combination of cheap Facebook CPMs, Shopify’s ease of setup, and venture funding optimized for short-term acquisition velocity produced thousands of brands that allocated 90 to 100 percent of media to performance channels. The model worked while ad auctions remained underpriced. It collapsed when Apple’s App Tracking Transparency framework rolled out with iOS 14.5 in April 2021 and removed the deterministic identifiers that had powered Meta’s targeting precision.
The collapse was specific. Meta’s CPM-based pricing meant the platform’s revenue per ad unit held roughly stable even as targeting accuracy declined. The cost was passed to advertisers as efficiency loss: the same CPM bought lower-intent audiences. CAC inflated 25 to 40 percent in the immediate aftermath, with some category benchmarks showing increases of 222 percent over the eight-year window from 2017 to 2025. DTC brands that had built businesses on a 1.5 to 2.0 ROAS performance model found their ROAS degrading toward 1.0 – the breakeven line below which the model is not viable.
The brands that survived diversified. Allbirds, Warby Parker, and Casper publicly disclosed shifts in marketing allocation toward connected TV, podcast sponsorships, and out-of-home – channels that build broad recognition without depending on deterministic identifiers. Glossier and Outdoor Voices invested in community-driven content and creator partnerships that produced both brand reach and first-party data. The brands that did not diversify – many of which had raised substantial venture capital on performance-marketing-only growth assumptions – either consolidated, sold at depressed multiples, or shut down. The pattern is well-documented in 2024 and 2025 retail bankruptcy data.
The 2026 DTC consensus has settled near a 50/50 split for established brands, with new brands often weighting toward activation in the first 12 to 18 months to establish initial demand and shifting toward brand investment as the customer base scales. The mechanics are the same as the IPA data predicts: a brand with no mental availability has no underlying demand, and performance media in that environment converts only the limited audience already familiar with the category – not the brand. Once the brand has built sufficient mental availability, performance media converts at higher rates because the audience recognizes the brand and bridges the consideration gap faster.
The post-iOS 14.5 measurement environment has accelerated the case for marketing mix modeling. Deterministic attribution lost the granularity that had made performance dashboards persuasive. Probabilistic models – Robyn, Meridian, and proprietary platforms from Measured, Recast, and Prescient AI – restored visibility into brand contribution, time-lag effects, and channel synergies. DTC operators running MMM analyses on 2022-2025 data have repeatedly found that connected TV, podcast, and influencer brand programs contributed materially to direct-traffic and branded-search lift that last-click had previously credited to “organic.” The reattribution has shifted budget allocations toward the 50/50 baseline. Operators evaluating multi-touch alternatives can review how first-touch versus last-touch attribution systematically misvalues brand-building activity.
The retention math that forces brand investment
A separate force pushing DTC toward brand allocation is retention. The math of acquiring a customer once, generating one purchase, and never seeing them again has stopped working at current CAC levels. Repeat-purchase rates of 30 to 40 percent, common in apparel and consumables categories, mean every percentage point of retention improvement is worth multiples of equivalent acquisition improvement. Brand-building media – the channels that create emotional connection, repeat the brand visually across contexts, and produce the kind of recognition that drives unprompted brand recall – increases retention rates measurably. Performance media, particularly retargeting, increases short-term conversion but does little to build the long-term brand equity that drives repurchase.
Measurement: how to allocate dollars and measure brand outcomes
The hardest part of operationalizing the 60/40 framework is measurement. Activation outcomes are easy to measure: clicks, leads, purchases, ROAS. Brand outcomes are harder: mental availability is invisible to last-click attribution, distinctive asset strength requires brand-tracking research, and category entry points require consumer survey data most operators do not collect. The 2026 measurement stack combines four layers: brand search lift, share of search, marketing mix modeling, and incrementality testing.
Brand search lift is the simplest. Branded search query volume – measured in Google Search Console, paid search reports for branded keywords, and Google Trends – responds directly to brand-building media. A connected TV campaign that runs for 12 weeks should produce a measurable increase in branded search volume that begins within two to four weeks and persists for several months after the campaign ends. The lift is observable, attributable, and difficult for performance dashboards to take credit for because the queries are unpaid or low-CPC paid clicks on the brand’s own name. Operators measuring brand search lift before, during, and after each brand-building campaign establish a feedback loop that other measurement methods extend.
Share of search extends brand search lift to competitive context. The metric is calculated as the brand’s organic Google search query volume divided by the total category query volume, typically pulled from Google Trends and normalized over a 12-month window. Binet’s research showed share of search predicts share of market with up to a 12-month lead in categories with measurable market share data. Operators can construct share-of-search dashboards using Google Trends data and update them weekly. Movements in share of search precede movements in revenue and provide a leading indicator that brand-building media is working.
Marketing mix modeling closes the loop. MMM uses statistical regression to estimate the incremental contribution of each marketing channel to a target outcome – revenue, leads, or new customer acquisition – controlling for seasonality, competitive activity, and external factors. The technique pre-dates digital marketing by 30 years but became newly relevant when iOS 14.5 degraded the deterministic alternatives. Meta’s Robyn and Google’s Meridian made the analysis accessible to mid-market operators who could not previously afford a $250,000 Nielsen MMM engagement. Operators running MMM on 24 months of channel-level spend and outcome data can quantify how much incremental revenue each channel produces, including the long-tail effects of brand-building media that show up over a 6 to 12 month horizon. The framework integrates with the multi-touch attribution analysis for lead generation when operators need both channel-level and journey-level visibility.
Incrementality testing validates MMM. The cleanest test is geographic or audience holdout: spend continues in some markets or audience segments while being paused in others, and the difference in outcomes is the incremental effect. The technique is straightforward for performance channels but harder for brand-building channels because the time horizons are longer and the markets must be matched on size and category dynamics. Operators running quarterly geo-holdout tests on connected TV, podcast, and out-of-home channels build a database of channel-level incrementality coefficients that calibrate the MMM and provide direct evidence of brand-channel ROI. The work is time-consuming but addresses the critique that brand spending cannot be measured.
The combined stack produces a decision framework. Each channel has a brand-building share and an activation share assigned by the operator’s understanding of the channel’s intended function. The MMM produces channel-level lift estimates with confidence intervals. The incrementality tests validate the lift estimates. Share of search and brand search lift provide leading indicators of brand-building effectiveness. The operator runs the system quarterly, reallocates 5 to 15 percentage points of budget per quarter based on observed results, and converges on the optimal split over 12 to 18 months. The endpoint is rarely exactly 60/40. It is usually within 10 percentage points of 60/40 for consumer brands and within 10 points of 46/54 for B2B brands, reflecting category-specific adjustments. The discipline is in the iteration, not the destination.
The brand-versus-performance characteristics matrix below summarizes the operational difference between the two functions. Operators using the matrix to classify channels and then verifying the classification with MMM and incrementality data avoid the categorization debate that derails most internal budget conversations.
| Dimension | Brand building | Performance / activation |
|---|---|---|
| Time horizon | 6-36 months | 0-90 days |
| Primary outcome | Mental availability, distinctive assets | Conversions, ROAS |
| Targeting breadth | Broad reach, low precision | Narrow, high-intent audiences |
| Creative style | Emotion-led, story-driven | Rational, offer-led |
| Measurement method | MMM, share of search, brand lift studies | Last-click, MMM, geo-holdout |
| Channel examples | TV, podcast, OOH, sponsorships, PR | Paid search, retargeting, direct mail |
| Effect on activation efficiency | Increases conversion rates downstream | Limited spillover to brand metrics |
| Decay rate | Slow, multi-year half-life | Fast, weeks to months |
| Optimal share (consumer) | 60% | 40% |
| Optimal share (B2B) | 46% | 54% |
The 90-day reallocation playbook
Operators who recognize their allocation has drifted past 70 percent activation often face an internal debate about how to move toward the 60/40 baseline without disrupting near-term pipeline. The 90-day reallocation playbook below has been used by mid-market operators in lead-gen, DTC, and B2B SaaS to move 10 to 15 percentage points of budget per quarter without measurable short-term revenue impact. The playbook proceeds in three 30-day phases.
Days 1 to 30: baseline measurement. The first phase establishes the measurement foundation that subsequent reallocations rely on. The operator pulls 24 months of spend and outcome data by channel, reconciles the data with finance, and builds a baseline MMM using Robyn, Meridian, or a proprietary tool. The output is a channel-level estimate of incremental contribution, time-lag, and saturation curve. Simultaneously, the operator builds a share-of-search dashboard from Google Trends data, identifies category competitors, and establishes a 12-month baseline. The operator also pulls branded search query volume for the brand and its top three competitors, normalizing for category seasonality. The phase produces three artifacts: an MMM with channel-level lift estimates, a share-of-search dashboard, and a branded-search-volume baseline.
Days 31 to 60: targeted reallocation. With the measurement foundation in place, the operator identifies the two or three performance channels with the lowest marginal ROI – typically the channels showing flat or declining efficiency over the prior six months – and reallocates 10 to 15 percentage points of budget into brand-building media. The reallocation prioritizes channels with measurable reach and demonstrable lift on branded search: connected TV is the most common starting point because Roku and Hulu provide household-level measurement and direct brand-search lift correlation. Podcast sponsorships, particularly in category-relevant shows with measurable promo-code uplift, are the second-most-common starting point. The operator does not eliminate performance channels; it shifts the marginal dollar from saturated performance to under-funded brand. The reallocation produces a measurable increase in CPM-equivalent reach and a near-term reduction in conversion volume that the operator must absorb without retreating.
Days 61 to 90: measurement and rebalancing. The third phase measures the impact of the reallocation. The operator pulls branded search volume, share of search, direct traffic, and assisted conversions on a weekly basis. The brand-building channels selected in days 31 to 60 should produce a measurable lift in at least one of those metrics within four to six weeks. If the lift materializes, the operator continues the reallocation in the next 90-day cycle, moving another 10 to 15 percentage points. If the lift fails to materialize, the operator investigates the channel selection – creative quality, reach delivery, audience match – and retests with a different channel mix. The phase concludes with an updated MMM run that incorporates the new channel mix and produces an updated forecast for the next quarter’s allocation.
The playbook’s most important feature is patience. Brand-building media has a long half-life by design, and the full effect of a reallocation often takes six to nine months to materialize in revenue. Operators who measure only the 30-day impact of a brand-building channel will conclude the channel does not work and revert to performance allocation. Operators who measure on a 90-day cadence with a 12-month MMM lookback will see the effect compound. The IPA dataset’s strongest finding is that the brands that outperform over multi-year horizons are the brands that maintained brand investment through quarters where the short-term metrics favored cutting it. The discipline to hold allocation through measurement noise is the durable competitive advantage.
The reallocation playbook has limits. Operators with severe cash constraints – runway under 12 months, declining revenue, or imminent debt obligations – should not reallocate budget toward channels with 6 to 9 month payback windows. Brand-building investment requires a balance sheet capable of absorbing the activation drop. Operators in that position should focus on improving activation efficiency through creative, audience refinement, and channel mix optimization until cash position supports a brand investment cycle. For operators evaluating positioning before launching brand campaigns, the brand archetypes for lead generation positioning framework establishes the strategic foundation that creative production then expresses.
Key Takeaways
- Binet and Field’s 60/40 brand-to-activation split, derived from 996 IPA Effectiveness Awards case studies, remains the empirical baseline for consumer brands optimizing long-term growth. WARC data shows the market inverted the rule between 2019 and 2024, allocating 68.8 percent to performance and 31.2 percent to brand by 2024, with documented declines in long-term effectiveness as a result.
- The LinkedIn B2B Institute’s 95-5 rule explains the 60/40 split by quantifying out-of-market buyers: at any moment 95 percent of B2B buyers are not buying, and brand spending exists to plant memory structures that surface when those buyers eventually enter the market.
- Binet and Field’s 2019 B2B research refined the optimal split to 46/54 brand-to-activation for B2B, accounting for longer sales cycles and account-based dynamics. B2B SaaS operators running below 30 percent brand allocation see the same long-term decay observed in consumer datasets.
- DTC ecommerce CAC inflated 25 to 40 percent between 2021 and 2025, with some benchmarks showing 222 percent increases over an eight-year window. Brands that diversified from performance-only allocations toward 50/50 brand-and-performance held CAC growth below category averages and survived the post-iOS 14.5 transition.
- AI Overviews compressed organic CTR by 61 percent and paid CTR by 68 percent across queries surfacing AI summaries, but brands cited within AI Overviews saw 35 percent higher organic CTR and 91 percent higher paid CTR. Citation depends on entity strength and brand authority – outcomes that brand investment produces upstream.
- Share of search, the metric Les Binet introduced at EffWorks Global 2020, is the cleanest available proxy for mental availability and predicts market share with up to a 12-month lead in measured categories. Operators can build share-of-search dashboards using free Google Trends data.
- The 2026 measurement stack combines brand search lift, share of search, marketing mix modeling using Meta Robyn or Google Meridian, and quarterly incrementality testing. The stack restores visibility into brand contribution that deterministic attribution lost after iOS 14.5.
- The 90-day reallocation playbook moves 10 to 15 percentage points of budget per quarter from saturated performance channels to under-funded brand channels, prioritizing connected TV and podcast as starting points. Most operators converge on the optimal split over 12 to 18 months and three to four reallocation cycles.
Frequently Asked Questions
What is the Binet and Field 60/40 rule?
The 60/40 rule is the empirical finding by Les Binet and Peter Field that consumer brands optimizing for long-term growth allocate roughly 60 percent of marketing spend to brand building and 40 percent to short-term sales activation. The split emerged from analysis of 996 IPA Effectiveness Awards case studies covering 700 brands across 83 sectors over more than 30 years. Subsequent updates refined the optimal split to 62/38 without changing the core conclusion.
Does the 60/40 split apply to B2B and lead generation?
Binet and Field’s 2019 B2B research found the optimal split inverts modestly: roughly 46 percent brand and 54 percent activation for B2B, accounting for longer sales cycles and account-based dynamics. For lead generation specifically, mature operators typically run 30 to 40 percent brand and 60 to 70 percent activation, weighted toward activation because the lead is the conversion event. Pure-performance allocations below 20 percent brand show declining efficiency past 18 months.
What is the 95-5 rule and how does it relate to the 60/40 framework?
The 95-5 rule, popularized by LinkedIn’s B2B Institute and Professor John Dawes of the Ehrenberg-Bass Institute, holds that only about 5 percent of B2B buyers are in-market at any given time while 95 percent are out-of-market and will not buy for months or years. The rule reframes brand spending as the work of priming the 95 percent so the brand surfaces in memory when buyers eventually enter the market. It reinforces the 60/40 split rather than replacing it.
How has rising CAC changed the brand-performance balance in 2026?
Customer acquisition costs increased roughly 25 to 40 percent across DTC ecommerce between 2021 and 2025, with Google Ads CPCs rising 12.88 percent year over year and Meta CPMs jumping 15 to 40 percent following the March 2026 attribution update. Pure performance buyers face compounding diminishing returns: every additional dollar buys fewer conversions because branded demand is not being created upstream. The math of brand investment improves as performance ceilings tighten because branded demand reduces the unit economics burden on activation channels.
How do AI Overviews affect the case for brand building?
Seer Interactive analyzed 3,100 queries between June 2024 and September 2025 and found AI Overviews compressed organic click-through rates by 61 percent and paid CTR by 68 percent overall. But brands cited within AI Overviews saw 35 percent higher organic CTR and 91 percent higher paid CTR. Citation in AI summaries depends on brand recognition, source authority, and entity strength – all of which are upstream brand-building outcomes, not performance outcomes.
What is share of search and how is it measured?
Share of search is the share of organic Google queries for a brand divided by total queries for all brands in its category, typically measured via Google Trends. Les Binet introduced the metric at EffWorks Global 2020 as a fast, free, and predictive proxy for market share. In categories like automotive, share of search leads share of market by up to 12 months: when brand searches rise, market share rises, and the inverse holds. Operators can construct share-of-search dashboards using free Google Trends data and update them weekly.
How should ecommerce brands allocate budget post-iOS 14.5?
DTC operators who held performance-heavy allocations through 2022 to 2024 saw CAC inflate 222 percent over the prior eight years according to industry benchmarks. Brands that shifted to roughly 50/50 brand-and-performance, invested in first-party data, and built direct-traffic and email channels held CAC growth below category averages. The current consensus among DTC strategists places the optimal split between 50/50 and 60/40 brand-weighted, depending on category maturity and brand age.
What is the 90-day reallocation playbook for moving toward 60/40?
The playbook proceeds in three 30-day phases. Days 1 to 30 establish baseline measurement: brand search volume, share of search, and a marketing-mix model run on the prior 24 months of data. Days 31 to 60 reallocate 10 to 15 percentage points from saturated performance channels into brand-building media, prioritizing high-reach video, audio, and category-defining content. Days 61 to 90 measure brand search lift, direct traffic, and assisted conversions, then rebalance based on observed elasticity. Most operators reach the optimal split over three to four iterations across 12 months.
Sources
- The Long and the Short of It: Les Binet and Peter Field (IPA, 2013)
- The Next Chapter for The Long and the Short of It (IPA Blog)
- The 95-5 Rule (LinkedIn B2B Institute)
- The 95:5 Rule is the New 60:40 Rule, Peter Weinberg and Jon Lombardo (Marketing Week, 2021)
- Performance Budgets Rise at Expense of Brand (WARC, 2024)
- The Multiplier Effect Report (Bain and WARC, 2025)
- How AI Overviews Are Impacting CTR: Five Initial Takeaways (Seer Interactive, September 2025)
- Share of Search as a Predictive Measure: Les Binet at EffWorks Global 2020 (IPA)
- Binet and Field B2B Marketing Research (The Drum, 2019)
- Voice of the Marketer 2025: Optimism Returns (WARC)