Where you put your money matters more than how you optimize it. An 80/20 allocation split beats a 50/50 split with perfect optimization. This guide provides the framework for allocating budget across channels, reallocating based on performance, and building a sustainable testing practice.
Allocation Determines Outcomes More Than Optimization
You can be a world-class optimizer and still fail.
I’ve watched operators obsess over ad copy variations, landing page tweaks, and bid adjustments while their budget allocation remained static for months. They’d improve conversion rates by 15% on a channel receiving 10% of spend. Net impact: 1.5% overall improvement.
Meanwhile, a competitor moved 20% of budget from an underperforming channel to their best performer. No sophisticated optimization required. Immediate 12% lift in overall lead volume at the same total spend.
Budget allocation is a strategic decision. Optimization is tactical. Strategic decisions compound. Tactical decisions increment.
The math is straightforward: a 10% improvement in how you allocate budget produces larger gains than a 10% improvement in any single channel’s performance. Yet most practitioners spend 80% of their time on optimization and 20% on allocation.
This article inverts that ratio. You’ll learn how to build a channel portfolio, evaluate channel economics beyond surface metrics, establish starting allocations, reallocate based on performance data, maintain a testing budget, adjust for seasonality, kill underperformers, and build a sustainable reallocation cadence. For the measurement foundation, see our guide on blended vs channel ROI analysis.
By the end, you’ll have a framework that treats budget allocation as the strategic lever it is.
The Channel Portfolio Approach
Thinking Like an Investor
A portfolio approach to channel allocation borrows from investment management: diversification, risk-adjusted returns, and correlation management.
Diversification means spreading budget across multiple channels to reduce catastrophic risk. A single-channel operator faces existential threat when that channel changes policies, increases costs, or degrades performance. Google Ads policy changes have eliminated entire businesses overnight. Facebook algorithm shifts have cut lead volume 50% in days. Those who survived had alternatives ready.
Risk-adjusted returns means evaluating channels not just by their average performance but by their volatility. A channel delivering $50 CPL with 40% monthly variance is riskier than a channel delivering $55 CPL with 10% variance. The $55 channel may be worth more budget because you can plan around it. Predictability has value.
Correlation management means understanding how channels perform relative to each other. Channels that perform well simultaneously provide less diversification than channels that counterbalance each other. Paid search and paid social often move together (both affected by consumer sentiment). SEO and paid search often move inversely (when paid costs rise, organic becomes more valuable).
The Three-Tier Channel Structure
Build your channel portfolio in three tiers, each serving a distinct purpose in your overall strategy.
Tier 1: Foundation Channels
Foundation channels should receive 50-60% of your budget. These are your proven performers with three or more months of consistent data, delivering CPL within 15% of target. They offer scale potential matching your volume needs while maintaining low month-over-month variance – typically under 20%. Foundation channels form the backbone of your operation, generating reliable results you can count on.
Tier 2: Growth Channels
Growth channels warrant 25-35% of budget. These show promising performance but have less data – typically one to three months of testing completed. Their CPL falls within 30% of target, and they’ve demonstrated scaling potential even with moderate variance in the 20-40% range. Growth channels represent your near-term expansion opportunities.
Tier 3: Testing Channels
Reserve 10-15% for testing channels where you explore new opportunities and run hypothesis-driven experiments. It’s acceptable to lose money in this tier – you’re buying learning, not leads. Define success criteria before spending begins, and limit timeframes to four to eight weeks per test. The discoveries here feed tomorrow’s foundation.
The 50-60/25-35/10-15 split provides enough concentration to drive current results while maintaining optionality for the future.
Portfolio Risk Quantification
Beyond qualitative diversification, sophisticated operators quantify portfolio risk using metrics borrowed from investment management. This mathematical approach transforms allocation from intuition to precision.
Channel Variance Calculation. For each channel, calculate the standard deviation of monthly CPL over 6-12 months. A channel averaging $50 CPL with $5 standard deviation (10% variance) is fundamentally different from one averaging $50 CPL with $15 standard deviation (30% variance). The latter requires larger margin buffers and more conservative allocation.
Correlation Coefficients. Calculate pairwise correlation between channel CPLs over time. Channels with correlation coefficients above 0.7 provide limited diversification benefit – when one underperforms, the other likely does too. Negative correlations (below -0.3) indicate true hedging value. Most lead generation channels correlate positively (0.3-0.6 typical) because they respond to similar macroeconomic factors, but finding uncorrelated sources provides genuine portfolio protection.
Value at Risk (VaR) Framework. Borrow from financial risk management to estimate worst-case scenarios. At a 95% confidence level, what is your maximum expected portfolio CPL in a bad month? This calculation combines individual channel variance with correlation data to produce a single risk metric. Operators targeting $60 CPL with 95% VaR of $75 know their downside exposure; those without this calculation are flying blind.
Sharpe Ratio for Channels. Adapt the investment Sharpe ratio to evaluate risk-adjusted returns by channel. The formula divides excess return (margin above baseline) by margin variance. A channel delivering 25% margin with 5% variance outranks one delivering 30% margin with 15% variance on risk-adjusted basis. This counterintuitive result guides allocation toward stable performers rather than volatile high-fliers.
Channel Correlation Matrix Development
Building a correlation matrix requires historical data discipline but pays dividends in allocation precision.
Data Collection Requirements. Capture weekly CPL, conversion rate, and margin by channel for minimum 26 weeks. Shorter periods produce unreliable correlations; longer periods capture more seasonality but may include structural changes that distort relationships.
Calculation Process. For each channel pair, calculate Pearson correlation coefficient on weekly CPL data. Organize results in a matrix format showing how each channel relates to every other.
| Channel Pair | Correlation | Implication |
|---|---|---|
| Google Search / Facebook | 0.45 | Moderate positive – some hedging value |
| Google Search / Native | 0.62 | High positive – limited diversification |
| Facebook / Email | 0.12 | Near-zero – strong diversification |
| Native / Programmatic | 0.71 | High positive – essentially same risk |
| Google Search / SEO | -0.28 | Negative – true hedge relationship |
Interpretation for Allocation. When correlations run high, reduce combined allocation to correlated channels below what individual performance metrics suggest. When correlations run low or negative, allocate more aggressively because risk genuinely diversifies. A portfolio of four channels with average correlation of 0.3 carries substantially less risk than four channels with average correlation of 0.7.
How Many Channels Should You Run?
For most lead generation operations, four to seven channels represents the practical maximum for meaningful allocation and optimization.
Below four channels, you lack diversification. A single channel failure represents 25% or more of your business – an existential risk. Above seven channels, attention fragments. Each channel receives insufficient focus to optimize properly. You’re spreading budget without spreading meaningful effort.
The sweet spot depends on team size. One campaign manager can effectively run three to four channels. Add a channel for each additional team member.
Evaluating Channel Economics
Beyond Surface CPC and CPL
CPC (cost per click) and CPL (cost per lead) are starting points, not endpoints.
Two channels with identical $75 CPL can have dramatically different true economics. Consider Channel A with $75 CPL, 8% return rate, 65% contact rate, and 30-day buyer payment versus Channel B with $75 CPL, 18% return rate, 45% contact rate, and 45-day buyer payment. Channel A’s true CPL after returns comes to $81.52. Channel B’s true CPL after returns reaches $91.46. That’s $10 per lead difference invisible in dashboard metrics.
The Complete Channel Evaluation Framework
Understanding true channel economics requires evaluating four distinct metric categories that work together to reveal actual performance.
Acquisition Metrics
Acquisition metrics capture what you pay to generate leads. CPC measures what you pay for traffic, while conversion rate shows the percentage of traffic that becomes leads. Surface CPL – CPC divided by conversion rate – gives you the headline number. Cost per qualified lead adjusts surface CPL for validation failures, showing what you actually pay for usable leads.
Quality Metrics
Quality metrics reveal what happens after acquisition. Return rate shows what percentage of leads buyers reject. Contact rate indicates what percentage of leads answer or respond. Conversion to sale measures what percentage of contacted leads purchase. Source-adjusted CPL – surface CPL divided by one minus return rate – shows your true acquisition cost.
Operational Metrics
Operational metrics determine channel capacity and behavior. Lead velocity measures time from click to lead delivery. Volume capacity defines maximum leads per day, week, or month. Volume floor establishes minimum viable spend before efficiency degrades. Scaling elasticity reveals how CPL changes as volume increases.
Financial Metrics
Financial metrics connect channel performance to cash flow. Payment terms show when traffic sources require payment. Revenue timing indicates when buyers pay for leads. Working capital requirement calculates the float needed to run the channel. Margin contribution captures revenue minus all channel-specific costs.
CPC and CPL Benchmarks by Channel
Understanding benchmark ranges helps set realistic expectations, though actual performance varies significantly by vertical, geography, and competitive intensity.
Google Search Ads carry CPC ranging from $2 to $15, varying dramatically by vertical. Insurance keywords run $8-45 CPC, legal keywords $15-85 CPC, home services $3-12 CPC, and mortgage $5-25 CPC. Average conversion rates fall between 3-8%, resulting in CPL anywhere from $40 to $300 or more depending on vertical.
Facebook/Meta Ads operate at lower CPC of $0.80-3.50 with average conversion rates of 2-6%, producing CPL in the $20-100 range. Expect higher variance than search, though Facebook performs stronger for awareness and consideration stages of the buyer journey.
Native Advertising through platforms like Taboola and Outbrain offers low CPC of $0.30-1.50 but conversion rates of just 0.3-1.5%, yielding CPL of $25-100. High volume is available, though quality varies widely and requires aggressive content optimization.
Programmatic Display runs on CPM ranging from $2-15, translating to effective CPC of $0.20-0.80. Conversion rates of 0.2-1% produce CPL between $25-150. Success requires sophisticated targeting and frequency management.
SEO/Organic has no direct CPC. Calculate CPL by dividing monthly SEO investment by monthly organic leads. Typical ranges fall at $15-60 CPL for established programs, though expect a 6-12 month ramp-up period. High upfront investment yields low marginal cost at scale.
Quality Differences by Channel
Not all leads are created equal. Channel quality manifests in post-acquisition metrics that reshape your true economics.
Contact rate averages vary dramatically by channel: Google Search leads answer at 55-70%, Facebook Lead Ads at 40-55%, native at 35-50%, display at 30-45%, and purchased lists at just 15-30%.
Return rate averages follow a similar pattern: Google Search sees 8-12% returns, Facebook 12-18%, native 15-22%, display 18-28%, and purchased lists 25-40%.
These quality differences reshape true CPL calculations in surprising ways. A $50 CPL from Google Search with 10% returns equals $55.56 effective CPL. A $40 CPL from native with 20% returns equals $50.00 effective CPL. Native appears $10 cheaper on the dashboard but delivers identical effective economics.
Scale Potential Assessment
Scale potential determines whether a channel can absorb additional budget productively. Before increasing spend, answer five critical questions: What’s the current daily or weekly spend? What’s the estimated ceiling before CPL degrades? What’s the CPL elasticity – meaning the percentage CPL increase per percentage spend increase? Are there audience exhaustion signals like frequency or reach caps? What’s the competitive intensity and auction pressure?
The answers place channels into four categories. High scale channels can absorb 3-5x current spend with under 15% CPL increase. Moderate scale channels handle 2-3x current spend with 15-30% CPL increase. Limited scale channels support under 2x current spend before significant CPL degradation. Capped channels are already at or near maximum efficient spend.
Google Search typically offers limited scale due to finite query volume. Facebook offers moderate scale as audience targeting can expand. Display and native offer high scale given the vast inventory available.
Mathematical Allocation Models
Moving beyond rules of thumb requires mathematical frameworks that optimize allocation based on defined objectives. These models transform allocation from art to engineering.
Mean-Variance Optimization
Borrowed from modern portfolio theory, mean-variance optimization finds the allocation that maximizes expected return for a given risk level, or minimizes risk for a given return target.
Inputs Required. The model needs expected margin per channel (based on historical data and forward projections), margin variance per channel (standard deviation of historical margins), and a correlation matrix between channels.
Optimization Process. The algorithm tests thousands of allocation combinations, calculating portfolio expected return and portfolio variance for each. The result is an efficient frontier – the set of allocations where no reallocation can improve return without increasing risk.
Practical Application. Rather than asking “how should I split my budget?” ask “what allocation maximizes my expected margin given I cannot tolerate more than 15% variance?” The mathematical answer often differs substantially from intuitive splits.
Limitations for Lead Gen. The model assumes normal distributions and stable correlations – assumptions that break during market disruptions. Use outputs as guidance rather than prescription, and stress-test allocations against non-normal scenarios.
Kelly Criterion Adaptation
The Kelly Criterion, originally developed for gambling, determines optimal bet sizing to maximize long-term growth. Adapted for channel allocation, it provides aggressive but mathematically optimal allocation guidance.
The Formula. Kelly fraction equals (probability of win multiplied by win amount minus probability of loss multiplied by loss amount) divided by win amount. For lead generation, “win” means meeting margin targets and “loss” means failing to meet targets.
Channel Application. Calculate each channel’s Kelly fraction based on historical hit rate (months meeting target) and average margin when hitting versus missing. Allocate proportionally to Kelly fractions.
Conservative Adjustment. Full Kelly allocation is mathematically optimal but volatile. Most practitioners use “half Kelly” or “quarter Kelly” to reduce variance at the cost of some expected return. For lead generation, half Kelly typically balances growth with stability.
Constrained Optimization Models
Real-world allocation faces constraints that pure mathematical models ignore. Constrained optimization incorporates these realities.
Common Constraints. Minimum spend per channel (algorithm training requirements), maximum spend per channel (scale limits), maximum concentration in any single channel, minimum testing budget allocation, and seasonal adjustment requirements.
Solver Approach. Define your objective function (maximize margin, minimize variance, or a weighted combination), specify constraints, and use optimization software to find the best feasible allocation. Excel Solver handles simple cases; Python’s scipy.optimize or dedicated tools handle complex scenarios.
Iterative Refinement. Run optimization monthly with updated inputs. Track how recommended allocations change over time. Persistent recommendations to shift budget in a particular direction indicate sustained performance differentials.
Attribution-Weighted Allocation
Attribution data should inform allocation, but last-touch attribution systematically biases toward conversion channels while undervaluing awareness channels.
Attribution Model Selection. Data-driven attribution models (available in Google Analytics 4 and advanced MMM platforms) weight touchpoints based on actual contribution to conversion. These models reveal awareness channels that influence journeys attributed to search.
Incremental Testing Integration. Geographic holdout tests measure true channel incrementality by comparing conversion rates in markets with and without channel presence. Incrementality data corrects attribution bias.
Allocation Adjustment. Weight channel allocation by incrementally-adjusted contribution rather than last-touch attribution. A channel showing 15% of last-touch conversions but 25% of incremental lift deserves allocation proportional to its true contribution.
Cross-Channel Effects. Some channels amplify others. Facebook awareness may increase branded search volume. Native content may improve social ad performance through remarketing. Build allocation models that account for these interaction effects rather than treating channels as independent.
Starting Allocation for New Campaigns
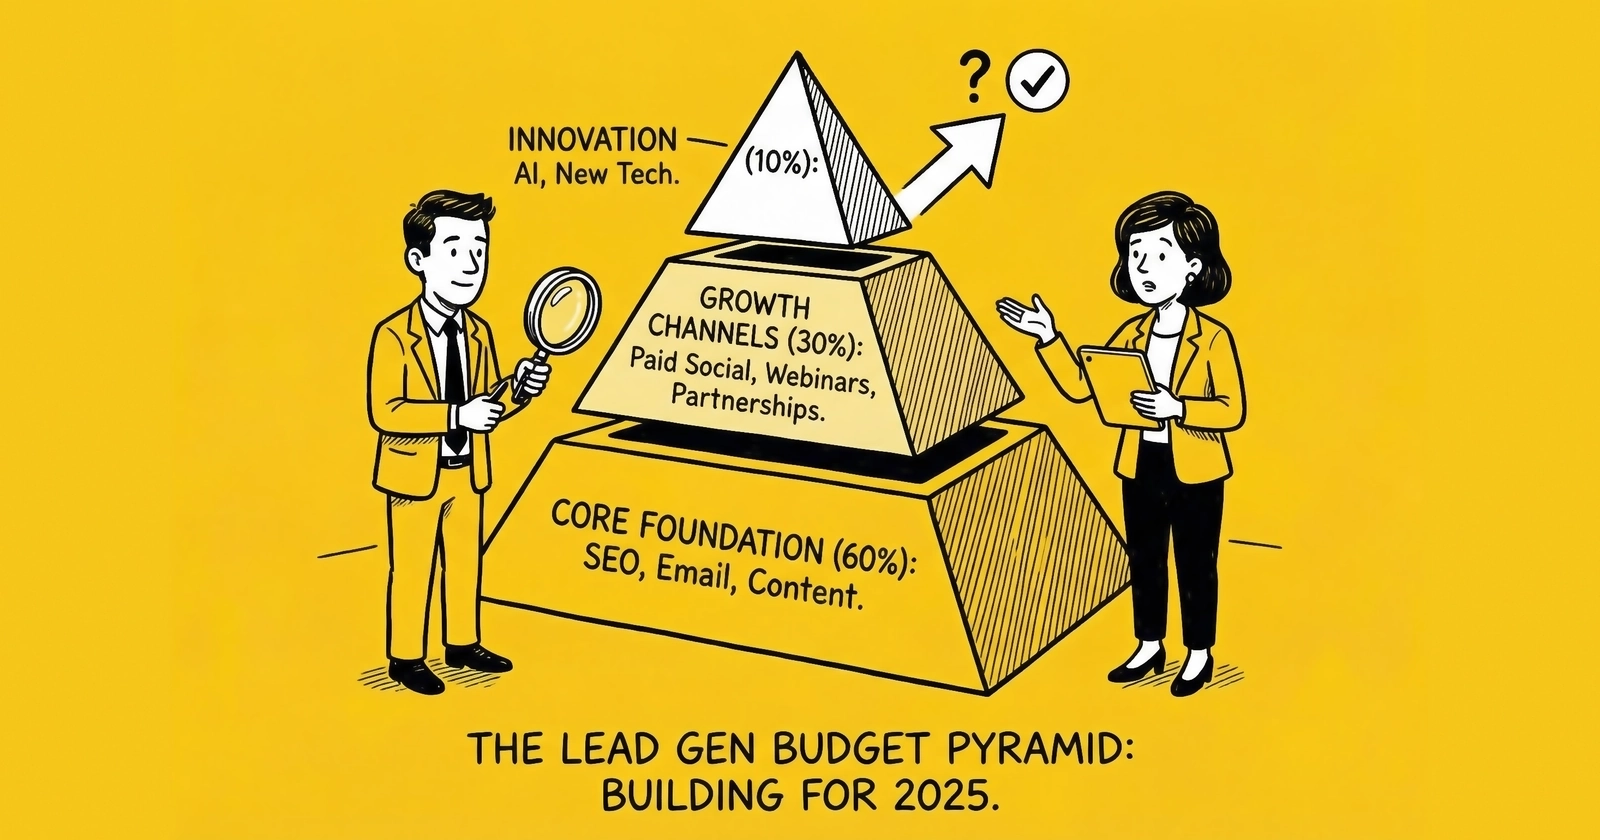
The 60/30/10 Initial Framework
For new lead generation campaigns without historical data, start with a conservative allocation designed to prioritize learning while maintaining viable economics.
Allocate 60% to lowest-risk channels including Google Search for high intent, proven referral sources, and channels with predictable CPL ranges. Put 30% toward moderate-risk channels such as Facebook/Meta with broader targeting, native advertising for content-driven acquisition, and industry-specific platforms. Reserve 10% for exploratory channels covering new platforms, experimental targeting, and hypothesis testing.
This allocation prioritizes learning while maintaining viable economics during the learning period.
Vertical-Specific Starting Points
Different verticals favor different channel mixes based on buyer intent patterns.
Insurance (Auto, Home, Health) typically allocates Google Search at 40-50%, Facebook/Meta at 20-30%, native at 10-20%, comparison sites at 10-15%, and display at 5-10%.
Mortgage/Home Finance leans heavily on Google Search at 45-55%, with Facebook/Meta at 15-25%, native at 10-15%, financial publisher partnerships at 10-15%, and display at 5-10%.
Solar/Home Improvement spreads more evenly: Google Search at 30-40%, Facebook/Meta at 25-35%, native at 15-20%, local platforms like Nextdoor at 10-15%, and display at 5-10%.
Legal Services concentrates on search with Google at 50-60%, legal-specific platforms at 15-25%, Facebook/Meta at 10-20%, native at 5-10%, and display at 5%.
Home Services diversifies across Google Search at 35-45%, Google Local Services Ads at 20-25%, Facebook/Meta at 15-25%, home services marketplaces at 10-15%, and display at 5%.
Minimum Viable Budget Per Channel
Every channel has a minimum spend threshold below which data is meaningless. Monthly minimums vary by platform: Google Search requires $3,000-5,000, Facebook/Meta needs $2,000-4,000, native requires $1,500-3,000, display needs $2,000-4,000, and new platform testing requires $2,000-3,000.
Below these thresholds, you can’t generate enough conversions for statistical significance. You’re guessing, not deciding.
If your total budget is $10,000 per month, running five channels at $2,000 each produces noise, not data. Better to run two to three channels well than five channels poorly.
How Long Before Adjusting Initial Allocation?
Allow minimum four weeks for statistical confidence. Ideal is six to eight weeks to understand variance.
Shorter periods capture noise, not signal. You might catch a good week or bad week and misattribute it to channel performance. Longer periods delay necessary adjustments. If a channel is clearly underperforming after four weeks, waiting twelve weeks wastes budget.
Reallocation Based on Performance Data
When to Reallocate
Reallocation triggers fall into three categories, each warranting different responses.
Performance triggers activate when channel CPL exceeds target by 25% or more for two or more weeks, when channel CPL underperforms other channels by 30% or more for two or more weeks, when return rate exceeds acceptable threshold (typically 20%), or when contact rate drops below viable floor (typically 40%).
Opportunity triggers emerge when a channel demonstrates better-than-expected performance, when competitive dynamics shift through competitor exit or cost drops, or when seasonality creates temporary advantages.
Risk triggers fire when platform policy changes threaten channel viability, when a single channel exceeds 70% of total budget creating concentration risk, or when quality degradation signals appear such as fraud or bot traffic.
The Reallocation Decision Framework
When a trigger activates, work through a structured decision process.
Step 1 validates the signal. Ask whether this is a trend spanning two or more weeks or merely a fluctuation. Consider whether external factors changed such as competition or seasonality. Verify the data is statistically significant before acting.
Step 2 identifies reallocation candidates. Determine which channels have capacity to absorb additional budget, which channels are underutilizing current budget, and what the expected CPL impact of reallocation would be.
Step 3 sizes the reallocation. Small reallocations move 5-10% of total budget. Medium reallocations move 10-20%. Large reallocations exceed 20%. Default to small reallocations – large moves require high-confidence signals.
Step 4 defines success criteria. Specify what outcome justifies the reallocation, over what timeframe you’ll evaluate results, and what would trigger a reversal.
The Marginal CPL Problem
Average CPL hides marginal CPL. The first $5,000 in a channel produces different economics than the next $5,000.
Consider a Google Search scaling curve:
| Spend Level | Leads | CPL | Marginal CPL |
|---|---|---|---|
| $5,000 | 100 | $50 | $50 |
| $10,000 | 185 | $54 | $59 |
| $15,000 | 255 | $59 | $71 |
| $20,000 | 310 | $65 | $91 |
The marginal CPL of the fourth $5,000 is $91 – nearly double the average $65 CPL.
If your target CPL is $70, you should stop at $15,000 even though the average CPL ($59) appears acceptable. Every dollar past $15,000 acquires leads above target.
Track marginal CPL, not just average CPL. Reallocate when marginal CPL exceeds target, not when average CPL does.
How Much Should You Reallocate at Once?
Reallocate 10-15% of total budget as a default. Never more than 25% in a single move without exceptional circumstances.
The exception: a channel fails catastrophically through policy ban, fraud detection, or vendor bankruptcy. In that case, reallocate 100% of that channel’s budget immediately to proven alternatives.
The Testing Budget: Always Keep 10-15%
Why Testing Budget Is Non-Negotiable
Your best channel today was unknown two years ago. Your best channel two years from now is currently in your testing queue – or should be.
A permanent testing allocation of 10-15% of total budget funds discovery of future winners. Without it, you’re optimizing a declining portfolio.
Structuring Tests
Divide testing budget into discrete experiments with defined parameters. Each test needs a budget of $2,000-5,000, a duration of four to eight weeks, a specific and measurable hypothesis, success criteria defined before the test begins, and kill criteria specifying conditions that trigger early termination.
The number of active tests scales with total budget. At $30,000 monthly, run one to two active tests. At $75,000 monthly, run two to three. At $150,000 or more monthly, run three to four.
Test Outcomes
Tests produce one of three outcomes, each requiring a different response.
Graduate to Tier 2 when the test meets success criteria. Increase budget 2-3x and continue monitoring for 30-60 days before considering Tier 1 promotion. Document what worked for future reference.
Continue testing when results are inconclusive. Modify one variable and run another four to six week cycle. Common modifications include audience targeting, creative messaging, landing page, or bid strategy. Limit to two continuation cycles before declaring failure.
Terminate when the test fails kill criteria. Document learnings thoroughly – what didn’t work is as valuable as what did. Do not revisit for six or more months unless market circumstances change significantly.
What to Test
Prioritize tests by expected value and strategic importance.
High priority tests target channels where competitors invest heavily, platform features that access new audiences, and adjacent channels to current winners such as moving from Google Search to YouTube.
Medium priority tests explore targeting variations within known channels, geographic expansion, and creative format experiments.
Low priority tests investigate unproven platforms with limited track records and channels far outside your vertical’s typical mix.
When Should You Kill a Test Early?
Kill a test early when continuing produces negative expected value. Valid kill signals include CPL exceeding kill threshold for two or more consecutive weeks, fraud or quality indicators like bot traffic or impossible user journeys, platform instability or policy risk, and clear evidence the hypothesis was wrong.
However, don’t kill tests for a single bad week (variance happens), CPL slightly above target (tests explore rather than optimize), or slow ramp (some channels require a learning period).
Seasonal Adjustment Strategies
Patterns by Vertical
Seasonal patterns create predictable opportunities and challenges that vary significantly across verticals.
Insurance (Auto, Home, Health) peaks in Q4 during open enrollment and Q1 with new year activity, then troughs during summer months of July and August. CPL variance between peak and trough runs 20-40%.
Mortgage peaks in spring from March through May and early fall from September through October, with troughs during winter holidays. CPL variance reaches 25-50% depending on the rate environment.
Solar peaks late spring through summer from April to September and troughs in winter, especially November through February in northern states. CPL variance spans 30-60% seasonally.
Home Services peaks in spring and early fall with troughs during winter holidays and mid-summer. CPL variance runs 20-35% seasonally.
Legal shows less seasonality than other verticals with minor peaks in the new year and post-tax season. CPL variance stays relatively modest at 10-20%.
The Adjustment Framework
Effective seasonal adjustment follows a three-step process. First, review 12 or more months of historical performance and calculate seasonal indices for each channel. Second, apply seasonal indices to baseline budget and plan shifts 30-60 days before transitions. Third, monitor actual versus expected performance, adjust in real-time, and document variances for future planning.
Budget Shift Mechanics
Seasonal adjustments should shift budget between channels, not just total spend up or down.
During peak seasons, channels with higher scale potential like Facebook and display often receive larger share to capture increased volume. During off-seasons, higher-intent channels like search receive larger share to maximize quality when volume is constrained.
Should You Cut Budget During Slow Seasons?
Maintain reduced presence at 20-40% reduction rather than cutting entirely. This approach protects you in several ways.
Algorithms require continuous data for optimization, and pausing destroys learned intelligence. Competitor retreat during troughs creates lower-cost opportunities for those who stay. Restarting campaigns costs time and money through learning periods and algorithm re-training. Those who maintain presence through slow periods often find lower CPLs from reduced competition and faster ramp when volume returns.
When to Kill Underperforming Channels
Distinguishing Underperformance from Variance
Before killing a channel, determine whether you’re seeing normal variance or structural underperformance.
Variance shows a random pattern of up, down, up, down. It reverts to mean over four to eight weeks. No underlying cause can be identified – it’s just normal fluctuation.
Structural underperformance displays a directional pattern of consistent worsening. It does not revert over six to eight weeks. An identifiable cause exists such as competition, policy changes, or audience exhaustion.
Kill Thresholds
Establish clear thresholds that trigger kill decisions. A CPL threshold kills when channel CPL exceeds target by 50% for four or more consecutive weeks despite intervention. A quality threshold kills when return rate exceeds 30% for four or more consecutive weeks. A scale threshold kills when the channel cannot deliver minimum viable volume. An ROI threshold kills when contribution margin is negative for six or more weeks.
The Kill Process
Execute channel termination over a structured timeline.
Week 1: Reduce budget 50%. Continue monitoring performance. Begin reallocating budget to proven alternatives. Document the decision and reasoning.
Week 2: Reduce to zero and pause all campaigns. Complete reallocation to other channels. Archive campaigns rather than deleting them – you may need historical data.
Weeks 3-4: Track any residual lead flow. Document what didn’t work. Update institutional knowledge for future reference.
6-month review: Revisit the channel to assess if market conditions changed. Consider a new pilot test if dynamics have shifted. Don’t restart without a clear hypothesis for why results would differ this time.
Should You Kill a Channel That Used to Work?
Past performance creates bias toward continuation. Apply the same kill criteria regardless of history.
Historical success doesn’t justify current losses.
Building a Reallocation Cadence
Weekly Review
Set aside 30-60 minutes weekly to review channel CPL versus target for both current week and four-week trend, lead volume, return rates, and testing utilization. Most weeks produce no action. Some weeks flag minor adjustments. Occasionally an urgent adjustment is required.
Monthly Reallocation Meeting
Block 60-90 minutes monthly with a structured agenda: performance review versus target (20 minutes), reallocation decisions (20 minutes), test portfolio review (15 minutes), forward planning (15 minutes), and documentation (10 minutes).
Quarterly Strategy Review
Quarterly reviews ask bigger questions: Is channel mix aligned with 12-month goals? Are we over-concentrated in any single channel? What should enter testing? The output includes an updated 90-day plan, revised testing priorities, and adjusted CPL targets.
How Do You Prevent Analysis Paralysis?
Set default actions for common scenarios that remove the need for debate. When CPL runs 10-25% above target for two weeks, review at monthly meeting. When CPL runs 25-50% above for two weeks, reduce budget 10-15%. When CPL exceeds 50% above for two weeks, reduce 25% or more and prepare kill decision. When a test meets success criteria, graduate to Tier 2 and increase budget 2x. When a test hits kill criteria, terminate immediately.
Predefined rules reduce cognitive load and prevent endless debate.
Advanced Reallocation Strategies
Beyond reactive reallocation based on performance triggers, sophisticated operators implement proactive strategies that anticipate rather than respond to market changes.
Predictive Reallocation Models
Historical performance data enables forward-looking allocation adjustments before performance declines materialize.
Leading Indicator Development. Identify metrics that predict future performance. Rising CPCs without conversion rate change often precedes margin compression by 2-4 weeks. Declining impression share signals competitive pressure before CPL impact. Audience frequency increases precede saturation-driven performance drops. Build monitoring dashboards around leading indicators, not just lagging performance metrics.
Regression-Based Forecasting. Train regression models on historical data to predict next-month channel performance based on current signals. Include variables like current CPL trends, competitive metrics, seasonal patterns, and cross-channel interactions. Use forecasts to adjust allocation before actual performance degrades.
Scenario Planning. Develop contingency allocations for predictable scenarios: competitor entry, platform policy changes, seasonal shifts, economic downturn. When scenarios materialize, execute pre-planned allocation adjustments rather than scrambling reactively. The speed advantage from prepared responses often determines competitive outcomes.
Automated Reallocation Systems
At sufficient scale, automated reallocation outperforms manual management by responding faster and eliminating emotional bias.
Rule-Based Automation. Define programmatic rules that trigger allocation shifts. When Channel A’s 7-day rolling CPL exceeds Channel B’s by 20% or more, shift 10% of A’s budget to B. When any channel’s return rate exceeds 15%, reduce allocation by 25% pending investigation. When testing channel meets success criteria for 14 consecutive days, graduate 2x budget to growth tier.
Optimization API Integration. Platforms like Google Ads offer automated budget optimization across campaigns. Facebook’s Campaign Budget Optimization dynamically shifts spend to best-performing ad sets. Integrate these platform capabilities while maintaining strategic oversight on cross-platform allocation.
Guardrail Implementation. Automated systems require guardrails: maximum single-day reallocation limits, minimum channel floors that cannot be breached, alert thresholds that trigger human review, and override capabilities for exceptional circumstances. Automation without guardrails produces volatile allocation that destabilizes campaigns.
Portfolio Rebalancing Discipline
Like investment portfolios, channel allocation drifts from targets as differential performance changes relative weights. Systematic rebalancing maintains intended allocation structure.
Drift Monitoring. Track actual allocation versus target allocation weekly. Calculate drift magnitude as the sum of absolute deviations from target percentages. When aggregate drift exceeds 10 percentage points, rebalancing is warranted.
Threshold-Based Rebalancing. Rebalance when any single channel deviates more than 5 percentage points from target allocation. This approach triggers rebalancing only when drift becomes material, avoiding excessive trading from minor fluctuations.
Calendar-Based Rebalancing. Regardless of drift magnitude, rebalance to target allocation monthly or quarterly. This approach ensures regular return to strategic allocation while accommodating performance-driven drift between rebalancing dates.
Rebalancing Trade-offs. Rebalancing toward underperforming channels that drifted below target allocation feels counterintuitive – you are reducing investment in winners to fund losers. But systematic rebalancing enforces buy-low-sell-high discipline. Channels that underperformed may be positioned for mean reversion, while channels that outperformed may be approaching saturation.
Competitive Response Allocation
Allocation cannot be optimized in isolation from competitive dynamics. Competitor behavior creates opportunities and threats that require allocation response.
Competitive Intelligence Gathering. Monitor competitor spend patterns through auction insights, ad library research, and third-party intelligence tools. Track when competitors increase or decrease investment in specific channels.
Opportunity Exploitation. When competitors retreat from a channel (visible through declining auction pressure and CPC reductions), consider increasing allocation to capture share at lower cost. Competitor departure often reflects their specific issues rather than fundamental channel problems.
Defensive Allocation. When competitors increase investment in your core channels (visible through rising CPCs and declining impression share), evaluate defensive responses. Matching increased investment maintains share but at compressed margins. Strategic retreat to more defensible channels may preserve profitability. Neither response is universally correct; analysis of relative competitive advantages should guide the decision.
First-Mover Versus Fast-Follower. Some operators lead into emerging channels, accepting higher learning costs for first-mover advantages. Others follow, benefiting from pioneers’ learnings but accepting reduced upside. Your competitive strategy should inform testing budget allocation and graduation speed for emerging channels.
Frequently Asked Questions
What’s the ideal channel mix for a new operation? Start with two to three proven channels. Allocate 70-80% to highest-intent channel (typically paid search) and 20-30% to supporting channels. Avoid five or more channels until you have $50,000 or more monthly spend.
Should I allocate more to lower CPL or higher volume potential? Marginal CPL matters most. Allocate until marginal CPL reaches target, then shift to other channels. Volume without margin is activity, not profit.
How do I handle a channel that performs well but can’t scale? Keep it at efficient capacity. A $10,000 per month channel at $40 CPL is valuable even if it can’t absorb $50,000. Use it as foundation while scaling others.
When should I consolidate versus diversify? Consolidate under $30,000 monthly budget or when fewer than three channels clearly outperform. Diversify above $50,000, when any channel exceeds 60% of spend, or when approaching ceiling.
How do I account for different buyer payment terms? Factor timing into working capital. Faster-paying buyers require less float. If capital is constrained, favor faster payment even at slightly lower prices.
Should testing budget scale with total budget? Yes, but not linearly. Maintain 10-15% up to $100,000 monthly. Above that, 8-12% is acceptable. Never drop below 8%.
How do I allocate across multiple verticals? Treat each vertical as separate portfolio. Performance metrics stay vertical-specific. Avoid subsidizing underperformers with profitable ones.
What’s the right brand versus performance balance? For lead generation, allocate 85-95% to direct response and 5-15% to brand. Treat brand spend as part of testing budget unless you have attribution confidence.
How frequently should I completely restructure allocation? Quarterly at most. Monthly reallocations should move 10-15%. Quarterly can move 20-30%. Complete restructuring of 50% or more should occur only for major shifts or disruptions.
How do I evaluate channels with no historical data? Use industry benchmarks while expecting 20-40% underperformance initially. Gather competitor intelligence and run controlled $2,000-5,000 pilots with predefined success criteria.
Key Takeaways
-
Allocation trumps optimization. Moving budget between channels produces larger gains than optimizing any single channel. Spend 50% of strategic time on allocation decisions.
-
Build a three-tier portfolio. Foundation (50-60%), growth (25-35%), and testing (10-15%) balance current performance with future optionality.
-
Evaluate on effective CPL, not surface CPL. Return rates, contact rates, and quality metrics reshape true economics. Two channels with identical dashboard CPL can have 20% different true costs.
-
Set reallocation triggers before you need them. Define thresholds for CPL, return rates, and quality that activate decisions. Predefined rules prevent emotional decision-making.
-
Never drop below 10% testing budget. Your future best channel is currently unknown. Continuous testing maintains optionality.
-
Kill underperformers decisively. A channel that can’t meet targets after 6-8 weeks of intervention deserves termination. Historical success doesn’t justify current losses.
-
Build a reallocation cadence. Weekly monitoring, monthly meetings, quarterly reviews. Consistent process prevents both neglect and overreaction.
-
Seasonal adjustment is allocation, not just budget. Shift both total spend and channel mix. Different channels perform better in different seasons.
Sources
- Investopedia: Modern Portfolio Theory - Foundation for mean-variance optimization and diversification concepts applied to channel allocation
- Investopedia: Kelly Criterion - Mathematical framework for optimal sizing adapted from gambling to marketing budget allocation
- Investopedia: Sharpe Ratio - Risk-adjusted return measurement methodology applied to channel performance evaluation
- Investopedia: Value at Risk (VaR) - Risk quantification framework for measuring portfolio downside exposure
- Meta Ads Learning Phase - Official documentation on Facebook’s 50 conversions per week optimization threshold
- Taboola - Native advertising platform with publisher network and content discovery benchmarks
- Outbrain - Native advertising network providing industry performance data
Statistics based on 2024-2025 industry data from WordStream, HubSpot, and lead generation industry surveys. Channel performance varies by vertical, geography, and competitive dynamics. Validate benchmarks against your market conditions.