
Every allocation decision produces two outcomes: the direct effect of where the money went, and the indirect effect of where the money did not go.
Moving $10,000 from Source B to Source A does not only buy more leads from Source A. It reduces the signal volume that Source B’s algorithms need to optimize, slows the learning that might have improved Source B’s performance, and potentially strains supplier relationships by reducing volume below their minimum commitments. The decision is not reversible at zero cost.
This creates a real tension in channel portfolio management: acting too quickly destroys learning before it can produce results; acting too slowly bleeds margin on channels that have conclusively failed. Most operations resolve this tension in the wrong direction – they tolerate underperformance too long because cutting feels risky, then make dramatic reallocation decisions when the pain becomes acute enough to force action.
This guide provides the decision frameworks for navigating that tension: what signals indicate a new channel is ready to receive more investment, what signals indicate an underperforming channel has failed conclusively, what concentration thresholds create excessive dependency, and how to structure a reallocation cadence that generates the data needed for decisions without creating algorithmic instability.
The Allocation Decision Framework
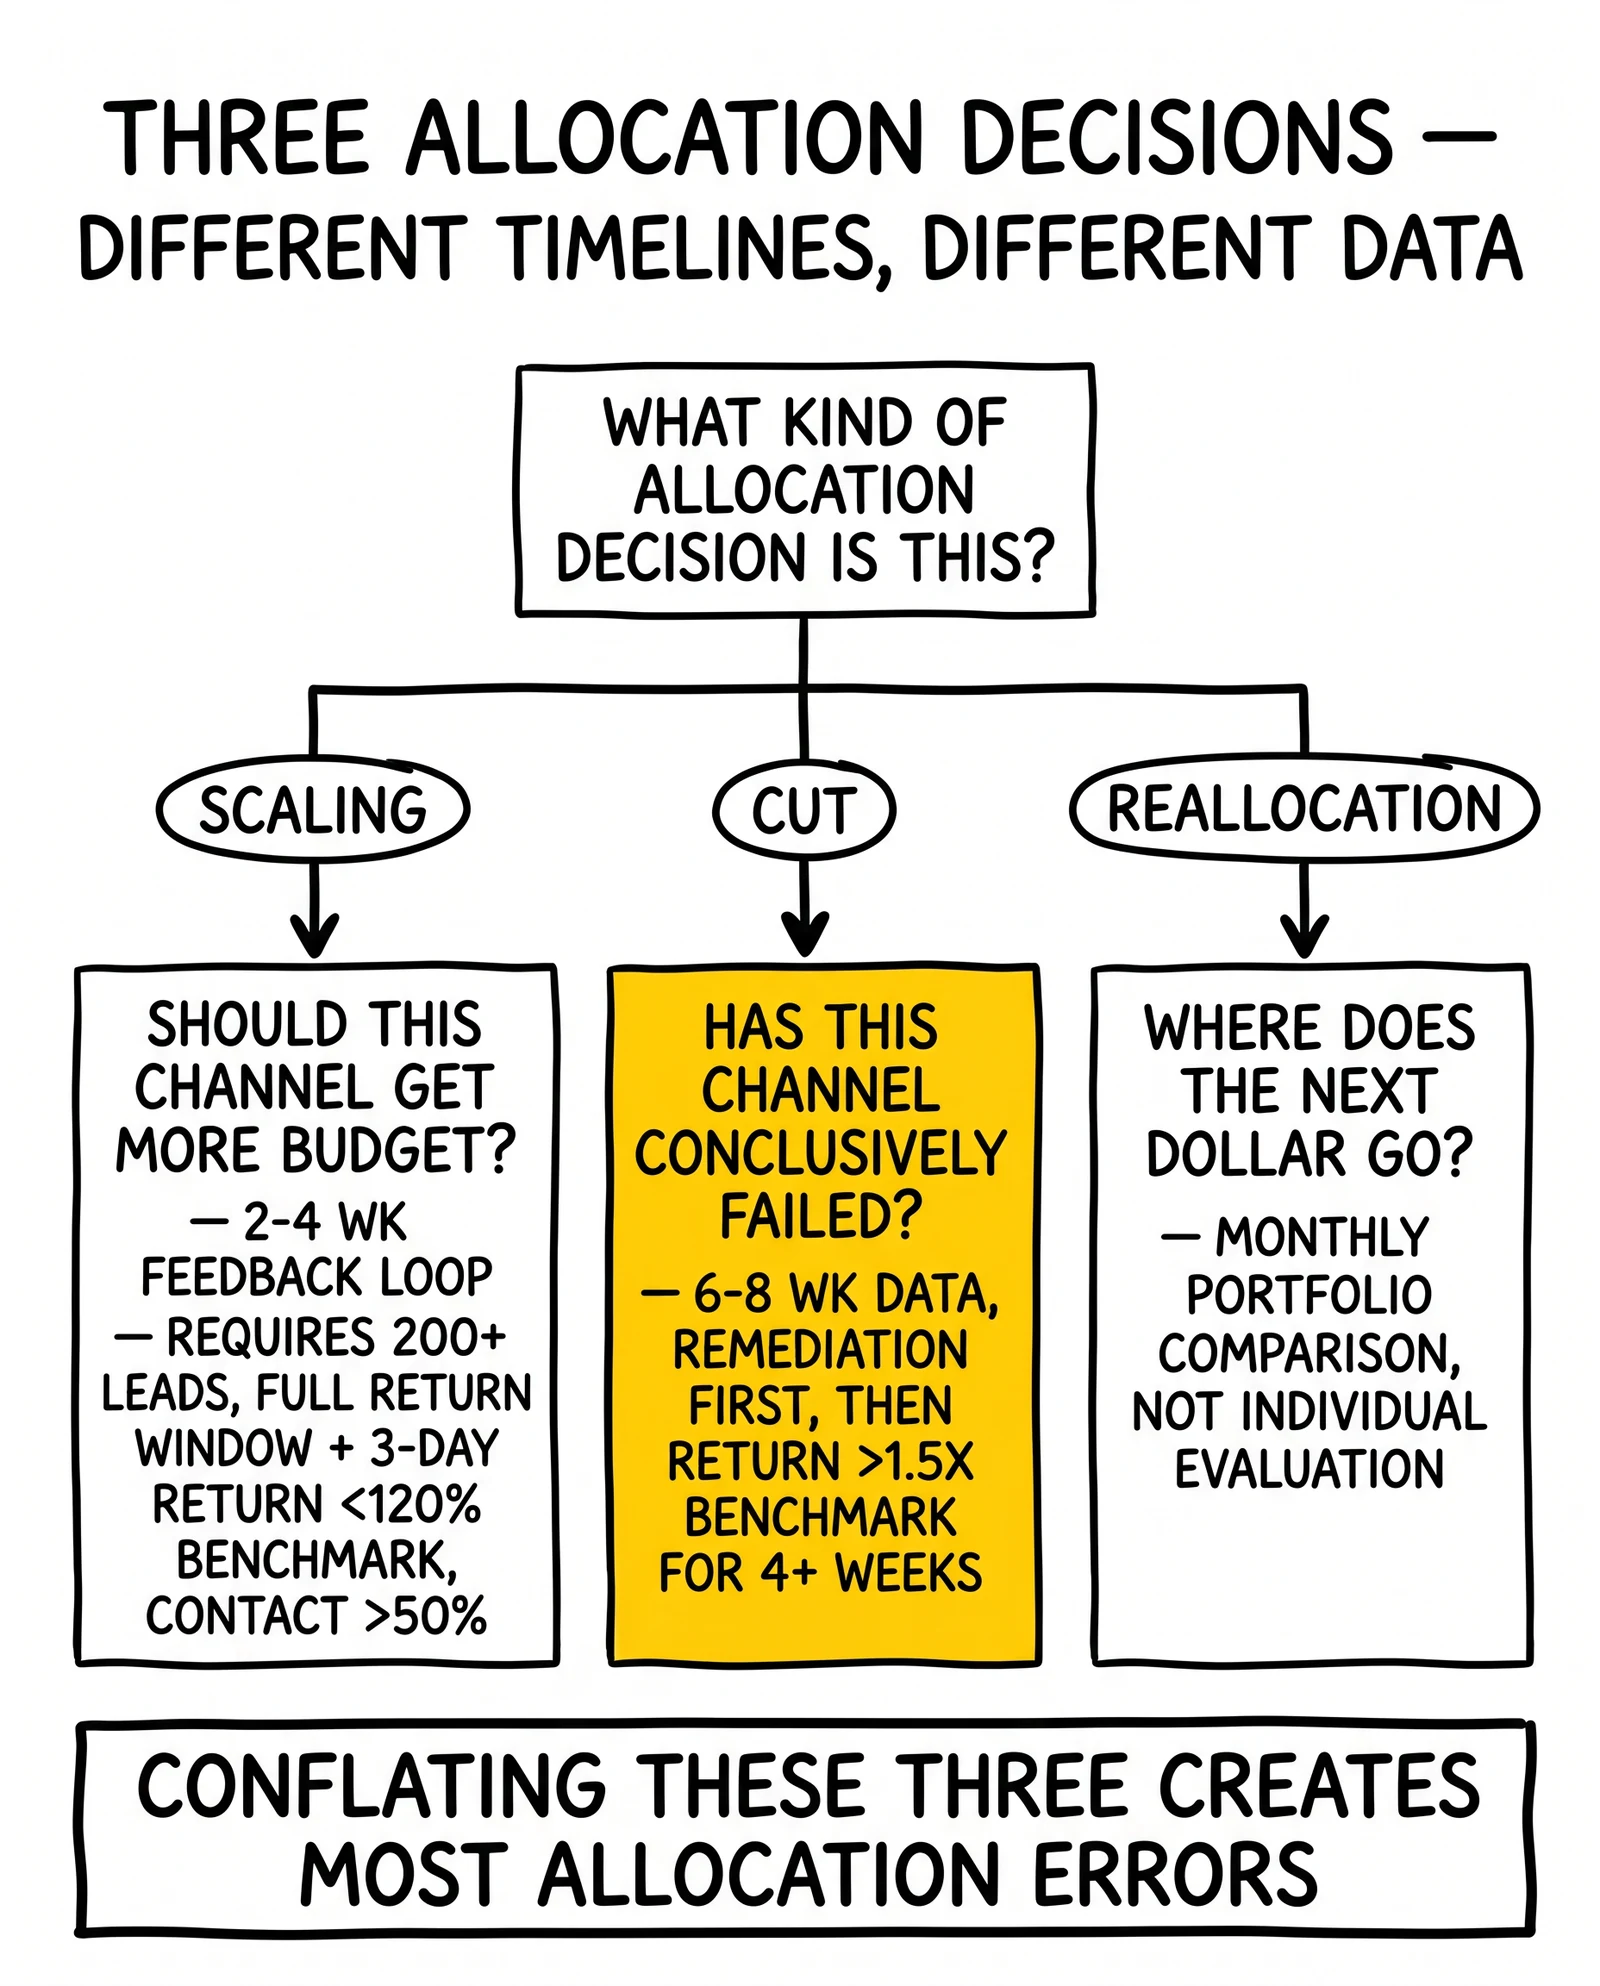
Budget allocation in lead generation has three distinct decision types, each operating on different timelines and requiring different data.
Scaling decisions ask: should this channel receive more budget? These require evidence that additional investment produces returns at or above the acceptable marginal cost threshold. They are forward-looking decisions with a 2–4 week feedback loop.
Cut decisions ask: has this channel conclusively failed? These require enough observation to distinguish trend from variance, which typically means 6–8 weeks of data showing sustained underperformance that has not responded to reasonable remediation. They are termination decisions that should not be rushed but also should not be deferred indefinitely.
Reallocation decisions ask: given the portfolio as a whole, where does the next dollar of incremental spend produce the most value? These require comparative analysis across sources, not just evaluation of individual source performance. They are portfolio-level decisions made monthly.
Conflating these three decision types creates most allocation errors. Scaling decisions made too quickly destroy learning on new channels. Cut decisions made too slowly subsidize failure. Reallocation decisions made without portfolio comparison optimize individual sources at the expense of portfolio efficiency.
Signals That a New Channel Is Ready to Scale
A new channel requires a qualification period before investment scales. The qualification period is not arbitrary – it reflects the time required to generate statistically meaningful data, observe the full return window, and distinguish early-period variance from actual performance.
The Minimum Viable Data Threshold
Statistical significance in lead generation requires:
Minimum lead volume: 200 delivered leads per source produces a 90% confidence interval of approximately ±6 percentage points on return rate measurement. This means a 10% return rate observation could reflect actual performance anywhere from 4% to 16% at 90% confidence. For meaningful source evaluation, you need 200+ leads before treating return rate data as reliable.
Minimum observation window: The observation window must encompass the full return window plus a buffer. For sources with 72-hour return windows, meaningful data requires 7 days minimum (72 hours for returns to arrive, plus 4 days of buffer for late returns). For programs with 7-day or 14-day return windows, extend the observation period accordingly.
Multiple conversion signal types: Return rate alone is insufficient for scaling decisions. Track alongside it: contact rate (what percentage of leads answer the phone), validation pass rate (what percentage pass phone and email verification), and downstream conversion rate if your buyers share this data. A source with a good return rate but a 25% contact rate has a quality problem that return rate alone misses.
The Scaling Signal Checklist
A new channel is ready for investment increase when all of the following are true:
- Minimum 200 delivered leads observed
- Full return window has passed, plus 3-day buffer
- Return rate is within 120% of vertical benchmark (e.g., for auto insurance, return rate below 18% if the benchmark is 15%)
- Contact rate is above 50% (or within 80% of the vertical average if you have vertical data)
- Validation failure rate is below 15% (more than 15% of leads failing pre-delivery checks indicates source quality issues that will worsen at scale)
- No single fraud signal is elevated (bot traffic flags, datacenter IP concentration, form completion time anomalies)
- Variable margin at current volume is positive
When all conditions are met, the channel can move to the next investment tier. When one or more conditions fail, extend the observation period or address the specific failure before scaling.
The Common Mistake: Scaling on CPL Alone
Scaling decisions made on cost per lead without return rate, contact rate, or fraud signal data routinely create problems that emerge 2–4 weeks after scale-up. The mechanism:
- Scale up traffic from a source that shows acceptable CPL in the first week
- Return window for the scaled volume opens: returns arrive in weeks 2–3
- Return rate on scaled volume is 22%, compared to 9% in the initial test batch
- The initial batch was biased toward the source’s better-performing publisher sub-sources; scale pulled in lower-quality sub-sources
This pattern occurs consistently when sources are qualified on CPL and volume rather than quality metrics. The qualification period exists specifically to catch this pre-scale.
When to Cut an Underperforming Channel
Cut decisions are more consequential than scale decisions because they are harder to reverse. A channel that was paused loses algorithm training, supplier relationships cool, and the opportunity cost of re-entry (learning period, volume ramp) is real.
This reversibility asymmetry argues for patience before cutting. It also argues against indefinite tolerance of underperformance. The framework below distinguishes the conditions that warrant cutting from those that warrant continued observation and remediation.
Distinguishing Variance from Structural Underperformance
All sources exhibit performance variance. A source running 8% returns will have weeks at 5% and weeks at 13% without any underlying quality change. Cutting on a bad week destroys learning and returns. Cutting on a bad trend responds appropriately to real decline.
The statistical test: compare the source’s return rate against its own historical mean. Calculate the standard deviation of weekly return rates over the observation period. If the current week’s rate is within two standard deviations of the historical mean, it is likely variance. If it is more than two standard deviations above the historical mean for two or more consecutive weeks, it is likely a trend.
A source with a mean return rate of 8% and standard deviation of 2% has:
- 95th percentile threshold: 8% + (2 × 2%) = 12%
- If the source runs 13%, 14%, and 15% for three consecutive weeks, this is structural decline, not variance
This calculation requires weekly return rate data by source over a sufficient history (minimum 8 weeks). Operations without this data infrastructure are managing source performance without the information needed to make defensible cut decisions.
The Remediation-First Protocol
Before cutting, attempt remediation. This matters for two reasons: it preserves the relationship with a supplier who might solve the quality problem with the right intervention, and it distinguishes sources that fail because of solvable problems from sources that fail because of fundamental quality issues.
Remediation steps by failure mode:
Elevated return rate from contact failure (disconnected/wrong numbers): Request the supplier implement phone verification at submission or shift traffic away from publishers with high phone failure rates. Allow 2 weeks for the change to take effect. If return rate does not improve to within benchmark, proceed to cut.
Elevated return rate from qualification mismatch (geographic, criteria): Review whether buyer filter configuration is capturing all required qualifications. Review whether supplier’s traffic generation practices have changed (new geographic targeting, new form language). Allow 2 weeks. If no improvement, proceed to cut.
Elevated fraud indicators (bot patterns, datacenter IPs, form completion anomalies): Report specific signals to supplier with documentation. Demand publisher-level audit from the supplier. Allow 1 week for supplier response. If supplier cannot identify and remove fraudulent sub-sources, proceed to immediate cut – fraud does not improve without active intervention.
Gradual CPL increase without quality improvement: This is a market dynamics signal, not a quality failure. The supplier’s traffic costs are rising. Renegotiate pricing with volume commitments or reduced caps. Do not cut if quality remains acceptable – pricing negotiation is the appropriate response to cost inflation.
The Cut Decision Criteria
Cut a source when:
Return rate is above 1.5x vertical benchmark for 4+ consecutive weeks after remediation: At this threshold, the source is destroying buyer relationships, consuming return processing labor, and compressing margins beyond recovery.
Contact rate is below 35% for 4+ consecutive weeks: A source where fewer than 35% of delivered leads answer the phone is generating traffic with either fundamental quality problems (wrong numbers, fake submissions) or a demographic mismatch (submitters who do not engage with outbound calls). Neither is solvable at the source level without the supplier’s intervention.
Validation failure rate exceeds 25% for 4+ consecutive weeks: More than one in four leads failing pre-delivery validation indicates the source is sending traffic that cannot be delivered to quality-conscious buyers. This is typically a signal of incentivized or fraudulent traffic that the supplier is either unable or unwilling to address.
Variable contribution turns negative after accounting for return deductions: When the fully-loaded variable cost per delivered lead exceeds the average sale price after return adjustments, the source is destroying value on every lead delivered. There is no operational improvement that recovers this – the unit economics are structurally negative.
The Cut Execution Process
Cutting should be structured rather than abrupt. Abrupt cuts create supplier relationship problems and leave buyers with sudden volume gaps that damage those relationships.
Week 1: Reduce cap to 50% of current volume. Notify supplier that quality issues are under review. This allows the supplier to investigate and respond while limiting ongoing exposure.
Week 2: If quality has not improved, reduce to 0. Archive campaign settings and supplier integration for potential future reactivation. Document the decision rationale in your source management log.
Week 3–4: Track whether any residual leads from the source are still in the return window. Complete the return accounting before closing the source’s P&L entry.
60-day review: Revisit the source 60 days after cut. Has the supplier made changes? Have vertical market conditions shifted in ways that might make the source viable again? This review prevents permanently writing off sources that were cut for fixable reasons.
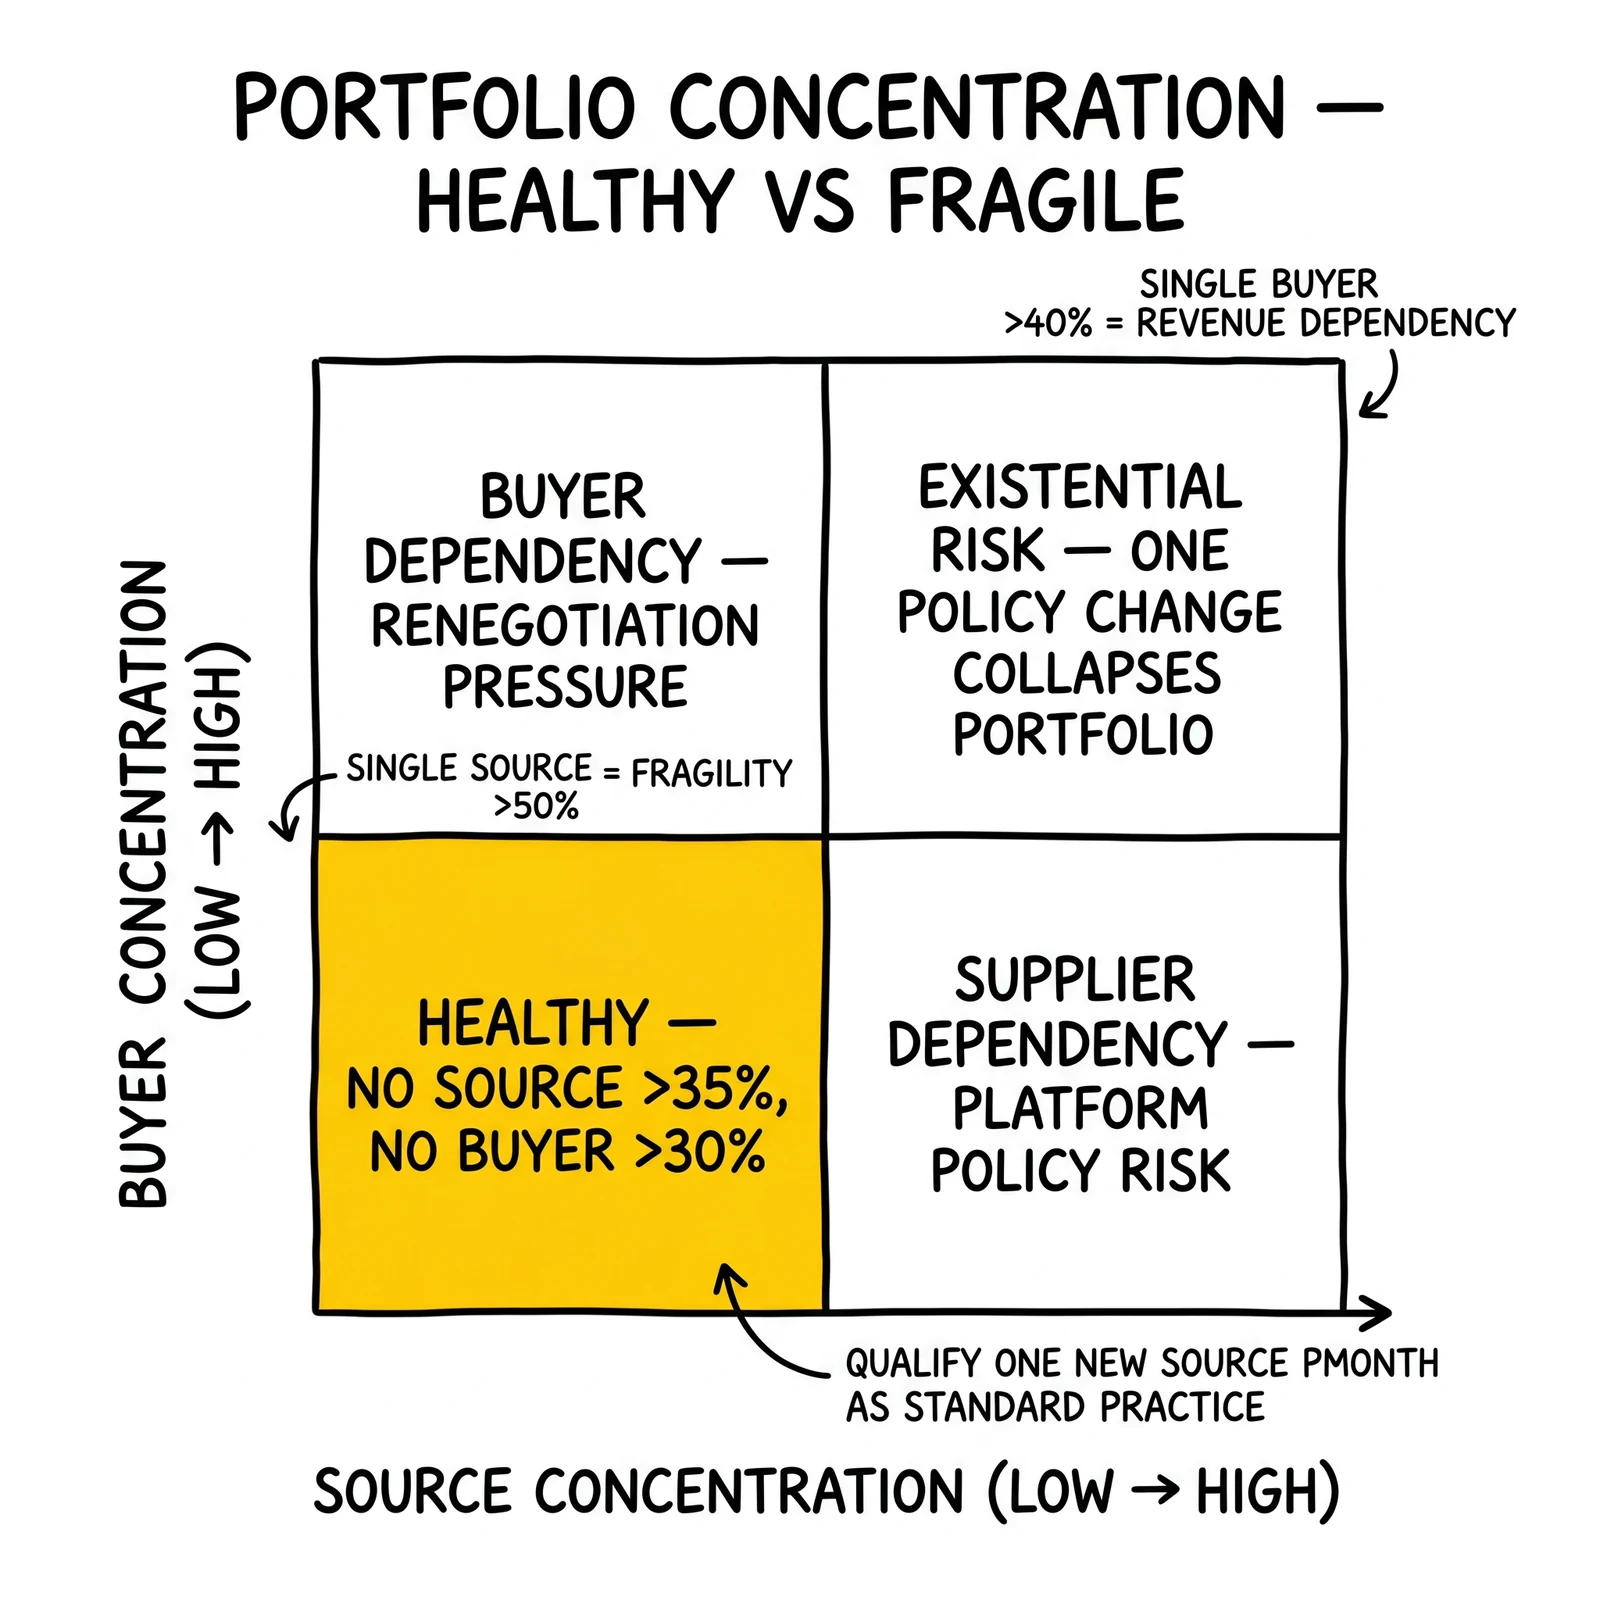
Concentration Risk Thresholds
Portfolio concentration is the risk that most lead generation operators understand abstractly but allow to develop concretely. A source that performed exceptionally for 12 months receives increasing allocation until it represents 65% of total volume. Then Google changes its policy, or the supplier loses its primary publisher, or the vertical experiences a demand shock. The concentrated source fails, and there is no portfolio resilience.
The Quantified Thresholds
Single-source concentration above 50% of delivered volume: This level creates fragility. A 40% quality degradation in the primary source – a plausible event from a single policy change or publisher quality shift – reduces total portfolio output by 20% immediately. At 65% concentration, the same event reduces portfolio output by 26%. The business cannot absorb this without either immediate price concessions to buyers (to reduce volume expectations) or a painful transition period of acquiring replacement sources under pressure.
Single-channel concentration above 60% of media spend: Channel and source are different. A channel is a media type (Google Ads, Meta, native). A source is a specific supplier or traffic stream. Channel concentration creates platform dependency: if Google changes match types or bidding requirements, you need operational capability on other channels to absorb the impact.
Single buyer purchasing more than 40% of delivered volume: This is the mirror-side concentration risk. Buyer concentration creates revenue dependency on a relationship that may change. A buyer who represents 50% of revenue and renegotiates prices down 15% creates immediate margin pressure that takes months to resolve through new buyer acquisition.
The Diversification Build Path
Healthy concentration targets:
- No single source above 35% of delivered volume
- No single channel above 45% of media spend
- No single buyer above 30% of delivered volume
Reaching these targets from a concentrated position takes time and should be managed actively rather than waiting for organic diversification.
Adding sources: Qualify one new source per month as a standard practice, regardless of current performance. The qualification period (200+ leads, full return window observation) requires constant pipeline of new sources in testing. By the time a source passes qualification, 60–90 days have elapsed. A monthly new-source cadence maintains a pipeline of 2–3 qualified sources ready to scale.
Adding channels: Adding a new channel (e.g., adding LinkedIn to a portfolio that is Google + Meta) requires more infrastructure investment than adding a new source within an existing channel. It also requires new expertise. Budget 10–15% of total spend for channel testing with the expectation that a new channel requires 60–90 days to generate meaningful data at sufficient volume.
Adding buyers: Buyer acquisition requires business development effort. For operations heavily concentrated in one buyer, building the buyer pipeline is as strategically important as building the source pipeline.
Reallocation Cadence: Structure Over Instinct
Reallocation decisions made without a cadence default to instinct: moving money toward what feels good and away from what feels bad. This produces allocation that chases recent performance rather than optimizing for expected future value. It also disrupts algorithm learning on platforms where bidding algorithms require stable budget environments to optimize effectively.
The Three-Tier Review Cadence
Weekly operational review (30–45 minutes):
Purpose: Catch anomalies that require immediate intervention. Not a decision-making forum – it is a monitoring forum that identifies whether a decision needs to be made.
Review focus:
- Is any source in the top 5 running above its 95th-percentile historical return rate? (Alert threshold: yes)
- Is any source’s 7-day validation failure rate above 20%? (Alert threshold: yes)
- Are all source volume caps properly configured and not overdelivering? (Alert threshold: no)
- Is campaign spend pacing within 10% of target? (Alert threshold: outside 10%)
Weekly review produces two outputs: escalate to decision-making cadence, or no action required.
Monthly reallocation review (90–120 minutes):
Purpose: Make deliberate allocation changes based on trailing 30-day performance. This is where scale, cut, and reallocation decisions are made.
Review focus:
- Source P&L comparison across trailing 30 days (see the source-level P&L framework)
- Sources meeting scaling criteria: vote on investment increase, document reasoning
- Sources meeting cut criteria after remediation: vote on cap reduction or termination, document reasoning
- Portfolio concentration check: are any sources approaching 35% volume threshold?
- New source pipeline: what is in qualification? What results have they shown?
Monthly review produces explicit budget changes with documented rationale.
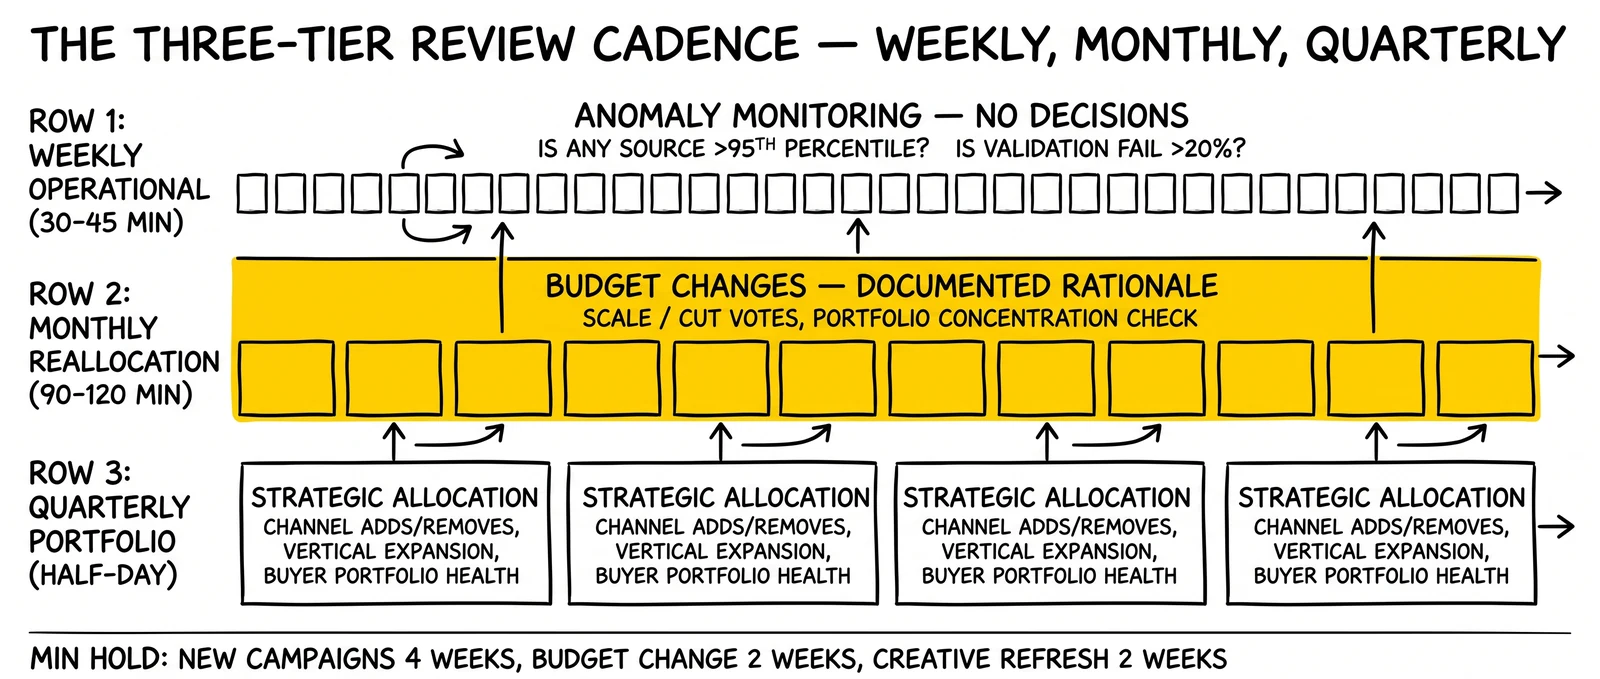
Quarterly portfolio review (half-day):
Purpose: Strategic allocation decisions that operate on longer timelines. Channel additions and removals, vertical expansion, buyer relationship investments.
Review focus:
- Channel mix: is the current channel composition aligned with 12-month growth targets?
- Geographic concentration: are we over-indexed on specific markets that may be vulnerable to policy or economic changes?
- Vertical concentration: if the portfolio is 70% insurance leads, is that intentional or is it drift?
- Emerging channel evaluation: what new channels have sufficient industry data to warrant testing?
- Buyer portfolio health: what is buyer concentration? Are any buyer relationships at risk?
Quarterly review produces a 90-day allocation plan with testing priorities and strategic targets.
The Minimum Hold Period Before Reallocation
Algorithmic advertising platforms require time to optimize. Meta’s ad sets need approximately 50 conversions per week per ad set to exit the learning phase and optimize delivery effectively. Google’s Performance Max and Smart Bidding campaigns need 30+ monthly conversions per campaign. These thresholds mean that campaigns below minimum conversion volume cannot optimize regardless of budget.
Reallocation timing should account for these thresholds. Reallocating budget away from a campaign before it has accumulated sufficient conversion data destroys the learning it has built without the opportunity to demonstrate the performance improvement that learning was working toward.
Minimum hold periods before reallocation:
- Brand new campaigns: 4 weeks minimum before cut consideration, 6 weeks before meaningful performance evaluation
- Established campaigns with budget change: 2 weeks after significant budget change before evaluating impact
- Campaign after creative refresh: 2 weeks minimum before performance evaluation
These minimum periods prevent the common mistake of cutting campaigns because they did not perform in their first two weeks of operation, before algorithms had sufficient data to optimize.
When to Add a New Channel
Adding a new channel is a more significant decision than adding a new source within an existing channel. It requires new platform expertise, new creative formats, new tracking infrastructure, and new operational processes. It also requires capital: budget that will produce below-average returns during the learning period.
The Readiness Criteria for New Channel Testing
A new channel is worth testing when:
Core channels are performing at or above target margin: If existing channels are underperforming, the problem is execution in known channels, not channel diversification. Adding a new channel while core channels underperform divides management attention and compounds the problem.
Concentration in existing channels approaches threshold: If any single channel represents 55%+ of spend, the strategic case for a complementary channel increases. The test is not just about finding better performance – it is about building resilience.
Team has or can acquire the necessary expertise: A team with Google Ads expertise adding LinkedIn Ads faces a significant learning curve. Either hire someone with platform expertise or budget for the learning curve. Testing a channel without adequate expertise produces noisy data that cannot reliably indicate whether the channel can work or whether the execution was poor.
Budget supports meaningful test volume: New channel tests need a minimum viable budget to generate sufficient conversion events for optimization. For Meta, this means $5,000–8,000 per month minimum to exit the learning phase. For Google, similar thresholds apply. Testing at $2,000/month produces data that is too sparse to evaluate.
The New Channel Evaluation Criteria
A new channel test succeeds when, over a 60-day evaluation period:
- Cost per delivered lead (after validation failures) is within 30% of the leading existing channel
- Return rate is within 120% of vertical benchmark
- Contact rate is above 45%
- The traffic pattern is not highly correlated with existing channels (i.e., it provides genuine diversification rather than duplicating existing reach)
Channels that meet these criteria after 60 days graduate to a regular allocation. Channels that fail to meet these criteria after 60 days terminate with documented learnings.
The 30% CPL tolerance acknowledges that new channels typically show worse economics than established channels during their early period. Optimization improves performance over 3–6 months. The question is whether the ceiling for a new channel, after optimization, can approach the established channel’s performance – not whether it gets there in week one.
Real Talk: What Most Operations Get Wrong About Allocation
Several allocation mistakes are common enough to warrant direct statement rather than embedding them as caveats within frameworks.
Keeping underperforming sources because they fill volume. Volume without margin is cash outflow. A source generating 15% of volume at negative net contribution destroys value by consuming overhead capacity, management attention, and buyer relationship goodwill. The right response to volume needs is investing in qualifying new sources, not tolerating bad existing sources.
Treating allocation as a quarterly decision. Quarterly allocation review is a strategic exercise. It does not substitute for monthly operational decisions. A source that turns negative in February needs a cut decision in March, not at the next quarterly review in April.
Scaling on CPL without quality data. CPL is an incomplete signal. Return rate, contact rate, and validation failure rate are required alongside CPL to determine whether a source is ready to scale. Scaling on CPL alone is optimizing for one metric while ignoring the metrics that determine whether that CPL translates to actual revenue.
Not quantifying concentration risk. Most operators know intuitively that concentration is risky. Few have quantified what concentration level they are currently at and what the impact would be if their largest source degraded by 30%. Quantifying current concentration makes the risk concrete enough to motivate action.
Confusing platform algorithms with allocation strategy. Meta’s Advantage+ and Google’s Performance Max will optimize spend within their platform. They will not optimize across platforms, across channels, or between media buying and supplier management decisions. Portfolio-level allocation is not automated by any platform. It requires deliberate human decision-making.
Frequently Asked Questions
How long should I give a new source before deciding to cut or scale?
6–8 weeks minimum for a meaningful evaluation. The first four weeks generate enough data for a preliminary assessment but not a final one. Weeks 5–8 confirm or contradict the early signal. At week 8, if the source is not meeting quality criteria after one round of remediation attempts, the cut decision is appropriate. If it is meeting criteria, the scale decision is appropriate. Sources that are meeting criteria at week 4 can receive a preliminary scale-up to 150% of initial volume, but the final evaluation should still wait for week 6–8 data.
What concentration level is acceptable in a mature operation?
A mature operation with strong buyer diversification and operational resilience can tolerate higher source concentration than a young operation. As a rule of thumb: operations over 3 years old with 6+ qualified buyers and 4+ sources can tolerate a leading source at 40% of volume without excessive risk. Operations under 2 years or with fewer than 4 buyers should target a leading source below 30%.
When a source is cut, should I notify buyers about the volume reduction?
Yes. Buyers who have configured their systems around a specific volume from you will experience the reduction as an unexpected gap. Proactive notification – 1 week in advance if possible, same day if the cut is for quality reasons that require immediate action – maintains the relationship and allows buyers to plan their volume acquisition accordingly.
How do I evaluate a new channel when I do not have historical benchmarks for it?
Use industry benchmarks from comparable operations (vertical-specific CPL and return rate data from industry surveys), your existing channel performance as a comparison baseline with an explicit discount applied (new channels typically perform 20–30% worse than established channels initially), and a defined success threshold (e.g., “this channel passes if CPL is below $X and return rate is below Y% after 60 days”). Setting the threshold before the test begins prevents moving the goalposts based on how the test goes.
My largest source is at 65% of volume. How do I reduce concentration without losing revenue?
The path is parallel: qualify new sources while keeping the concentrated source fully active. Do not reduce the leading source’s cap until a replacement source has passed qualification and scaled to at least 25% of portfolio volume. The transition period will cost more in aggregate (running more sources than optimal) but avoids the revenue gap that comes from cutting before replacements are ready. Target: 12–18 months to move from 65% concentration to 40%, assuming one new source per month in qualification and one succeeding per quarter.
What is the right testing budget percentage for a $30,000/month operation?
10–15% of total budget, meaning $3,000–4,500/month. This supports one active test at a time at meaningful volume. Two concurrent tests at $1,500–2,250 each will be too small for most channels to generate enough conversion events to exit learning phases. Better to run one test properly than two tests that produce inconclusive data.
Key Takeaways
Scaling decisions require quality data, not just volume and CPL. Return rate, contact rate, and validation failure rate must meet threshold criteria before a source receives increased investment. CPL-only scaling creates quality problems that surface 2–4 weeks after scale-up.
Cut decisions should follow a protocol, not a reaction. Distinguish variance from structural underperformance using historical standard deviation analysis. Attempt remediation before cutting. Execute cuts with a structured wind-down that protects supplier relationships and buyer expectations.
Concentration above 50% of any resource type creates strategic fragility. Quantify current concentration in sources, channels, and buyers. Build toward 35%/45%/30% thresholds as long-term targets. The process requires a constant pipeline of new sources in qualification.
Reallocation cadence prevents both neglect and overreaction. Weekly monitoring catches anomalies. Monthly reviews drive deliberate allocation changes. Quarterly reviews address strategic portfolio composition. These three tiers serve different purposes and cannot substitute for each other.
New channel tests require minimum viable budgets and expertise. Testing below $5,000/month on most platforms produces data that cannot reliably evaluate channel viability. Testing without platform expertise produces noisy data that confounds channel quality with execution quality. Both conditions must be met before a new channel test is meaningful.
The minimum hold period prevents premature cut decisions. Algorithmic campaigns on Meta and Google require 4–6 weeks of data to optimize. Cutting campaigns within this window destroys learning before it can produce results. Document minimum hold periods in your allocation process and enforce them.
Allocation discipline compounds over time. The difference between operators who build durable businesses and those who cycle through sources chasing performance is not access to better sources – it is consistent application of a disciplined allocation framework that scales winners, cuts losers quickly, and maintains portfolio resilience through diversification.
Sources
- Meta Ads Learning Phase – Official Meta documentation on the 50 conversions per week threshold for ad set optimization and learning phase requirements
- Hootsuite Facebook Statistics - Meta platform usage data including 3.43 billion monthly active users across Facebook, Instagram, and Messenger
- Statista Advertising Spending - Global digital advertising spend data and industry benchmarks
- Statista Native Advertising - Native advertising market size data ($104.63 billion in 2024)
- Taboola - Native advertising platform documentation on content discovery benchmarks
- Outbrain - Native advertising network with publisher performance data
- Google Ads Smart Bidding – Google documentation on conversion volume requirements for automated bidding optimization
- Think with Google – Industry research and advertising benchmark data for lead generation verticals
- Investopedia: Modern Portfolio Theory – Diversification and correlation concepts applied to channel portfolio management
- Medicare.gov Enrollment - Official Medicare Annual Enrollment Period dates (October 15 - December 7)
- Medicare.gov Annual Enrollment Period – Official Medicare AEP dates (October 15 – December 7) referenced in seasonal allocation planning
Allocation frameworks and thresholds reflect patterns observed across insurance, mortgage, solar, and home services lead generation. Specific thresholds should be calibrated against your vertical’s benchmarks, operational scale, and team capacity.