The comprehensive guide to measuring what actually drives lead generation results and allocating budget based on reality, not platform self-reporting.
Attribution determines where your money goes.
Every dollar you spend on lead generation flows toward activities you believe produce results. But belief and reality often diverge. The Facebook campaign showing 400% ROAS in platform reporting might deliver 30% incremental lift when properly tested. The Google brand campaign claiming credit for 2,000 conversions might be capturing demand you would have won anyway. Meanwhile, the awareness campaign that looks expensive and ineffective might be the only thing creating the demand your closing channels harvest.
Attribution models answer the fundamental question: which marketing touchpoints actually deserve credit for conversions? Get this wrong, and you systematically misallocate budget. You starve the activities that create demand while overfunding the ones that merely capture it. You celebrate vanity metrics while margin evaporates.
This article breaks down the major attribution models, explains when each works best, and reveals the implementation challenges that make accurate measurement genuinely difficult. You will learn to evaluate first-touch, last-touch, and multi-touch approaches. You will understand incrementality testing and why it matters. And you will develop a framework for choosing the right model for your specific operation.
The math determines your margin. Let’s get it right.
Why Attribution Matters for Lead Generation
Lead generation operates on thin margins. A typical operation buying leads at $30 and selling at $50 generates $20 gross margin before returns, processing, compliance costs, and float erode that number to $8-12 in actual profit. Understanding lead generation profit margins helps contextualize why attribution accuracy matters so much. At those margins, budget allocation mistakes compound quickly.
Consider an operation spending $100,000 monthly across five channels. Standard attribution reporting shows:
| Channel | Spend | Reported Conversions | Reported CPA | Reported ROAS |
|---|---|---|---|---|
| Facebook Prospecting | $25,000 | 400 | $62.50 | 180% |
| Google Non-Brand | $30,000 | 600 | $50.00 | 240% |
| Google Brand | $15,000 | 500 | $30.00 | 400% |
| Native Ads | $20,000 | 300 | $66.67 | 150% |
| Retargeting | $10,000 | 350 | $28.57 | 420% |
Looking at these numbers, the obvious move is shifting budget from Facebook and Native to Retargeting and Brand, where efficiency appears highest.
But this analysis contains a fundamental error. Retargeting and Brand capture demand that other channels created. Without Facebook prospecting introducing new consumers to your brand, there would be no one to retarget. Without non-brand search driving research-stage traffic, fewer consumers would search your brand name. The “efficient” channels are harvesting crops planted by the “inefficient” ones.
Proper attribution reveals this dynamic. And it changes every strategic decision you make.
According to Forrester Research, companies using advanced attribution models achieve 15-30% improvement in marketing ROI through more effective budget allocation. That improvement represents real money. On a $1 million annual marketing spend, proper attribution can recover $150,000-$300,000 in wasted allocation.
The stakes extend beyond marketing efficiency. Lead generation businesses that misattribute performance make systematic errors:
They cut awareness spending and wonder why retargeting audiences shrink. They double down on brand search and watch branded query volume decline. They celebrate short-term efficiency gains that erode long-term competitive position. Attribution accuracy determines not just campaign performance but business survival.
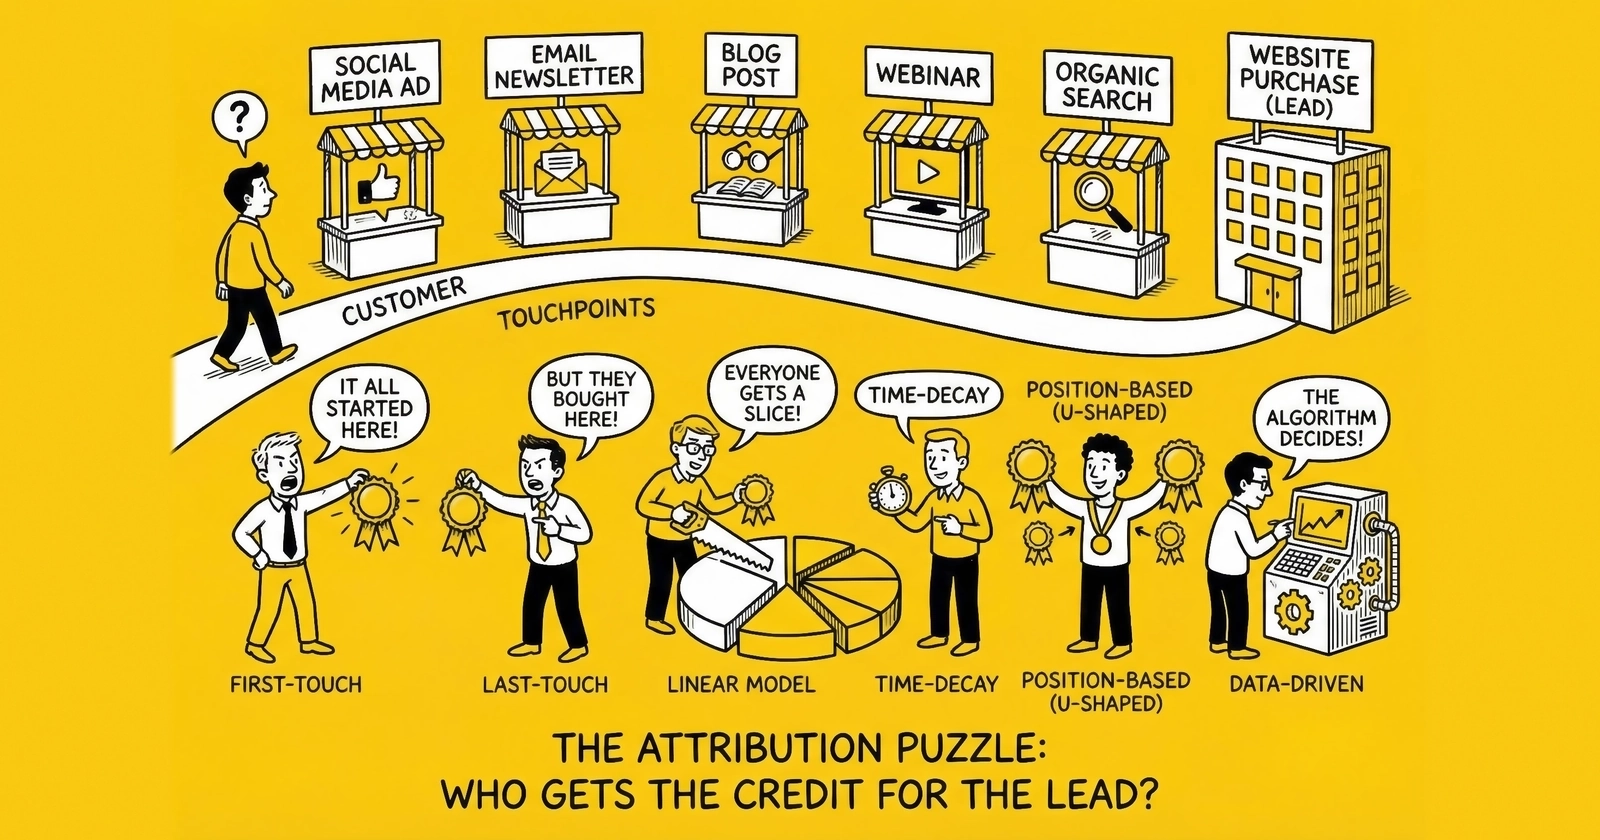
What Is Lead Attribution?
Attribution is the practice of assigning credit for conversions to the marketing touchpoints that influenced them. When a consumer fills out your lead form, attribution answers: which ads, content, emails, and interactions deserve credit for that conversion?
The challenge arises because modern customer journeys involve multiple touchpoints. A typical lead generation conversion path might look like this:
- Consumer sees Facebook ad while scrolling (impression, no click)
- Consumer searches “[problem] solutions” on Google, clicks your organic result
- Consumer reads your blog post, leaves without converting
- Consumer sees retargeting ad on news site (impression)
- Consumer searches your brand name, clicks paid ad
- Consumer fills out lead form
Six touchpoints contributed to one conversion. Attribution models determine how credit distributes across them.
Why does this matter for lead generation specifically?
Lead generation businesses face attribution challenges that differ from ecommerce:
First, the conversion event and the revenue event are disconnected. A lead form submission happens at moment A. The lead sale to a buyer happens at moment B. The buyer’s acceptance (no return) confirms at moment C. Value realization can span weeks, making it harder to connect marketing activity to actual revenue.
Second, lead quality varies independently of conversion. Two leads captured from identical ad sets might generate completely different outcomes. One sells for $50 exclusive; the other gets returned. Attribution that stops at form submission misses the quality dimension entirely. See our guide on understanding lead quality scores for more on this challenge.
Third, multi-buyer distribution complicates revenue attribution. A single lead might sell to three buyers for a total of $75. Which touchpoint gets credit for which portion of that revenue?
These complications make attribution both more difficult and more important for lead generation. Getting it wrong doesn’t just misallocate marketing spend. It distorts your understanding of which leads actually make money.
First-Touch Attribution
Definition and Mechanics
First-touch attribution assigns 100% of conversion credit to the initial marketing interaction that introduced the consumer to your brand.
If a consumer first encountered you through a Facebook ad, then visited via organic search, then converted through retargeting, first-touch gives all credit to Facebook. The logic: without that initial introduction, nothing else would have happened. First touch created the opportunity.
In practice, first-touch measurement requires identifying and storing the original traffic source for every consumer. This typically happens through:
- UTM parameters captured on first website visit
- First-party cookies storing initial referrer data
- CRM or analytics platforms tracking acquisition source
When First-Touch Works
First-touch attribution serves specific strategic needs:
Measuring demand generation effectiveness. If your business depends on continuously reaching new consumers, first-touch reveals which channels successfully expand your addressable audience. Facebook prospecting, display campaigns, and content marketing often look weak in last-touch but strong in first-touch because they introduce rather than close.
Short sales cycles. When consumers convert within hours or days of first exposure, first and last touch may be the same interaction anyway. First-touch keeps measurement simple without sacrificing accuracy.
Growth-stage businesses. New operations need to understand what creates awareness and initial interest. First-touch illuminates top-of-funnel effectiveness when building market presence matters more than optimizing existing demand.
Budget justification for awareness spending. Marketing teams struggling to justify awareness campaigns often use first-touch to demonstrate that prospecting creates the opportunity for downstream conversion. Without first-touch data, awareness spending looks purely like cost with no attributable return.
Limitations of First-Touch
First-touch creates blind spots that distort decision-making:
Ignores nurture effectiveness. A consumer who first saw your Facebook ad but needed six retargeting impressions and three emails before converting received no value from those touchpoints according to first-touch. This undervalues the middle and bottom of the funnel.
Overvalues broad reach channels. Channels that create many first touches but few conversions look artificially strong. A display campaign introducing 100,000 consumers who mostly never convert appears more valuable than a targeted campaign introducing 10,000 consumers who convert at high rates.
Fails for long consideration cycles. In verticals like mortgage or solar where consumers research for weeks, first-touch attributes value to interactions so temporally distant from conversion that the causal link becomes questionable.
Platform gaming. Sophisticated ad platforms engineer first-touch impressions. A consumer planning to search for insurance might see a display ad first because the platform predicted their intent. First-touch credits display for demand that search would have captured anyway.
Last-Touch Attribution
Definition and Mechanics
Last-touch attribution assigns 100% of conversion credit to the final marketing interaction before conversion.
Using the same journey example, if a consumer first saw a Facebook ad, then engaged with organic content, then clicked a retargeting ad, then converted through brand search, last-touch gives all credit to the brand search campaign. The logic: whatever happened last was decisive. The consumer had opportunities to convert earlier but didn’t until that final touch.
Last-touch is the default attribution model in most analytics and ad platforms because it’s straightforward to measure. You simply look at the referrer or UTM source for the converting session.
When Last-Touch Works
Last-touch serves specific strategic needs:
Optimizing conversion efficiency. When you have sufficient demand and need to maximize conversion rates on that demand, last-touch identifies which channels close effectively. Retargeting, email nurture, and brand search often excel at last-touch because they reach consumers already inclined to convert.
Short, impulse-driven cycles. When decisions happen quickly with minimal research, the final touch genuinely represents most of the influence. Simple lead magnets and immediate-response offers often show minimal gap between first and last touch anyway.
Budget-constrained operations. With limited resources, prioritizing proven converters over uncertain demand generators reduces risk. Last-touch identifies reliable closing channels.
Sales team alignment. Last-touch resembles how sales teams think about closing. The final interaction that triggered the conversion gets credit, matching the mental model of operators focused on immediate results.
Limitations of Last-Touch
Last-touch creates perhaps more dangerous blind spots than first-touch:
Credits harvesters, starves planters. Brand search and retargeting campaigns excel at last-touch because they reach consumers who already intend to convert. But that intent was created elsewhere. Overinvesting in harvesters while cutting planters eventually depletes the demand pool.
Cannibalizes organic demand. A consumer who would have typed your URL directly might click a branded paid ad first. Last-touch credits that ad for a conversion that would have happened anyway. This dynamic makes brand bidding look more valuable than it is.
Ignores assist value. The retargeting impression that reminded someone to return, the email that educated them about your offering, the comparison content that positioned you favorably – none of these get credit despite genuinely influencing the outcome.
Encourages short-term thinking. If last-touch drives budget decisions, marketers stop investing in awareness and education. Short-term efficiency improves as you harvest accumulated demand. Then demand depletes and you have no first-touch pipeline to replenish it.
Consider this example: An operation cuts Facebook prospecting because it shows poor last-touch performance. Retargeting and brand search maintain strong numbers for two months as they harvest existing cookies and brand awareness. By month three, the audience pool is depleted, retargeting reach drops 40%, and brand search volume declines 25%. The “efficient” channels were parasites feeding on a host the operator killed.
Multi-Touch Attribution Models
Multi-touch attribution distributes credit across all touchpoints in the customer journey. This approach acknowledges that modern paths to conversion involve multiple interactions, each contributing something to the outcome.
Several models exist, each with different distribution logic:
Linear Attribution
Linear attribution splits credit equally across all touchpoints. Five touches mean each receives 20% credit. Ten touches mean each receives 10% credit.
Strengths:
- Simple to explain and implement
- Ensures no touchpoint is completely ignored
- Provides balanced view of full-funnel contribution
Weaknesses:
- Treats a fleeting impression the same as an engaged session
- Doesn’t reflect reality where some interactions matter more than others
- May overvalue low-quality touchpoints that add little genuine influence
Best for: Operations wanting a simple step beyond single-touch without complex modeling, or where touchpoint quality is relatively consistent.
Time-Decay Attribution
Time-decay weights recent touchpoints more heavily than earlier ones. Credit diminishes backward through the journey. The conversion-proximate touch might receive 40% credit, the one before it 25%, and so on until early touches receive minimal allocation.
Strengths:
- Reflects recency bias in actual decision-making
- Acknowledges that later interactions often have more direct influence
- Balances between first-touch and last-touch extremes
Weaknesses:
- Undervalues introduction and education touchpoints
- Arbitrary decay rate selection affects results significantly
- May discourage investment in upper-funnel content
Best for: Businesses with short-to-medium consideration windows (1-4 weeks) where recent interactions genuinely drive final decisions.
Position-Based (U-Shaped) Attribution
Position-based attribution emphasizes first and last touches – typically allocating 40% to each – while spreading the remaining 20% across middle interactions.
Strengths:
- Honors both introduction and conversion
- Acknowledges that beginning and ending the journey matter most
- Simple to understand and explain
Weaknesses:
- Arbitrary 40/40/20 split may not reflect actual influence
- Undervalues important middle-journey moments (product comparison, objection resolution)
- Treats all middle touches equally
Best for: Businesses where initial awareness and final conversion are clearly the most important moments, with relatively undifferentiated middle-journey content.
W-Shaped Attribution
W-shaped attribution adds weight to the lead creation moment, distributing perhaps 30% to first touch, 30% to lead creation, 30% to conversion, and 10% across other touchpoints. This works well for B2B and longer cycles where the middle transition from anonymous visitor to identified lead represents a meaningful milestone.
Strengths:
- Recognizes that lead capture is a meaningful milestone
- Works well for B2B and longer sales cycles
- Better reflects the lead generation funnel structure
Weaknesses:
- Requires clear identification of the “lead creation” moment
- More complex to implement and explain
- Still applies predetermined weights that may not reflect actual influence
Best for: B2B lead generation, longer sales cycles, and operations where the lead capture event is distinct from both first awareness and final conversion.
Data-Driven (Algorithmic) Attribution
Algorithmic attribution uses machine learning to assign credit based on actual conversion patterns in your data. Rather than applying predetermined rules, these models analyze which touchpoint sequences correlate with conversions versus non-conversion.
Google’s data-driven attribution examines your conversion paths to identify which interactions most influence outcomes. Facebook offers similar algorithmic tools within their ecosystem.
Requirements for effective algorithmic attribution:
- Sufficient conversion volume (typically 600+ monthly conversions minimum)
- Consistent tracking infrastructure across touchpoints
- Historical data spanning multiple months
- Technical resources for implementation and interpretation
Strengths:
- Based on actual data rather than assumptions
- Reveals counterintuitive patterns (that “weak” creative might be an essential assist)
- Adapts as your marketing mix changes
Weaknesses:
- Requires significant data volume
- “Black box” nature makes results hard to explain
- Results can shift unpredictably between measurement periods
- Still operates within each platform’s walled garden
Best for: High-volume operations with mature tracking infrastructure seeking optimization beyond rule-based models.
Challenge #122: Multi-Touch Attribution Complexity
The 122nd documented challenge facing lead generation captures a core difficulty: complex customer journeys make attribution genuinely difficult, leading to suboptimal budget allocation.
Over half of brands and agencies report using multi-touch attribution despite significant implementation challenges. The methodology beats alternatives for understanding complex journeys, even when implementation is imperfect.
The complexity drivers are structural:
Cross-Device Journeys
A consumer researches on mobile during their commute, considers options on a work laptop, and converts on a home desktop. Without robust identity resolution, tracking systems see three different people rather than one journey spanning three devices.
The typical consumer uses 3-4 devices during purchase research. For lead generation verticals like mortgage or solar with week-long consideration windows, cross-device fragmentation affects the majority of conversion paths.
Solutions exist but require investment:
- Email-based identity matching (requires authentication)
- Probabilistic matching (statistical inference, less precise)
- Platform-provided identity graphs (limited to single ecosystems)
Privacy Restrictions
Safari’s Intelligent Tracking Prevention blocks third-party cookies entirely. Chrome is phasing out third-party cookies. Apple’s App Tracking Transparency requires explicit opt-in for cross-app tracking. GDPR and state privacy laws restrict data collection and retention.
The result: tracking coverage might reach only 60-70% of actual touchpoints. You’re building attribution models on incomplete data.
Current estimates suggest 30% of web traffic now uses browsers or settings that block standard tracking. That percentage continues growing as privacy features become defaults rather than options.
View-Through Attribution Debates
Did that impression someone saw but didn’t click actually contribute to conversion? Platform self-attribution says yes. A consumer who saw a Facebook ad and converted within seven days gets attributed to Facebook, even if they clicked nothing.
View-through attribution inflates platform-reported performance. Independent measurement studies consistently show lower incremental impact from view-through impressions than platforms claim. The impression may have contributed something – but rarely as much as platform reporting suggests.
Walled Gardens
Facebook knows what happened on Facebook. Google knows what happened on Google. Neither shares complete data with the other, and neither provides you the complete cross-platform picture.
Each platform optimizes for their own measurement. When Facebook and Google both claim credit for the same conversion, your total “attributed” conversions exceed actual conversions. De-duplication requires independent measurement systems that platforms don’t naturally provide.
Incrementality Testing
The limitations of all attribution models drive growing interest in incrementality testing – the practice of measuring what actually changes when you turn marketing on or off.
A 2024-2025 industry report showed 52% of brands and agencies now use incrementality testing, up significantly from prior years. The methodology provides ground truth that attribution models, by design, cannot.
The Concept
Incrementality testing creates comparable test and control groups, exposes only the test group to marketing, and measures the difference in outcomes. The gap represents true incremental lift – conversions that would not have happened without the marketing.
Attribution tells you which touchpoints were present. Incrementality tells you which touchpoints caused change.
Incrementality Testing Methods
Geo experiments compare geographic regions where you advertise versus similar regions where you don’t. If sales increase 15% in test markets and 2% in control markets, you have 13% incremental lift.
Requirements:
- Geographically segmentable markets
- Sufficient volume in each test region
- 4-8 week test duration for reliable results
- Statistical analysis of confidence intervals
Holdout tests randomly exclude a portion of your audience from campaigns and compare their conversion rates to exposed audiences. If the exposed group converts at 4% and the holdout at 3.2%, your incremental lift is 0.8 percentage points (25% relative lift).
Platform lift studies (Meta Conversion Lift, Google Conversion Lift) handle randomization and measurement within their ecosystems, reporting incremental conversions attributable to platform campaigns.
Time-based toggles turn campaigns off for defined periods and measure impact. Simpler to execute but confounds pause effects with organic trends, making isolation of true incrementality difficult.
What Incrementality Reveals
Incrementality testing reveals uncomfortable truths. That retargeting campaign showing 800% ROAS in platform reporting might show 20% incremental lift when properly tested. The difference: most of those “attributed” conversions would have happened anyway.
Consider a remarketing example: Platform reporting shows 1,000 attributed conversions on $6,250 spend (800% ROAS). Incrementality test reveals only 200 of those conversions were truly incremental. True ROAS drops to 160% – still positive, but requiring completely different budget decisions.
Companies implementing proper incrementality measurement have achieved 10-20% improvements in marketing efficiency by reallocating spend from campaigns that look good to campaigns that actually work.
Best Practices for Incrementality Testing
- Test one channel at a time to isolate effects
- Run tests for 4+ weeks to account for variance
- Ensure test and control groups are genuinely comparable
- Calculate statistical significance before drawing conclusions
- Use incrementality alongside (not instead of) attribution models
- Accept that incrementality answers “how much” while attribution answers “through what path”
Choosing the Right Model for Your Business
No attribution model is universally correct. The right choice depends on your business reality, data infrastructure, and decision needs.
Assessment Framework
Question 1: What is your typical consideration window?
- Under 7 days: First-touch and last-touch likely produce similar results. Simpler models suffice.
- 7-30 days: Multi-touch models add value by capturing middle-journey influence.
- Over 30 days: Multi-touch essential; consider W-shaped for B2B or complex B2C. Keep in mind that lead decay affects value across this timeline.
Question 2: What is your monthly conversion volume?
- Under 300: Data insufficient for algorithmic models. Use rule-based multi-touch.
- 300-600: Algorithmic models possible but may be unstable. Test with caution.
- Over 600: Algorithmic models viable if tracking infrastructure supports them.
Question 3: How sophisticated is your tracking infrastructure?
- Basic (platform pixels only): Limited to platform-native attribution. Focus on incrementality testing.
- Intermediate (CDP or unified tracking): Rule-based multi-touch across channels possible.
- Advanced (data warehouse, identity resolution): Algorithmic attribution and cross-channel models viable.
Recommendations by Business Type
Early-stage lead generators (under 1,000 monthly leads): Start with platform-native attribution plus simple incrementality tests (geo or holdout). Focus on understanding channel contribution before investing in complex modeling. Our guide on building your first lead generation business covers foundational tracking requirements. Priority: establish consistent tracking before worrying about sophisticated attribution.
Scaling operations (1,000-10,000 monthly leads): Implement position-based (U-shaped) attribution as baseline. Add incrementality testing for major channels quarterly. Begin building first-party data infrastructure for future algorithmic capability.
Mature operations (10,000+ monthly leads): Deploy algorithmic attribution where data volume supports it. Conduct incrementality testing on every major channel annually. Build custom attribution models reflecting your specific business dynamics.
Multi-Model Approach
Sophisticated operations don’t choose one model. They use multiple models for different purposes:
- Last-touch for daily campaign optimization
- Position-based for monthly budget allocation
- First-touch for demand generation assessment
- Incrementality testing for ground-truth validation
When models tell consistent stories, confidence is high. When they conflict, investigation reveals underlying dynamics that single-model views would miss.
Privacy-Era Attribution: Adapting to Signal Loss
The privacy landscape has fundamentally changed attribution measurement. Safari blocks third-party cookies entirely. Chrome’s Privacy Sandbox has altered cross-site tracking. Apple’s App Tracking Transparency requires explicit opt-in. GDPR, CCPA, and emerging state privacy laws restrict data collection.
This is not a temporary disruption. Privacy-first measurement is the permanent operating environment.
The PRISM Framework for Privacy-Era Attribution
Navigating attribution in a privacy-constrained environment requires the PRISM Framework:
P - Privacy-Compliant Collection. Build consent-based data collection that survives regulatory scrutiny. First-party data with explicit consent provides the foundation for any attribution approach.
R - Resilient Measurement. Design systems that degrade gracefully as signals disappear. If third-party cookies provide 40% of your touchpoint data today, plan for them providing zero.
I - Identity Resolution Innovation. Develop authenticated identity approaches that work across privacy constraints. Email-based identity, device fingerprinting alternatives, and probabilistic matching each have roles.
S - Statistical Modeling. Replace individual-level tracking with aggregate statistical methods where necessary. Media mix modeling and incrementality testing work without individual tracking.
M - Multi-Method Triangulation. Combine multiple imperfect measurement approaches to triangulate toward truth. No single method provides complete visibility; multiple methods together approximate reality.
Signal Loss by Platform and Impact
Understanding where signal loss occurs helps prioritize mitigation efforts:
Safari (ITP): First-party cookies limited to 7 days. Third-party cookies blocked entirely. Link decoration parameters stripped after 24 hours. Impact: 15-25% of web traffic depending on geography, with higher rates in premium demographics.
Chrome (Privacy Sandbox): Third-party cookies deprecated. Topics API replaces interest targeting. Attribution Reporting API provides aggregate conversion data with noise injection. Impact: 65% of web traffic, fundamentally changing cross-site measurement.
iOS (App Tracking Transparency): Cross-app tracking requires explicit opt-in. Only 15-25% of users opt in. SKAdNetwork provides limited postback data with 24-72 hour delays. Impact: 50%+ of mobile traffic, particularly impacting Facebook and similar platforms.
Firefox/Brave/Privacy Browsers: Aggressive blocking of trackers, fingerprinting, and cross-site storage. Impact: 5-10% of traffic but growing, often skewing toward privacy-conscious high-value demographics.
The First-Party Data Imperative
First-party data collected directly from your audience with consent survives privacy restrictions. Building first-party data assets requires investment but provides durable measurement capability.
Email-Based Identity: When users authenticate with email, you gain a consistent identifier spanning sessions and devices. Email becomes the backbone of cross-device attribution in a cookieless world.
Progressive Profiling: Each interaction captures additional first-party data. Form fields, content preferences, and declared interests build identity profiles without third-party tracking.
Customer Data Platforms (CDPs): CDPs unify first-party data across touchpoints, creating identity graphs that power attribution even when third-party data disappears. Segment, mParticle, and Tealium provide infrastructure for first-party data unification.
Value Exchange for Data: Consumers share data when they receive value in return. Personalization, exclusive content, and improved experiences justify data collection in ways that privacy-conscious users accept.
Server-Side Tracking: Reclaiming Lost Signal
Server-side tracking shifts data collection from client browsers to your servers, bypassing many browser-based restrictions.
Implementation Approaches:
Facebook Conversions API sends events server-side, recovering 20-40% of conversions lost to iOS 14+ restrictions. Google Tag Manager Server-Side provides infrastructure for server-side tag deployment across platforms. First-party data becomes the source of truth rather than client-side pixel fires.
Technical Requirements:
Server-side tracking requires infrastructure to collect, process, and forward events. Cloud hosting (AWS, GCP, Azure) provides scalable processing. Event deduplication prevents counting conversions twice when both client and server methods fire. User matching requires consistent identifiers between server and platform systems.
Signal Recovery Estimates:
Properly implemented server-side tracking typically recovers 20-40% of conversions lost to privacy restrictions. Recovery rates vary by platform, audience composition, and implementation quality.
Cross-Device Attribution: Connecting Fragmented Journeys
The average consumer uses 3.6 devices during purchase research. A lead generation journey might begin on a smartphone during commute, continue on a work laptop during lunch, and convert on a home tablet in the evening. Without cross-device attribution, this looks like three unrelated people rather than one journey.
The Device Fragmentation Challenge
Cross-device fragmentation affects attribution in two directions:
Under-Attribution: When you cannot connect touchpoints across devices, you credit only the converting device. The smartphone ad that created awareness gets no credit because conversion happened on tablet.
Over-Attribution: When multiple devices each appear as independent journeys, you might count one conversion as three, inflating total attributed conversions beyond actual conversions.
For lead generation specifically, cross-device fragmentation is particularly acute because:
- Research happens across devices (mobile for discovery, desktop for deeper evaluation)
- Form submission often occurs on the most convenient device, not the device of discovery
- Lead nurture emails are opened on mobile, but clicks redirect to desktop sessions
- Phone calls convert from mobile without web tracking connection
Cross-Device Identity Solutions
Several approaches connect users across devices, each with trade-offs:
Deterministic Matching: Uses logged-in identity to connect devices definitively. When a user logs in on phone and later logs in on desktop, both sessions link to the same identity with 100% confidence. Limitation: requires authentication, which many lead generation journeys lack before conversion.
Probabilistic Matching: Uses signals (IP address, location patterns, browsing behavior) to infer identity connections. A phone and laptop that consistently share IP addresses and exhibit similar browsing patterns likely belong to the same person. Accuracy ranges from 60-80% depending on signal quality.
Declared Matching: Asks users to explicitly connect devices through actions like clicking email links or scanning QR codes. High accuracy but requires user action that interrupts natural behavior.
Platform Identity Graphs: Facebook, Google, and Amazon maintain logged-in identity across devices within their ecosystems. Their attribution reflects cross-device behavior but only within their walled gardens.
The CONNECT Model for Cross-Device Attribution
Implementing cross-device attribution requires the CONNECT Model:
C - Collect Consistent Identifiers. Capture email, phone, and customer ID at every touchpoint. These identifiers enable matching across devices.
O - Orchestrate Identity Resolution. Use CDP or identity resolution platform to match identifiers across sessions and devices. Maintain master identity records that unify touchpoint data.
N - Normalize Touchpoint Data. Standardize event formats, UTM parameters, and timestamp formats across all sources so touchpoints can be stitched into journeys.
N - Navigate Privacy Constraints. Implement consent management that enables identity resolution while respecting user preferences and regulatory requirements.
E - Establish Match Quality Thresholds. Not all matches are equal. Deterministic matches warrant different treatment than probabilistic matches with 65% confidence.
C - Calibrate with Known Truth. Validate cross-device matching against known conversions where full journey is visible. Adjust matching algorithms based on observed accuracy.
T - Triangulate Across Methods. Combine deterministic, probabilistic, and platform-provided matching to maximize coverage while understanding confidence levels.
Cross-Device Attribution Technology Stack
Building cross-device attribution capability requires specific infrastructure:
Identity Resolution Platforms: LiveRamp, Experian, or Merkle provide identity graphs connecting devices to individuals. These platforms match your first-party data against their identity spines.
Customer Data Platforms: Segment, mParticle, or Treasure Data unify first-party data and resolve identity across touchpoints. CDPs provide the foundation for custom cross-device attribution.
Marketing Attribution Platforms: Rockerbox, Northbeam, or Triple Whale provide cross-device attribution as part of broader measurement solutions. These platforms handle identity resolution, touchpoint stitching, and attribution modeling.
Data Clean Rooms: Google Ads Data Hub, Facebook Advanced Analytics, and Amazon Marketing Cloud provide privacy-compliant ways to analyze cross-device behavior within platform ecosystems.
Practical Cross-Device Implementation
For lead generation operations, practical cross-device implementation follows this sequence:
Phase 1: Foundation (Weeks 1-4)
- Implement consistent UTM parameters across all campaigns
- Capture email and phone at form submission
- Deploy enhanced conversion tracking on Google Ads
- Implement Facebook Conversions API with email matching
Phase 2: Identity Unification (Weeks 5-8)
- Deploy CDP or build identity resolution logic
- Connect ad platform data with CRM outcomes
- Establish deterministic matching on authenticated users
- Implement probabilistic matching for anonymous visitors
Phase 3: Attribution Modeling (Weeks 9-12)
- Build cross-device touchpoint stitching
- Implement chosen attribution model on unified data
- Validate attribution against holdout tests
- Create reporting showing cross-device contribution
Phase 4: Optimization (Ongoing)
- Refine matching algorithms based on observed accuracy
- Expand first-party data collection to improve match rates
- Test incrementality to validate attribution accuracy
- Adapt to new privacy constraints as they emerge
Implementation Challenges
Understanding attribution models is necessary. Implementing them successfully is harder.
Privacy and Tracking Degradation
The 30% of traffic using privacy-first browsers or settings represents lost signal. You cannot attribute what you cannot track.
Server-side tracking recovers 20-40% of signals lost to client-side blocking. Implementing server-side event tracking through platforms like Google Tag Manager Server-Side or Facebook Conversions API provides more durable measurement.
First-party data strategies become essential. Every email captured, every phone number collected, every authenticated session extends your ability to connect touchpoints.
Cookie Deprecation
Third-party cookies enable cross-site tracking that multi-touch attribution depends on. Their deprecation is inevitable – Chrome’s timeline has shifted but the direction is clear.
Alternatives in development include Privacy Sandbox APIs, first-party data graphs, and data clean rooms. None provide the coverage that third-party cookies offered. Attribution will become less precise. Incrementality testing becomes more important as ground-truth validation.
Walled Garden Limitations
Each major platform operates as a walled garden with limited data sharing. Attribution within Facebook is straightforward. Attribution across Facebook, Google, TikTok, and your own properties requires stitching together fragmented data.
Strategies for walled garden navigation:
- Implement consistent UTM parameters across all campaigns
- Use landing pages that capture UTM data into lead records
- Build lead-level P&L connecting marketing source to revenue outcome
- Accept that cross-platform attribution will be directional, not precise
For tracking the metrics that matter beyond attribution, see our complete guide to lead generation KPIs and metrics.
Frequently Asked Questions
Q: Which attribution model is best for lead generation? No single model fits all lead generation businesses. For short consideration windows under 7 days, last-touch often provides sufficient accuracy. For longer cycles, position-based (U-shaped) attribution offers good balance between simplicity and accuracy. For high-volume operations with sophisticated tracking, data-driven algorithmic models optimize based on actual patterns.
Q: How does multi-touch attribution differ from first-touch and last-touch? First-touch assigns 100% credit to the initial brand interaction. Last-touch assigns 100% credit to the final interaction before conversion. Multi-touch distributes credit across all touchpoints in the journey, acknowledging that multiple interactions typically influence a conversion.
Q: What is incrementality testing and why is it important? Incrementality testing measures the true causal impact of marketing by comparing outcomes between groups exposed to marketing versus control groups that were not. While attribution tells you which touchpoints were present, incrementality tells you which actually caused conversions. 52% of sophisticated marketers now use it.
Q: How do privacy restrictions affect attribution accuracy? Privacy restrictions – including Safari ITP, Chrome’s cookie deprecation, and App Tracking Transparency – reduce tracking coverage. Current estimates suggest 30% of traffic uses privacy-first browsing. This creates gaps in attribution data. Server-side tracking and first-party data strategies help recover lost signal.
Q: What data do I need for multi-touch attribution? Effective multi-touch attribution requires user-level tracking across touchpoints, consistent UTM parameters, conversion events connected to user identifiers, and 60-90 days of historical data. For algorithmic models, you need 600+ monthly conversions minimum.
Q: Should I use the attribution data from ad platforms? Platform-provided attribution data is useful but biased. Platforms benefit from showing strong performance and use favorable attribution windows. Use platform data for within-platform optimization, but validate with independent measurement for cross-channel budget decisions.
Q: How often should I review attribution data? Daily for anomalies and campaign pacing. Weekly for source-level performance. Monthly for channel allocation decisions. Quarterly for incrementality validation. Annually for model evaluation.
Q: What is the difference between linear and time-decay attribution? Linear splits credit equally across all touchpoints regardless of timing. Time-decay weights recent touchpoints more heavily, with diminishing credit for earlier interactions. Time-decay better reflects consumer behavior where recent exposures typically have more influence.
Q: How do I get started with incrementality testing? Start with a simple geo test or holdout test on your largest channel. For geo testing, identify comparable markets, run ads in test markets only for 4-6 weeks, and compare conversion rates. Begin with your highest-spend channel where budget reallocation would have the largest impact.
Q: What if my attribution models conflict with each other? Conflicting models often reveal important dynamics. When last-touch and first-touch tell different stories, investigate which channels create demand versus capture it. Use the conflict as diagnostic information rather than a problem to resolve.
Key Takeaways
-
Attribution determines budget allocation and margin. Companies using advanced attribution models achieve 15-30% improvement in marketing ROI through more effective spending.
-
First-touch attribution credits the initial brand interaction. It works best for measuring demand generation, short sales cycles, and growth-stage businesses focused on expanding reach.
-
Last-touch attribution credits the final interaction before conversion. It serves conversion optimization needs but dangerously overvalues channels that harvest rather than create demand.
-
Multi-touch models (linear, time-decay, position-based, W-shaped, algorithmic) distribute credit across touchpoints. The majority of brands use multi-touch attribution despite challenges because it beats alternatives.
-
Challenge #122 captures the core difficulty: cross-device journeys, 30% privacy-blocked tracking, and walled gardens create attribution gaps that no model fully solves.
-
Incrementality testing measures true causal impact by comparing exposed and control groups. 52% of sophisticated marketers now use it because attribution shows correlation while incrementality proves causation.
-
Choose your model based on consideration window, conversion volume, and tracking infrastructure. Most mature operations use multiple models for different purposes.
-
Implementation requires addressing privacy degradation through server-side tracking, building first-party data assets, and accepting that cross-platform attribution will be directional rather than precise.
Statistics and methodologies current as of late 2025. Attribution models and privacy regulations evolve continuously; validate current platform capabilities before implementation.