Returns kill more lead businesses than competition does.
That statement sounds dramatic until you run the numbers. A lead generation operation humming along at 8% returns can look entirely different from one struggling at 15%. Same traffic sources. Same buyers. Same vertical. The difference between those two return rates transforms a profitable business into a cash-burning disaster.
most practitioners obsess over CPL, traffic quality, and buyer acquisition. Those matter. But returns represent the hidden variable that reshapes every assumption in your P&L. You can optimize your way to a $30 CPL and sell leads at $50, feeling confident about your $20 margin. Then returns hit. Suddenly that $20 becomes $8, then $5, then you are wondering why the math stopped working.
This guide covers everything you need to know about lead returns: what they are, why they happen, what rates to expect by vertical, and how to systematically reduce them. Those who master return management build sustainable businesses. The ones who ignore it learn expensive lessons.
What Is a Lead Return?
A lead return occurs when a buyer rejects a lead after purchase and requests a refund. The buyer accepted the lead, attempted to work it, and determined it did not meet the agreed-upon quality standards.
Returns differ from rejections. A rejection happens in real-time during the transaction. The lead fails a filter, triggers a duplicate check, or misses a qualification criterion. The buyer never accepts it. No money changes hands.
Returns happen after acceptance. The buyer paid. The lead entered their system. Then something went wrong.
The Mechanics of a Return
The return process follows a predictable pattern:
-
Lead Delivery: You deliver the lead. The buyer’s system accepts it. Payment is initiated or logged.
-
Work Attempt: The buyer attempts to contact the consumer. Their sales team calls, texts, or emails according to their workflow.
-
Problem Identification: Something fails. The phone number disconnects. The consumer denies submitting a request. The data does not match stated criteria.
-
Return Request: The buyer submits a return through your portal, via email, or through your distribution platform’s return system.
-
Dispute Review: You evaluate the return against your return policy. Valid returns get credited. Invalid claims get disputed.
-
Credit Processing: For valid returns, you issue a credit or refund to the buyer. Your revenue decreases. Your supplier still expects payment.
The timing matters enormously. Most return windows span 24 to 72 hours for real-time leads and 7 to 14 days for aged inventory. Every return that comes in represents a lead you already paid your supplier for, already counted as revenue, and now must reverse.
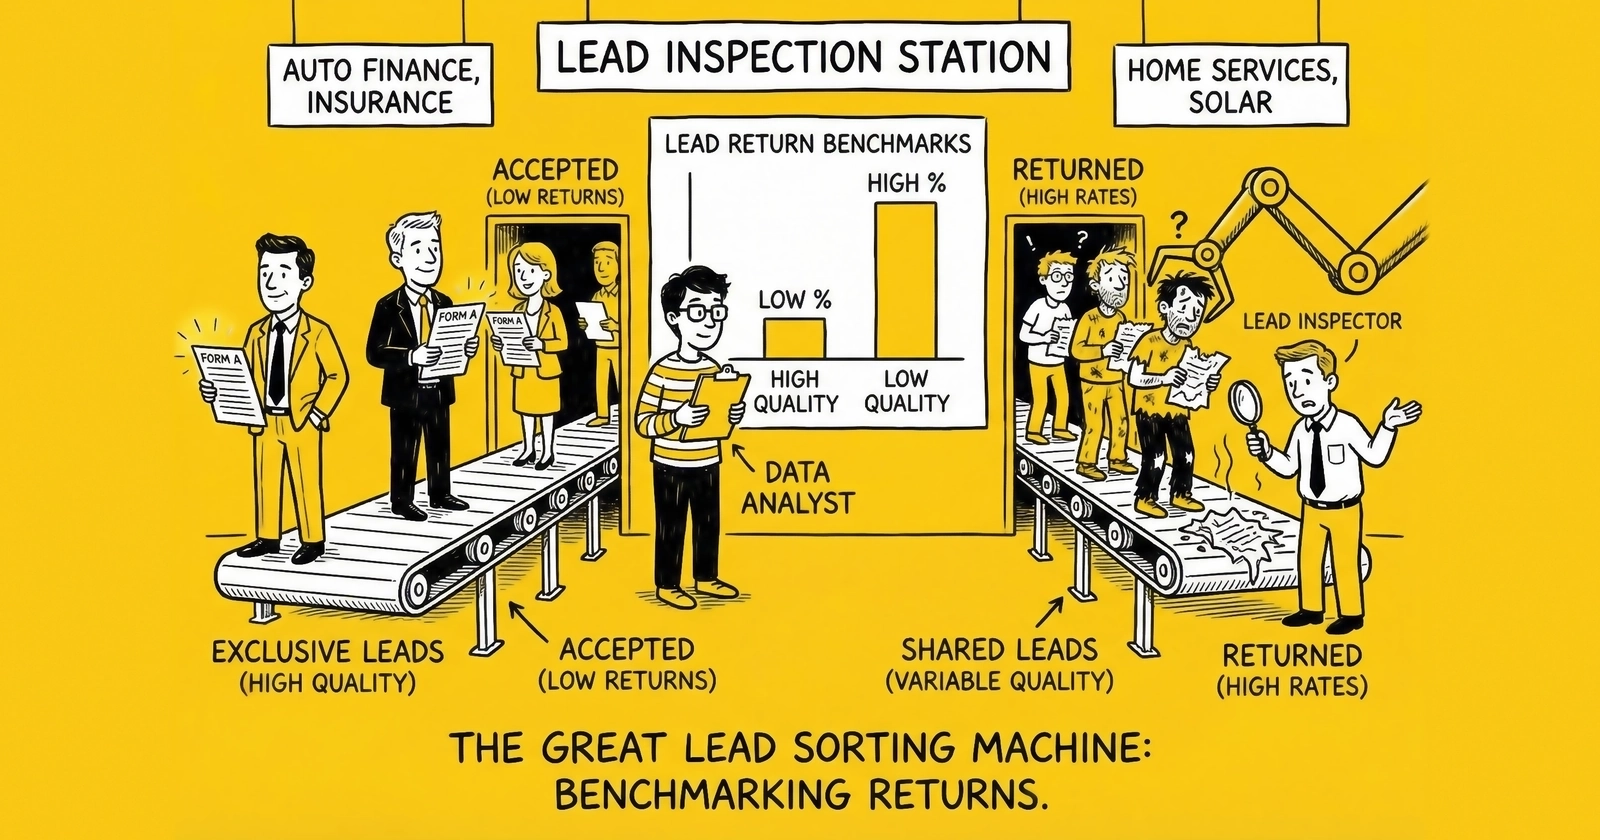
Return Rate Benchmarks by Vertical
Return rates vary dramatically across verticals. Understanding your benchmark helps you assess whether your operation is performing normally or bleeding money unnecessarily.
Auto Insurance: 8-15%
Auto insurance leads sit at the lower end of return rates for several reasons. The qualification criteria are relatively straightforward: vehicle information, driver details, coverage needs. Phone verification technology works well for this data set, and buyers have established processes for working these leads quickly.
A well-run auto insurance operation targets the 8-10% range. Rates above 12% signal problems with data quality or source management. At 15%, margins become thin for most practitioners.
Medicare: 12-20%
Medicare leads carry higher return rates due to compliance complexity and the demographic involved. Seniors may not remember requesting information, family members sometimes submit on behalf of parents, and the Annual Enrollment Period creates volume spikes that stress quality controls.
Strong Medicare lead generators maintain 12-15% returns during open enrollment. Off-season rates often climb as lead quality becomes harder to verify. Operations running above 18% should audit their sources immediately.
Solar: 15-25%
Solar leads experience the highest return rates among major verticals. The qualification requirements are demanding: homeownership verification, roof condition, sun exposure, utility costs, and creditworthiness. Geographic constraints add complexity since a lead from a shaded lot or an area without installer coverage cannot convert regardless of consumer intent.
Top solar lead generators achieve 15-18% returns through aggressive pre-qualification. Operations at 20% or higher often struggle with geographic targeting or homeownership verification. At 25%, the business model becomes nearly impossible without premium pricing.
Mortgage: 10-18%
Mortgage leads sit in the middle range, with return rates tied closely to rate environments and property verification. When rates drop and volume surges, quality controls often slip. When rates rise and volume contracts, buyers become more aggressive about returning marginal leads.
Steady operations maintain 10-14% returns. Rate-sensitive periods can push returns to 16-18% temporarily. Persistent rates above 15% indicate fundamental source or qualification issues.
Legal: 5-12%
Legal leads maintain the lowest return rates in most categories. The high value of legal leads, often $100-500+ for personal injury or mass tort, creates strong incentives for careful pre-qualification. Intake specialists at law firms are also generally more thorough in their contact attempts before returning leads.
Quality legal lead operations run 5-8% returns. Rates above 10% suggest problems with case qualification or consent documentation. Mass tort leads may see slightly higher rates due to statute of limitations issues or geographic restrictions.
Why Leads Get Returned
Every return has a root cause. Understanding these causes helps you address problems systematically rather than reactively.
Contact Failure
The buyer cannot reach the consumer. This manifests in several ways:
-
Disconnected Numbers: The phone number is no longer in service. This happens more frequently than most practitioners expect. Proper phone validation catches many of these before delivery. Consumers change numbers, enter digits incorrectly, or provide old numbers intentionally.
-
Wrong Numbers: The number belongs to someone else. Data entry errors, transposition mistakes, and deliberately incorrect submissions all contribute.
-
Unreachable Consumers: The number works, but the consumer never answers. Extended attempts yield voicemail only. This gray area causes disputes since the lead may be technically valid but practically worthless.
Contact failure accounts for 30-40% of returns in most verticals. Real-time phone verification reduces this category significantly but does not eliminate it entirely.
Qualification Mismatch
The lead does not meet the buyer’s stated criteria. Common scenarios include:
-
Geographic Mismatch: The consumer’s location falls outside the buyer’s service area. This happens when zip code data is incorrect or when buyers have complex geographic restrictions that standard routing does not capture.
-
Criteria Discrepancy: The consumer’s stated situation does not match what they told the buyer. Income levels, credit ranges, homeownership status, or other key qualifiers turn out to be inaccurate.
-
Intent Mismatch: The consumer was researching, not actively shopping. They filled out a form for information but have no current purchase intent.
Qualification mismatches represent 25-35% of returns. Tighter pre-qualification reduces this category but also reduces volume. The tradeoff requires careful calibration.
Duplicates
The buyer already has this consumer in their system. They purchased the same lead previously from you or from another source. Duplicate policies vary widely:
-
Absolute Duplicates: Same consumer submitted multiple times in a short window. Most systems catch these.
-
Rolling Duplicates: Same consumer submitted weeks or months apart. Detection depends on how long buyers maintain suppression files.
-
Cross-Source Duplicates: Consumer appears in buyer’s system from a different lead source. You did not sell them a duplicate, but they already have the lead.
Duplicates cause 15-20% of returns in typical operations. Robust deduplication against buyer suppression files before delivery reduces this substantially.
Fraud
The lead is fabricated or incentivized. Fraud takes multiple forms:
-
Bot Submissions: Automated systems generate fake leads at scale. Sophisticated bots can bypass basic validation.
-
Incentivized Submissions: Consumers complete forms for rewards without genuine interest. Survey sites, cashback offers, and lead aggregators with loose quality standards feed this problem.
-
Identity Misrepresentation: Real contact information, but the consumer did not submit the request. Someone else used their data.
Fraud accounts for 10-20% of returns depending on traffic sources. High-risk sources like incentivized offer walls, social media sweepstakes, and bottom-tier affiliate traffic elevate fraud rates significantly.
The Financial Impact of Returns
Returns do not just reduce revenue. They amplify costs and compress margins in ways that make the true impact far worse than the headline percentage suggests.
A Worked Example
Consider a lead broker buying at $30 and selling at $50:
Baseline Assumptions:
- Daily volume: 100 leads
- Purchase cost: $3,000/day
- Gross revenue: $5,000/day
- Gross margin: $2,000/day (40%)
At 8% Returns:
- Returns: 8 leads
- Revenue reduction: $400
- But you still paid for those leads: $240
- Net margin: $1,600/day
- Effective margin: 32%
At 15% Returns:
- Returns: 15 leads
- Revenue reduction: $750
- But you still paid for those leads: $450
- Net margin: $1,250/day
- Effective margin: 25%
The swing from 8% to 15% returns represents a 22% reduction in net margin. That is the difference between a healthy business and one fighting for survival.
Hidden Costs
The direct revenue impact understates the true cost of returns:
Processing Time: Every return requires investigation. Someone reviews the return reason, checks the data, decides whether to accept or dispute, and processes the credit. At 15 minutes per return and $25/hour loaded labor cost, each return costs $6.25 in processing alone.
Supplier Relationships: High return rates strain supplier relationships. Suppliers may require pre-payment, reduce credit terms, or terminate partnerships with operators who return too many leads upstream.
Buyer Confidence: Buyers track return rates by source. High returns lead to reduced bids, lower caps, and eventual termination. Losing a quality buyer costs far more than any individual return. Strong buyer relationships are the foundation of sustainable lead businesses.
Cash Flow Stress: Returns often arrive after you have paid suppliers but before you have collected from buyers. The 60-day float rule explains why this cash flow timing mismatch amplifies as return rates increase.
Return Rate by Lead Source
Aggregate return rates mask critical source-level variation. One traffic source running 25% returns can destroy the economics of an operation averaging 12%.
Why Source-Level Tracking Matters
Your overall return rate is a blended average. That average hides the fact that Source A runs 6% returns while Source B runs 22%. Treating them identically guarantees suboptimal outcomes.
Source-level return tracking enables:
Performance-Based Pricing: Pay sources based on actual sellable lead rates, not gross lead volume. A source delivering leads at $35 with 8% returns outperforms one delivering at $28 with 18% returns.
Quality-Based Routing: Route leads from proven sources to premium buyers. Send questionable traffic to buyers with more lenient quality standards or lower prices.
Termination Decisions: Identify and eliminate sources that consistently underperform. One bad source can contaminate buyer relationships across your entire operation.
Implementation Requirements
Track return rates by source with the following data points:
- Source ID and name
- Vertical and sub-vertical
- Time period (rolling 7-day, 30-day, and 90-day windows)
- Return count and return rate
- Return reason breakdown
- Revenue impact (returns x average sale price)
Most lead distribution platforms provide source-level reporting. If yours does not, build it. Manual spreadsheet tracking is acceptable for small operations but becomes unwieldy above 20-30 sources.
Reducing Returns: Pre-Delivery Tactics
The most cost-effective return reduction happens before you ever deliver a lead. Every lead you catch and filter costs you the acquisition cost. Every lead that gets returned costs you the acquisition cost plus the processing time plus the buyer relationship damage.
Real-Time Phone Verification
Phone verification calls the submitted number during the form completion process. The consumer receives a call or text and must confirm their request. This single tactic reduces contact failure returns by 40-60%.
Implementation Options:
- Integrated verification APIs (Jornaya, TrustedForm, ActiveProspect)
- Standalone phone verification services
- Custom IVR verification systems
Cost Tradeoffs:
- Verification costs $0.02-0.10 per attempt
- Verification drops conversion rates 10-25%
- Net economics usually favor verification for leads above $30
Email Verification
Email verification confirms the submitted address is valid and deliverable. This catches typos, fake domains, and disposable email addresses.
What to Verify:
- Syntax validity
- Domain existence
- Mailbox existence
- Disposable email detection
- Role account detection (info@, support@)
Identity Verification
For higher-value leads, verify that the consumer’s information matches external databases:
- Name and address matching
- Phone-to-name association
- Homeownership verification (critical for solar, mortgage)
- Vehicle ownership confirmation (auto insurance)
Fraud Detection
Deploy fraud detection scoring before delivery:
- IP address analysis (proxies, data centers, geographic mismatches)
- Device fingerprinting
- Behavioral analytics (form completion speed, mouse movements)
- Known fraud list checking
A multi-layered approach combining several fraud detection methods catches more fraud than any single technique.
Source Qualification
Not all traffic is equal. Qualify your sources before they generate significant volume:
New Source Protocol:
- Test with small caps (10-20 leads)
- Track return rates for full return window plus buffer
- Require 30+ leads before statistical significance
- Graduate sources through quality tiers based on performance
Ongoing Source Management:
- Weekly return rate reviews by source
- Automatic cap reductions for sources exceeding thresholds
- Rapid termination for fraud detection
Reducing Returns: Buyer Communication
Many returns stem from misaligned expectations rather than genuinely bad leads. Clear communication with buyers reduces disputes and builds lasting relationships.
Setting Accurate Expectations
Tell buyers exactly what they are purchasing:
-
Traffic Source Transparency: Describe your traffic sources in general terms. “Search intent with landing page capture” sets different expectations than “social media lead generation.”
-
Qualification Standards: Document precisely what qualifies a lead. List every field, every validation check, every filter. Ambiguity creates disputes.
-
Performance History: Share historical return rates and contact rates. A buyer who expects 12% returns and receives 14% reacts differently than one who expected 5%.
Return Window Alignment
Ensure your return window with buyers matches your window with suppliers:
Standard Practice:
- Offer buyers 24-72 hours for real-time leads
- Maintain a buffer with suppliers (if you offer 48 hours, ensure your supplier offers 72)
- Document return windows explicitly in contracts
Aged Lead Considerations:
- Longer windows for aged inventory (7-14 days common)
- Clear communication about expected contact rates
- Pricing that reflects aged lead economics
Dispute Resolution Process
Establish a clear process for contested returns:
- Initial Review: Check return against stated policy criteria
- Evidence Request: Ask buyer for documentation supporting return reason
- Counter-Evidence: Provide your validation records if disputing
- Resolution Timeline: Commit to resolving disputes within 48-72 hours
- Escalation Path: Define who handles disputes that cannot be resolved at first level
A well-documented process reduces conflict and builds trust even when you deny return requests.
Negotiating Return Policies
Return policies are negotiable. The terms you accept directly impact your margins and risk exposure.
Return Windows
Shorter windows favor sellers. Longer windows favor buyers.
Typical Ranges:
- Real-time leads: 24-72 hours
- Aged leads: 7-14 days
- Call transfers: 24 hours or same-day
Negotiation Leverage:
- High-quality sources justify shorter windows
- Volume commitments can secure longer windows for buyers
- Premium pricing often accompanies tighter return windows
Return Caps
Caps limit total returns regardless of legitimacy:
Monthly Caps: “Returns shall not exceed 10% of monthly volume regardless of cause.” This protects sellers from catastrophic return scenarios.
Rolling Caps: Returns exceeding threshold in any rolling period trigger review or policy adjustment.
Uncapped Risk: Avoid uncapped return policies with new buyers. Even legitimate issues can generate unsustainable return volumes.
Return Reasons
Define acceptable return reasons explicitly:
Commonly Accepted:
- Disconnected phone number
- Wrong number (different person answers)
- Consumer denies submitting request
- Duplicate (with documentation)
- Does not meet stated qualification criteria
Commonly Disputed:
- No answer after attempts (timing matters)
- Consumer “not interested” (different from fraud)
- Contact rate too low (operational, not quality)
Explicitly Excluded:
- Buyer capacity issues
- Operational problems on buyer side
- Subjective quality assessments
Documentation Requirements
Require documentation for return requests:
- Call recordings demonstrating contact attempt
- Screenshots showing duplicate evidence
- Notes documenting consumer denial or qualification failure
Documentation requirements discourage frivolous returns and provide evidence for dispute resolution.
Monitoring and Reporting Return Trends
Systematic monitoring catches problems before they become catastrophic. Ad hoc tracking lets issues compound until margins collapse.
Daily Monitoring
Review every day:
- Total returns by volume and rate
- Returns by buyer (identify buyers with sudden spikes)
- Returns by source (identify sources with sudden spikes)
- Returns by reason code (identify emerging patterns)
Weekly Analysis
Conduct deeper analysis weekly:
- Trend lines by source and buyer
- Return reason distribution changes
- Financial impact calculation
- Source qualification decisions
Monthly Strategic Review
Monthly reviews inform strategic decisions:
- Source portfolio optimization
- Buyer relationship assessments
- Policy adjustment needs
- Pricing recalibration
Alert Thresholds
Configure automated alerts for:
- Source exceeding 2x normal return rate
- Buyer return rate exceeding cap threshold
- Single-day return volume exceeding historical norms
- New return reason appearing in volume
Frequently Asked Questions
What is a lead return rate and how is it calculated?
A lead return rate measures the percentage of delivered leads that buyers reject after purchase and request refunds for. Calculate it by dividing the number of returned leads by the total leads delivered in the same period, then multiplying by 100. For example, if you deliver 500 leads and 50 get returned, your return rate is 10%. Track this metric on rolling 7-day, 30-day, and 90-day windows to identify trends and seasonal patterns.
What causes high lead return rates in lead generation?
High return rates stem from four primary causes: contact failure (disconnected or wrong phone numbers), qualification mismatches (leads that do not meet buyer criteria), duplicates (consumers already in buyer systems), and fraud (bot submissions or incentivized traffic). Contact failure alone accounts for 30-40% of returns in most verticals. Identifying which cause dominates your returns determines the appropriate remediation strategy.
How do lead return rates vary by industry vertical?
Return rates differ substantially across verticals based on qualification complexity. Legal leads maintain the lowest rates at 5-12% due to high values and thorough intake processes. Auto insurance runs 8-15% with straightforward qualification criteria. Mortgage sits at 10-18%, influenced by interest rate environments. Medicare leads range 12-20% due to compliance requirements and the senior demographic. Solar experiences the highest rates at 15-25% because of demanding homeownership, geographic, and credit qualifications.
What is the difference between a lead return and a lead rejection?
A rejection occurs in real-time during the transaction when a lead fails filters, triggers duplicate checks, or misses qualification criteria before the buyer accepts it. No payment occurs. A return happens after acceptance when the buyer has already paid, worked the lead, and identified a problem warranting a refund. Returns cost significantly more because you have already paid your supplier, counted the revenue, and now must reverse the transaction while absorbing acquisition costs.
How does phone verification reduce lead return rates?
Real-time phone verification calls or texts the consumer during form completion, requiring them to confirm their request before submission completes. This single tactic reduces contact failure returns by 40-60%. Verification costs $0.02-0.10 per attempt and typically drops conversion rates 10-25%, but the net economics favor verification for leads valued above $30. Integrated options include Jornaya, TrustedForm, and ActiveProspect APIs.
What return rate should trigger immediate action?
Any rate exceeding twice your vertical benchmark warrants immediate investigation. For auto insurance, that threshold is approximately 20%. For solar, it is 35-40%. Single sources exceeding 2x their historical average require instant attention regardless of absolute numbers. Implement automated alerts for sources exceeding return thresholds, single-day volumes above historical norms, and new return reasons appearing in significant numbers.
How should lead return policies be structured in buyer contracts?
Effective return policies specify return windows (24-72 hours for real-time leads, 7-14 days for aged leads), acceptable return reasons (disconnected numbers, duplicates with documentation, qualification failures), excluded reasons (buyer capacity issues, subjective quality assessments), documentation requirements (call recordings, duplicate evidence), and monthly caps (typically 10-15% of volume). Ensure your buyer window is shorter than your supplier window to maintain a buffer for upstream returns.
What is the financial impact of a 5% increase in return rates?
A 5% return rate increase compresses margins disproportionately. For a broker buying at $30 and selling at $50 with 100 daily leads, moving from 10% to 15% returns reduces net daily margin from $1,550 to $1,300, a 16% profit reduction. Beyond direct revenue impact, factor processing costs ($6.25 per return at 15 minutes per return), supplier relationship strain, buyer confidence erosion, and cash flow timing mismatches where returns arrive after supplier payments.
How do I reduce returns from specific underperforming traffic sources?
First, implement source-level return tracking to identify which sources exceed acceptable thresholds. For underperforming sources, apply a graduated response: reduce caps to limit exposure, require additional validation steps for that source’s leads, negotiate performance-based pricing that accounts for return rates, or terminate sources that consistently exceed benchmarks. New sources should follow a qualification protocol with small initial caps (10-20 leads), full return window tracking, and tier-based graduation.
What documentation should I maintain for lead return disputes?
Maintain validation records including phone verification results, email verification confirmations, IP address data, device fingerprints, form completion timestamps, and consent documentation. When disputing returns, provide this evidence to counter buyer claims. When accepting returns, require buyers to submit call recordings, duplicate evidence screenshots, and notes documenting consumer denial or qualification failure. A documented process with 48-72 hour resolution timelines builds trust even when disputes go against one party.
Key Takeaways
Returns destroy margins faster than any other operational factor. A swing from 8% to 15% returns can transform a profitable operation into a loss-making one without any change in traffic quality, pricing, or buyer mix.
Benchmark your vertical before panicking or celebrating. An 18% return rate is catastrophic for auto insurance but acceptable for solar. Know your industry standard and measure performance against it.
Source-level tracking is non-negotiable. Aggregate return rates hide critical variation. One underperforming source can destroy overall economics while remaining invisible in blended reporting.
Pre-delivery validation reduces returns more cost-effectively than post-delivery recovery. Catching a bad lead before delivery costs you the acquisition price. Catching it after delivery costs you the acquisition price plus processing plus relationship damage.
Communicate clearly with buyers about expectations, return policies, and dispute resolution. Many returns stem from misalignment rather than actual quality problems. Explicit documentation prevents conflicts.
Monitor daily, analyze weekly, strategize monthly. Systematic monitoring catches problems early. Ad hoc tracking allows issues to compound until intervention becomes desperate rather than proactive.
Negotiate return caps into buyer contracts. Uncapped return policies expose you to unlimited downside risk. Even legitimate quality issues can generate unsustainable return volumes without caps.
Accept valid returns quickly and dispute invalid ones firmly. Building trust with buyers requires honesty in both directions. Accept what you should, dispute what you should not, and document everything.
Return management separates sustainable lead businesses from those that cycle through boom-and-bust patterns. Those who master returns build operations that compound over time. The ones who ignore returns wonder why growth never translates to profit.