Solar loans, leases, power purchase agreements, and the financing comparison knowledge that transforms tire-kickers into qualified prospects – updated for 2026 following the elimination of the residential federal ITC. Understanding financing options is the difference between generating leads that close and wasting installer time.
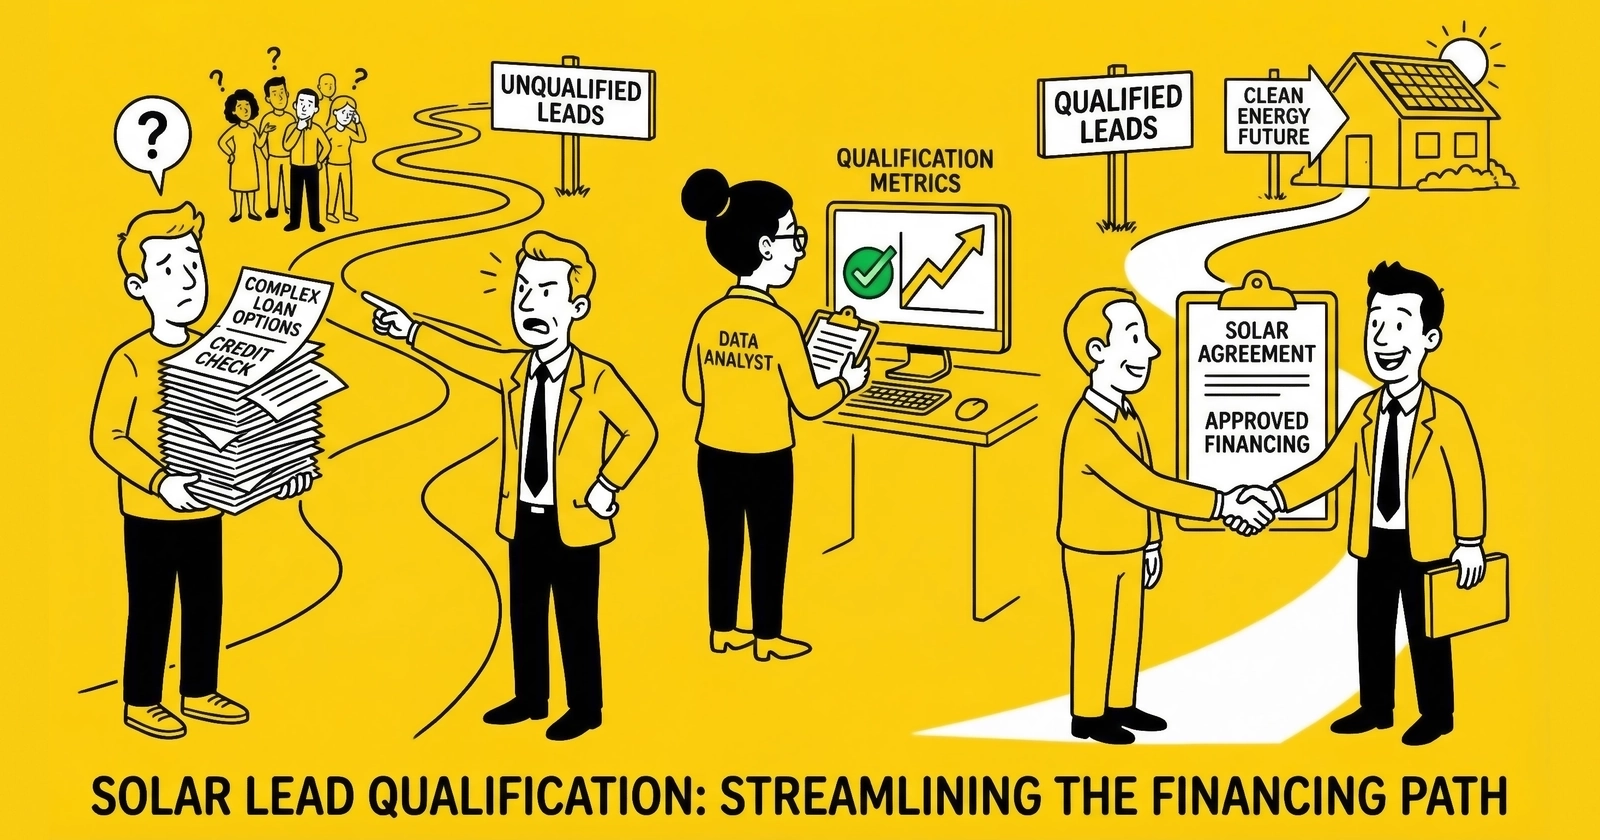
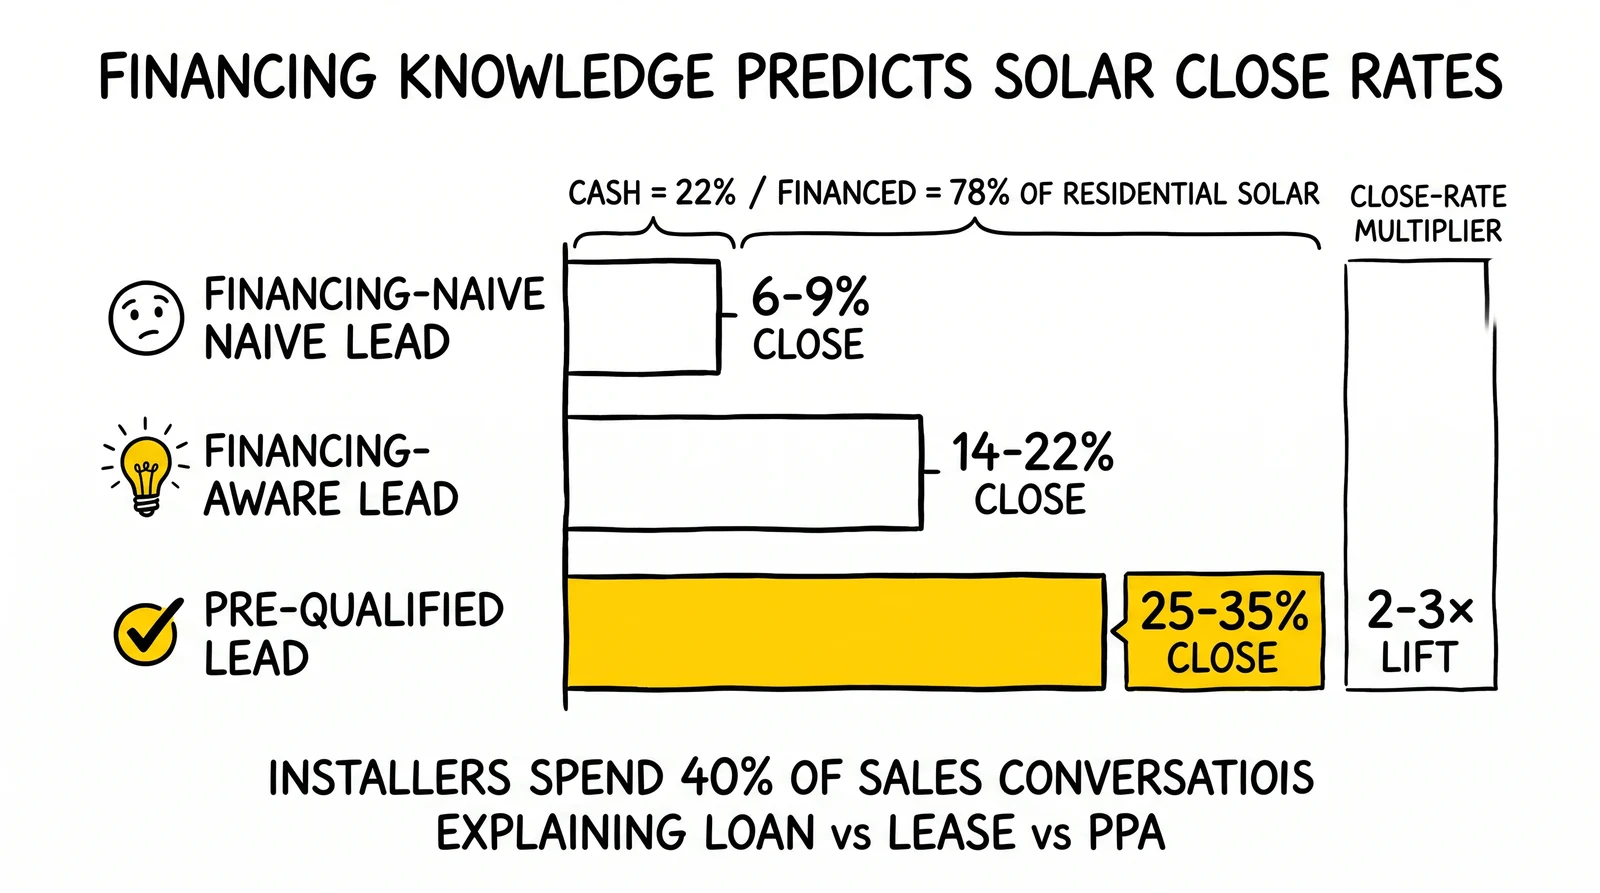
The financing question kills more solar deals than any other objection. A homeowner who wants solar, qualifies for solar, and lives in the right geography still walks away when they cannot navigate the financing maze. Cash purchases represent only 22% of residential solar transactions. The remaining 78% require financing decisions that most consumers find overwhelming.
For lead generators, this reality creates both challenge and opportunity. Leads who understand their financing options convert at 2-3x the rate of those who do not. Yet most solar lead forms ask about monthly electric bills while ignoring the financing knowledge that actually predicts close rates. The installers buying your leads spend 40% of their sales conversations explaining loan versus lease versus PPA. That education should happen earlier in the funnel.
This guide provides the complete framework for solar financing: loan structures and current rates, lease mechanics and escalators, power purchase agreements and their hidden terms, the federal tax credit implications for each option, and the qualification framework that separates closeable leads from educational conversations. Every number comes from current market data. Every recommendation comes from operational experience working with installers who have explained these options thousands of times.
Understanding this material transforms lead generation strategy. When you know what financing questions to ask, which answers indicate buying readiness, and how to route leads based on their financing fit, your conversion rates improve and your buyer relationships strengthen.
The Solar Financing Landscape in 2024-2025
The residential solar financing market has evolved dramatically since the industry’s early days when cash purchases dominated. Today’s market offers four primary financing paths, each with distinct economics, ownership structures, and qualification requirements.
Current Market Distribution
Based on EnergySage marketplace data and installer surveys, the 2024-2025 residential solar financing mix reveals clear preferences across the industry.
| Financing Type | Market Share | Trend |
|---|---|---|
| Solar Loans | 52-58% | Stable |
| Leases | 15-20% | Declining |
| Power Purchase Agreements | 12-18% | Stable |
| Cash Purchases | 18-22% | Growing |
This distribution varies significantly by geography. California’s mature market shows higher cash purchase rates of approximately 28% from repeat buyers and equity-rich homeowners. Texas sees higher loan percentages around 65%, reflecting younger demographics and mortgage comfort. Florida demonstrates elevated PPA adoption due to aggressive third-party financing marketing. State-by-state solar CPL pricing varies dramatically based on these market dynamics.
The trend toward loans over leases reflects consumer education. As homeowners learn that ownership captures tax credits and builds equity, they prefer borrowing to renting. Leases remain relevant for credit-challenged consumers and those who value simplicity over optimization.
The Cost of a Typical Solar System
Understanding system costs provides context for financing decisions. Based on EnergySage data, the 2024-2025 residential solar market shows average system sizes of 10-12 kW that accommodate typical 1,500-2,000 square foot homes. Cost per watt runs $2.48-$3.00 installed, with a median of $2.73. This translates to typical system costs of $25,000-$36,000 before incentives.
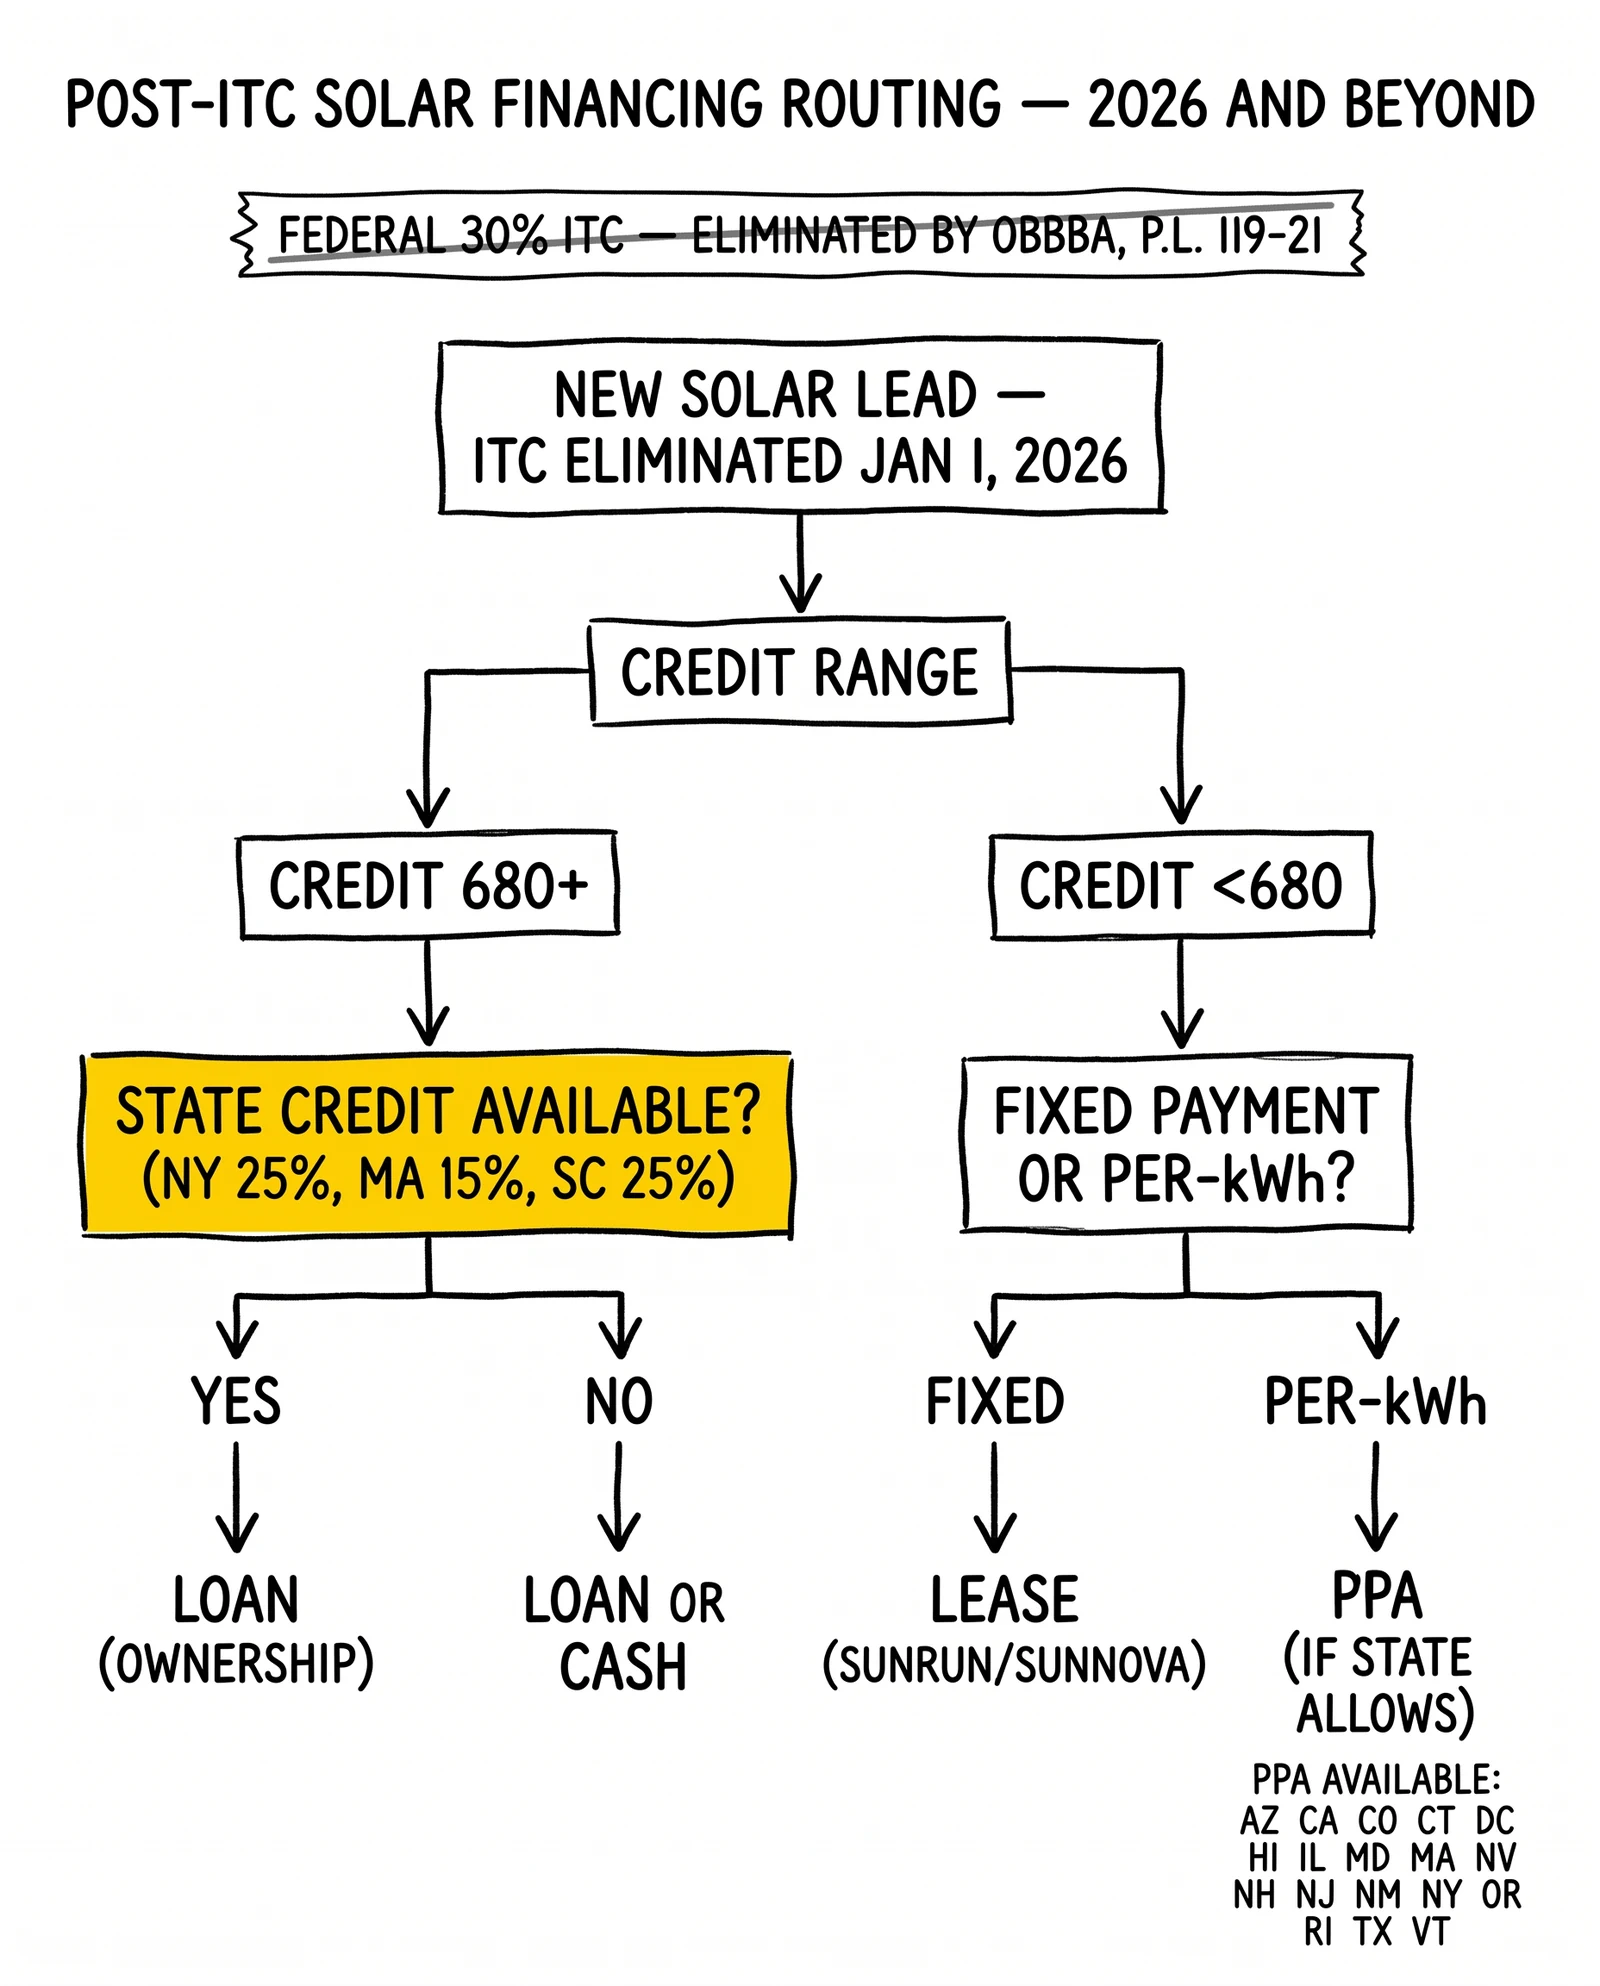
Federal ITC eliminated for 2026 installations: The 30% federal Investment Tax Credit was eliminated for residential solar systems placed in service after December 31, 2025, by the One Big Beautiful Bill Act (Public Law 119-21, signed July 4, 2025). Systems installed and placed in service on or before December 31, 2025 qualified for $7,500-$10,800 in federal savings on typical system sizes. Systems placed in service in 2026 and beyond do not qualify. State and local incentives vary; check dsireusa.org for current availability in each market. Commercial solar projects retain different credit schedules under separate IRS provisions.
A homeowner with a 12 kW system at $2.73 per watt faces a $32,760 gross cost. Monthly loan payments on that full amount – without a federal credit offset – determine whether the economics work in 2026 and beyond.
Why Financing Knowledge Matters for Lead Quality
Installers report that financing-aware leads close at dramatically higher rates. Financing-naive leads achieve only 6-9% close rates, while financing-aware leads reach 14-22%. Pre-qualified financing leads perform best, closing at 25-35%.
The gap exists because financing-naive leads waste 40-60 minutes of sales time on education before discovering they either cannot qualify or do not like their options. Many walk away feeling overwhelmed rather than informed. Leads who already understand their financing fit arrive ready to discuss system design rather than loan terms.
For lead generators, this insight suggests form design changes. Adding financing preference questions does not reduce conversion rates if done correctly. Instead, it improves lead quality scores and justifies premium pricing to buyers who value pre-qualified prospects. Understanding solar lead qualification factors like roof ownership and shading further improves lead quality.
Solar Loans: The Ownership Path
Solar loans enable homeowners to purchase and own their systems while spreading costs over time. This is the dominant financing method and the option most installers prefer to sell.
How Solar Loans Work
A solar loan functions like any secured or unsecured installment loan. The homeowner borrows the system cost, makes monthly payments over 5-25 years, and owns the system from day one. Unlike a home equity loan, most solar-specific loans use the equipment itself as collateral rather than the home.
Ownership Benefits
Ownership through a solar loan delivers several distinct advantages. For systems installed before December 31, 2025, homeowners received full federal tax credit eligibility at 30%. For systems installed in 2026 and beyond, the residential federal ITC no longer applies following the One Big Beautiful Bill Act (Public Law 119-21). State and local incentives vary by geography and remain available in many markets. Research from Lawrence Berkeley National Lab demonstrates that solar systems increase home values by an average of $4 per watt premium. Once the loan payments end, there are no ongoing costs, and the system can be sold with the home as an asset rather than a liability.
The economic case for solar loans becomes clear when comparing 25-year costs. An owned system generates electricity for 25-30 years. Loan payments end after 5-25 years depending on term. The post-payoff years represent pure savings.
Current Solar Loan Rates and Terms
Solar loan rates in 2024-2025 reflect the broader interest rate environment. After years of aggressive dealer fee buydowns that created artificially low advertised rates, the market has normalized to more transparent pricing.
| Loan Type | APR Range | Typical Term | Down Payment |
|---|---|---|---|
| Unsecured solar loan | 6.5-12.9% | 10-25 years | $0 |
| Secured solar loan | 4.9-8.9% | 10-25 years | $0 |
| HELOC (home equity) | 7.5-10.5% | 10-20 years | $0 |
| Home equity loan | 7.0-9.5% | 10-20 years | $0 |
| Personal loan | 8.9-17.9% | 3-7 years | $0 |
The Dealer Fee Reality
Many solar loans advertise rates of 0.99% to 2.99% APR. These rates exist through dealer fee buydowns where the installer pays 15-30% of the loan amount upfront to reduce the interest rate. This fee gets added to the system price. A $30,000 system with a 25% dealer fee becomes a $37,500 loan at a low rate. The effective APR considering the inflated principal often exceeds 8-10%.
Sophisticated consumers recognize this structure. Lead forms that ask “Do you prefer lower interest rates or lower system prices?” help identify which leads are education-ready versus needing guidance.
Loan Qualification Requirements
Solar loan approval depends on standard creditworthiness factors, with credit score serving as the primary gatekeeper. Borrowers with scores of 720 and above receive the best rates with all options available. Scores of 680-719 qualify for standard rates with most options. The 650-679 range faces higher rates and reduced options. Borrowers below 650 encounter subprime rates, limited options, and potential denial.
Beyond credit scores, most solar lenders require debt-to-income ratios below 45%, though some allow up to 50% for high-credit borrowers. Homeownership verification is required for all solar loans, with property database matches confirming ownership before approval. Stable employment history and verifiable income round out the requirements, with self-employed borrowers facing additional documentation hurdles.
For lead generators, credit self-attestation questions filter obvious non-qualifiers. Asking leads to confirm “good” or “fair” credit reduces downstream disappointment without requiring hard credit pulls at the form level.
The Tax Credit Advantage (Historical – No Longer Available for New Installations)
The 30% federal Investment Tax Credit was a primary financial advantage of ownership over leasing for systems installed through December 31, 2025. The One Big Beautiful Bill Act (Public Law 119-21, signed July 4, 2025) eliminated the residential ITC for systems placed in service in 2026 and beyond.
For historical context relevant to leads with systems already installed: the credit required the taxpayer to own the system through either cash purchase or loan financing. The credit was nonrefundable but carried forward to future tax years. Rebates and utility incentives reduced the credit-eligible basis.
For systems installed in 2026 and beyond, the federal tax credit is no longer a factor in the loan-versus-lease decision. State and local incentives – which vary significantly by market – remain the relevant incentive layer and should be incorporated into financing comparisons. Check your state energy office or DSIRE (dsireusa.org) for current state-level incentives.
Positive Cash Flow Potential
The solar industry markets “positive cash flow from day one” scenarios where monthly loan payments are less than monthly electricity savings. This outcome is possible but depends on several variables.
Achieving positive cash flow requires high electricity rates of $0.15 or more per kWh, moderate system costs in the $2.50-2.75 per watt range, reasonable loan rates below 7%, systems sized to offset 80-100% of usage, and longer loan terms of 20-25 years. When these factors align, homeowners can save money from the first month.
A positive cash flow example demonstrates the economics: a homeowner with a current electric bill of $200 per month installs a system costing $28,000. With loan terms of 25 years at 5.9% APR, monthly payments come to $179, generating net monthly savings of $21 and annual positive cash flow of $252.
However, the math does not always work. Consider a homeowner with a current electric bill of only $150 per month who installs a system costing $32,000. With loan terms of 15 years at 8.5% APR, monthly payments reach $315, resulting in a net monthly cost of $165.
The math illustrates why electric bill amount matters so much for qualification. Leads with $150+ monthly bills in markets with moderate system costs can achieve positive cash flow. Leads with $80 monthly bills cannot make ownership economics work regardless of financing terms.
Solar Leases: Simplicity at a Cost
Solar leases offer a fundamentally different value proposition: simplicity and predictability in exchange for reduced long-term savings. The homeowner pays a fixed monthly amount to use solar equipment owned by a financing company.
How Solar Leases Work
In a solar lease, a third-party owner such as Sunrun or Sunnova installs a system on the homeowner’s roof and retains ownership. The homeowner makes fixed monthly payments for the right to use the electricity the system generates. At the end of the lease term, typically 20-25 years, the homeowner may have options to purchase the system, renew the lease, or have the equipment removed.
Leases share several key characteristics. They require zero upfront cost and feature fixed monthly payments, sometimes with annual escalators. Third-party ownership means no tax credit for the homeowner. Maintenance and monitoring come included in the payment. Performance guarantees are common. The lease can transfer to a new homeowner if the home sells.
Current Lease Rates and Structures
Lease payments vary based on system size, location, and provider. According to U.S. Department of Energy analysis, typical lease payments fall 10-30% below current electricity costs.
| Component | Typical Terms |
|---|---|
| Monthly payment | $75-$200 |
| Escalator | 0-2.9% annually |
| Term length | 20-25 years |
| Purchase option | Fair market value or fixed amount |
| Transfer fee | $0-$500 |
| Early termination | Prepay remaining or transfer |
The Escalator Trap
Many leases include annual escalators of 1.5-2.9% that increase payments each year. A $150 monthly payment with a 2.9% escalator becomes $296 monthly by year 25. Total 25-year payments exceed $75,000 for a system worth $25,000. These economics work only if utility rate increases exceed the escalator percentage.
Smart lead generators ask about escalator awareness. Leads who understand escalators and have compared lease versus loan economics represent informed prospects. Those who only know “no upfront cost” may face sticker shock when shown the full picture.
Who Should Consider Leases
Solar leases make sense for specific consumer profiles. Good lease candidates include those with credit scores below 650 who face limited loan options, homeowners with insufficient tax liability to use the federal credit, and consumers with a strong desire for zero upfront cost and fixed payments. Those with low home equity who cannot access HELOC options, homeowners planning to move within 5-7 years since lease transfers are often easier than selling an owned system, and risk-averse consumers who value predictability over optimization also fit the lease profile.
Conversely, poor lease candidates include homeowners with strong credit and access to favorable loan terms, those with sufficient tax liability to use the federal credit, people with long-term ownership plans, DIY-oriented consumers who want control, and those in states with strong net metering where ownership captures more value.
For lead generators, capturing this profile information enables intelligent routing. A credit-challenged lead in California with low tax liability represents a strong lease candidate. Routing them to a loan-focused installer wastes time. Routing them to Sunrun or Sunnova generates a closing-ready opportunity.
The Home Sale Complication
Leases create complications when homeowners sell their properties. The lease obligation transfers to the new buyer, who must qualify and agree to assume the payments. Some buyers refuse, demanding lease buyout as a condition of purchase.
Industry data tells the story: 77% of solar lease transfers complete successfully, with average transfer time running 45-60 days. Buyer objections cause 8-12% of deals to require lease buyout. Average lease buyout costs range from $12,000 to $25,000, representing the remaining payment present value.
Real estate agents in high-solar markets have become adept at handling lease transfers. Markets like California, Arizona, and Colorado see routine lease transfers. In emerging solar markets, lease complications sometimes derail home sales.
Lead generators should consider home sale timelines in qualification. Leads planning to sell within 2-3 years face higher transfer risk. Owned systems add value at $4 per watt average; leased systems add complication.
Power Purchase Agreements: Buying Electricity, Not Equipment
Power purchase agreements (PPAs) represent a third financing path where homeowners purchase electricity rather than equipment or usage rights. The distinction from leases is subtle but important.
How PPAs Work
In a PPA, a third-party owner installs and owns the solar system. The homeowner agrees to purchase all electricity the system generates at a specified rate per kilowatt-hour. Unlike a lease with fixed monthly payments, PPA payments vary based on actual production.
PPAs share certain characteristics with leases: zero upfront cost, third-party ownership with no tax credit for the homeowner, and rates typically 10-30% below utility rates. However, the payment structure differs fundamentally – you pay per kWh produced, creating variable monthly payments. Annual rate escalators of 1-3% are common. Terms run 15-25 years. Performance risk lies with the system owner since they only get paid for actual production.
PPA Rate Structures
PPA rates in 2024-2025 typically range from $0.08 to $0.18 per kWh, depending on geography and provider. The economics work when the PPA rate plus escalator remains below utility rates throughout the agreement term.
Consider an example of PPA economics: a homeowner with a current utility rate of $0.18 per kWh signs a PPA with a starting rate of $0.13 per kWh and a 2.5% annual escalator. In year one, they save 28% below utility rates. By year 10, the PPA rate reaches $0.17 per kWh, still below utility if rates rose 3% annually. By year 20, the PPA rate climbs to $0.21 per kWh, which may exceed utility rates in low-escalation markets.
The crossover risk is real. If utility rates remain flat or decrease due to cheap natural gas or grid solar penetration, PPA customers may eventually pay more than grid rates. This scenario has occurred in some markets, creating unhappy customers locked into above-market agreements.
PPA vs. Lease Comparison
| Factor | PPA | Lease |
|---|---|---|
| Payment structure | Per kWh (variable) | Fixed monthly |
| Production risk | Lies with owner | Lies with owner |
| Payment predictability | Lower (weather-dependent) | Higher (fixed) |
| Escalator application | Rate per kWh | Monthly payment |
| Typical escalator | 1-3% | 1.5-2.9% |
| Underproduction | Lower bill | Same payment |
| Overproduction | Higher bill | Same payment |
For lead generators, the PPA versus lease distinction matters for routing. Some financing providers offer only one option. Matching leads to the appropriate product type improves conversion.
Where PPAs Are Available
PPAs are not available in all states due to regulatory restrictions. Some states prohibit third-party electricity sales or limit them to specific configurations.
States where PPAs are generally available include Arizona, California, Colorado, Connecticut, Delaware, Washington D.C., Hawaii, Illinois, Maryland, Massachusetts, Nevada, New Hampshire, New Jersey, New Mexico, New York, Oregon, Pennsylvania, Rhode Island, Texas, and Vermont.
States with restrictions or unavailability include Alabama, Arkansas, Florida, Georgia, Indiana, Iowa, Kansas, Kentucky, Louisiana, Michigan, Mississippi, Missouri, Montana, Nebraska, North Carolina, North Dakota, Ohio, Oklahoma, South Carolina, South Dakota, Tennessee, Virginia, West Virginia, Wisconsin, and Wyoming.
Lead generators should route PPA-interested leads only to states where the product is available. Capturing state information early enables appropriate qualification.
The Federal Tax Credit: What Changed in 2026
The 30% federal Investment Tax Credit was the most significant financial distinction between ownership (cash or loan) and third-party financing (lease or PPA) – until it was eliminated. The One Big Beautiful Bill Act (Public Law 119-21, signed July 4, 2025) removed the residential ITC for systems placed in service after December 31, 2025. Understanding what changed and what remains enables accurate lead qualification and routing.
How the Residential Clean Energy Credit Worked
The IRS Residential Clean Energy Credit (Section 25D) allowed homeowners to claim 30% of qualified solar equipment and installation costs as a dollar-for-dollar reduction in federal income tax liability.
Per IRS guidance, the credit rate stood at 30% of eligible costs. The credit was nonrefundable, meaning it reduced tax to zero but did not generate a refund. Unused credit carried forward to future tax years. Eligible costs included equipment, installation labor, permitting, and sales tax on equipment. Ineligible costs included roof repairs, tree removal, and panel upgrades.
The residential ITC is no longer available for new installations. The One Big Beautiful Bill Act (Public Law 119-21, signed July 4, 2025) eliminated the residential clean energy credit for systems placed in service after December 31, 2025. Systems installed and placed in service on or before December 31, 2025 were eligible for the 30% credit; systems installed in 2026 and beyond are not. The prior legislative schedule (30% through 2032, stepping down to 26% in 2033, 22% in 2034) was superseded by this legislation.
For lead generators active in 2026 and beyond, the tax credit is no longer a differentiator between loan and lease financing paths. The ownership-versus-lease decision now turns primarily on system economics, credit qualification, and monthly payment preferences – not tax credit capture.
Tax Situation and Financing Fit (Post-ITC)
With the residential federal ITC eliminated for 2026 installations, tax situation is no longer the primary routing factor it once was. However, tax questions remain useful for two purposes: (1) identifying leads with existing pre-2026 installations who may have unused credit carryforward, and (2) understanding state incentive eligibility, which varies by jurisdiction.
State tax credits remain available in many markets and often require ownership rather than leasing. Examples include New York (25% state credit, capped at $5,000), Massachusetts (15% state credit), and South Carolina (25% state credit). For these markets, the ownership-versus-lease routing logic that previously applied to the federal credit applies to state credits instead.
For markets without state credits, tax situation questions remain less critical. The focus should shift to credit score (loan qualification), monthly payment preference, homeownership duration, and local utility rate structures.
Lead generators should update their form logic for post-2025 campaigns: the tax situation question still belongs on forms in high-state-incentive markets, but can be deprioritized in markets where no ownership-favoring state credits exist.
The Lease/PPA Tax Credit Reality (Historical Context)
For systems installed through December 31, 2025, the third-party owner – not the homeowner – claimed the federal tax credit in lease and PPA arrangements. This was legal since the financing company owned the system. The economics worked because the third-party owner’s 30% credit reduced their cost basis, enabling lower customer pricing.
For systems installed in 2026 and beyond, the residential ITC no longer exists for either ownership path. Third-party financiers cannot claim a residential credit that no longer applies, removing this structural pricing advantage. Lease and PPA rates in 2026 markets will reflect the post-ITC cost basis, which may be higher than 2025 pricing.
The ownership-versus-lease decision in 2026 and beyond turns on: monthly payment preference, credit qualification, state-level incentive access (which still favors ownership in many states), and the post-payoff savings that accrue to owners after loan terms end. Financial advisors who previously pointed to the federal credit as the ownership case will need to update their analysis to emphasize long-term economics and state incentives.
Comparing the Four Financing Options
Direct comparison helps leads understand their best path. The following analysis uses a representative scenario to illustrate 25-year economics.
Scenario Assumptions
The comparison uses a system size of 10 kW with a system cost of $27,500 before incentives. The homeowner’s current monthly electric bill is $175. Utility rate escalation is assumed at 3% annually. The location is a mid-tier solar market with moderate rates and good irradiance.
25-Year Cost Comparison
Note: The example below reflects pre-2026 economics where the 30% federal ITC applied to cash and loan purchases. For systems installed after December 31, 2025, the federal ITC no longer applies – adjust the analysis by removing the tax credit rows and recalculating net costs.
| Metric | Cash | Loan | Lease | PPA |
|---|---|---|---|---|
| Upfront cost | $27,500 | $0 | $0 | $0 |
| Federal tax credit (pre-2026 only) | -$8,250 | -$8,250 | $0 | $0 |
| Net initial cost (with ITC) | $19,250 | $0 | $0 | $0 |
| Net initial cost (without ITC, 2026+) | $27,500 | $0 | $0 | $0 |
| Monthly payment | $0 | $178 | $130 | Variable |
| Years of payments | 0 | 20 | 25 | 25 |
| Total payments | $0 | $42,720 | $39,000* | $38,500* |
| 25-year electricity savings | $72,000 | $72,000 | $33,000 | $33,500 |
| 25-year net benefit (with ITC) | $52,750 | $29,280 | $33,000 | $33,500 |
| 25-year net benefit (without ITC, 2026+) | $44,500 | $29,280 | $33,000 | $33,500 |
*Includes 2% annual escalator; actual amounts vary by provider and terms
Key Observations
For post-2025 systems without the federal ITC, the cash purchase advantage narrows significantly. Cash still avoids financing costs, but the $27,500 full outlay returns less efficiently than with the credit.
Loan purchase economics remain largely unchanged from the pre-ITC scenario since the credit reduced basis but the monthly payment structure is independent. The post-payoff savings advantage over leasing persists.
Lease and PPA generate similar benefits of approximately $33,000 because both rely on third-party ownership economics. Without the ITC differentiating ownership paths, the lease-versus-loan gap narrows – making credit qualification, monthly payment fit, and state incentive eligibility the primary decision factors.
Decision Framework for Leads
The financing decision depends on consumer circumstances. Cash makes sense when investment capital is available, the homeowner seeks maximum lifetime savings, prefers zero ongoing obligations, and has sufficient tax liability.
Loans work best when credit scores are 650 or higher (or lower if accepting higher rates), tax liability is sufficient for credit utilization, the homeowner prefers ownership benefits like equity, flexibility, and post-payoff savings, and they are willing to manage a loan relationship.
Leases fit when credit is below 650 or history is limited, tax liability is insufficient for the credit, the homeowner values simplicity and fixed payments, wants included maintenance and monitoring, or may move within 5-10 years.
PPAs suit the same circumstances as leases, with additional appeal for those who prefer paying for actual production rather than a fixed amount, are comfortable with the rate escalation model, and are located in a PPA-available state.
For lead generators, this decision framework translates into qualification questions that predict financing fit. A lead with 720 credit, substantial tax liability, and long-term ownership plans represents an ideal loan candidate. A lead with 620 credit, Social Security income, and uncertainty about future plans represents a lease candidate. Routing each to appropriate buyers improves conversion for everyone. For more on the 90-day journey from inquiry to installation, see our guide to solar lead nurturing.
Lead Qualification for Financing Readiness
Integrating financing qualification into lead generation improves both lead quality and conversion rates. The following framework identifies questions that predict financing fit without overcomplicating forms.
Essential Financing Questions
Credit Range Question (Required)
“How would you describe your credit?”
- Excellent (720+)
- Good (680-719)
- Fair (650-679)
- Building/Rebuilding (below 650)
- Not sure
Tax Situation Question (Recommended)
“When you file taxes, do you typically:”
- Owe additional money
- Break even
- Receive a refund under $1,000
- Receive a refund over $1,000
- Not sure
Homeownership Duration Question (Recommended)
“How long do you plan to stay in your current home?”
- Less than 3 years
- 3-5 years
- 5-10 years
- More than 10 years
- Not sure
Financing Preference Question (Recommended)
“Which matters most to you?”
- Lowest total cost over time (suggests loan)
- Zero upfront cost and simplest process (suggests lease)
- Fixed predictable monthly payments (suggests lease)
- Owning my system and equipment (suggests loan)
- Not sure yet
Using Responses for Routing
| Credit | Tax Situation | Duration | Preference | Best Fit |
|---|---|---|---|---|
| 720+ | Owes/Breaks even | 5+ years | Ownership | Loan |
| 720+ | Large refund | Any | Any | Needs education |
| 680-719 | Owes/Breaks even | 5+ years | Any | Loan |
| 650-679 | Any | Any | Simplicity | Lease |
| Below 650 | Any | Any | Any | Lease (if qualified) |
| Any | Large refund | Short term | Simplicity | Lease/PPA |
“Large refund” suggests low tax liability, which limits federal credit utility. “Owes or breaks even” suggests sufficient liability to use the credit.
Routing Intelligence for Lead Generators
Route to loan-focused buyers when leads show 680+ credit, tax liability present, ownership preference, and long-term occupancy plans.
Route to lease or PPA providers when leads show credit below 680, or low tax liability combined with simplicity preference, or short-term occupancy plans.
Flag for additional qualification when leads answer “Not sure” on multiple questions, provide inconsistent responses like excellent credit but simplicity preference, or indicate short-term occupancy combined with ownership preference.
Common Financing Pitfalls and How to Address Them
Understanding common consumer mistakes enables better lead education and reduces post-sale disappointment that damages buyer relationships.
The Dealer Fee Misunderstanding
Many consumers fixate on advertised interest rates without understanding dealer fee structures. An installer advertising “1.49% financing” typically adds 18-25% to the system price to fund the rate buydown.
Forms can address this through education. Including a question like “Are you aware that low-interest solar loans may have the rate buydown built into a higher system price?” with Yes/No/Not sure options educates while qualifying.
Red flag for buyers: Leads who aggressively demand 0.99% rates without understanding economics often become difficult customers who feel deceived when they learn the structure.
The Escalator Surprise
Lease and PPA escalators of 2-3% annually seem minor but compound significantly. Consumers often discover mid-lease that their payments have grown substantially.
Lead generators can include escalator awareness in lease-interested lead qualification: “Solar leases often include annual rate increases of 2-3%. Are you aware of how this affects payments over time?”
Red flag for buyers: Leads who believe lease payments remain fixed throughout the term need education before signing. Installers appreciate leads who arrive with realistic expectations.
The Tax Credit Confusion (Now Resolved by Legislation)
For systems installed after December 31, 2025, the 30% federal residential tax credit no longer applies – eliminating the consumer education burden around credit nonrefundability and tax liability requirements. This removes a significant friction point from the sales process for 2026 installations.
For leads with pre-2026 installations or those asking about the credit based on outdated information: the credit was nonrefundable (reduced taxes owed, not a refund check) and required sufficient tax liability. Leads researching 2025-era content may arrive with incorrect expectations about the credit applying to their 2026 installation. Clear disclosure at the form and landing page level prevents disappointment.
Red flag for buyers: Leads who specifically mention the “30% federal tax credit” as their primary motivation for going solar may be working from outdated information. Setting expectations early avoids post-sale friction.
The Performance Guarantee Gap
Some leases and PPAs guarantee specific production levels. If the system underperforms, the financing company compensates the customer. However, these guarantees often set conservative targets that the system exceeds.
The consumer reality is that the guarantee protects against catastrophic underperformance, not minor variance. A system guaranteed at 10,000 kWh may actually produce 11,500 kWh. The customer receives no additional benefit from overproduction under most lease structures.
Lead generators can set expectations: “Performance guarantees protect against major underperformance. They don’t mean your system will produce exactly the guaranteed amount. Are you comfortable with some production variance?”
The Net Metering Assumption
Many consumers assume current net metering policies will continue throughout their system’s life. Regulatory changes like California’s NEM 3.0 can dramatically alter economics mid-ownership. Understanding solar incentive changes affecting lead generation in 2025 helps set realistic expectations.
The consumer reality is that net metering policies are under pressure nationwide. Utility lobbying and cost-shift arguments may reduce or eliminate retail-rate compensation for exported electricity.
Lead generators can use this to introduce storage: “Net metering policies can change over time. Battery storage helps protect against future policy changes. Are you interested in including battery storage?”
This question serves multiple purposes: it identifies storage interest (a premium lead attribute), educates about policy risk, and introduces storage as a solution.
Battery Storage and Financing Implications
The integration of battery storage with solar changes financing economics significantly. Battery attachment rates reached 40% nationally in 2025, with California exceeding 79% post-NEM 3.0. For more on how geographic factors affect solar lead economics, see our guide to geographic arbitrage in solar markets.
How Batteries Change the Financing Equation
Batteries add $8,000-$15,000 to system cost depending on capacity and brand. For systems installed through December 31, 2025, the federal tax credit at 30% applied to battery storage when installed with or on an existing solar system, reducing net battery cost to $5,600-$10,500. For systems installed in 2026 and beyond, the residential ITC was eliminated by the One Big Beautiful Bill Act (Public Law 119-21, signed July 4, 2025). State-level battery incentives, utility rebates, and SGIP (in California) remain available in some markets.
Storage delivers economic value through several mechanisms. Time-of-use arbitrage lets homeowners store cheap daytime solar for use during expensive evening peaks. Backup power provides electricity during grid outages. The net metering hedge allows using stored energy rather than exporting at reduced rates. For homes with demand charges, storage reduces peaks and lowers costs.
Financing Solar-Plus-Storage
Most solar financing options extend to solar-plus-storage combinations. Solar-plus-storage loans work identically to solar-only loans. Higher loan amounts mean higher payments but also higher tax credits. The incremental economics of storage typically work when time-of-use rates or backup power value justify the added cost.
Solar-plus-storage leases are less common but growing. Monthly payments increase $50-$100 to include storage. The value proposition focuses on backup power rather than economics, since the third-party owner captures any arbitrage value.
Storage-inclusive PPAs are rare because the PPA model of paying per kWh consumed does not easily accommodate battery economics. Some providers offer hybrid models with fixed storage fees plus per-kWh solar charges.
Qualifying Leads for Storage Interest
Storage interest indicates a sophisticated lead who understands policy risk and values resilience. These leads typically close at premium rates.
Effective storage qualification questions include asking about significant power outages in the past year, whether the homeowner is on a time-of-use rate plan, whether backup power during outages would be valuable, and awareness that net metering policies may change.
Leads answering “yes” to multiple questions represent storage-qualified prospects worth premium routing.
Frequently Asked Questions
What is the best way to finance solar panels in 2026?
The best financing method depends on your circumstances. For systems installed in 2026 and beyond, the 30% federal residential tax credit no longer applies following the One Big Beautiful Bill Act (signed July 4, 2025). Solar loans are optimal for homeowners with credit scores above 650 who want ownership benefits including post-payoff savings and eligibility for state-level incentives where available. Leases and PPAs work better for homeowners with credit below 650 or strong preference for zero upfront cost and included maintenance. Cash purchases generate the highest long-term returns but require available capital. Evaluate state and utility incentives at dsireusa.org since these vary significantly by market and continue to favor ownership in some states.
How much is a monthly payment for solar panels?
Monthly payments vary significantly based on system size, loan terms, and interest rate. For a typical 10 kW system costing $27,500 before incentives, monthly loan payments range from $150-$200 on 20-year terms at 5-8% APR. Lease payments typically run $100-$175 monthly but include annual escalators of 1.5-3% that increase payments over time. Many homeowners achieve “positive cash flow” where loan payments are less than their previous electric bills, but this outcome requires sufficient electricity usage and favorable loan terms.
What credit score do I need for solar financing?
Most solar loans require minimum credit scores of 650, with best rates available to borrowers above 720. Credit scores of 680-719 qualify for standard rates with most lenders. Scores of 650-679 face higher rates and may require larger down payments. Borrowers below 650 have limited loan options but may qualify for solar leases or PPAs, which have more flexible credit requirements since the financing company retains ownership and can recover the equipment if payments stop.
Should I lease or buy solar panels?
Buy through cash or loan if you have credit above 650, plan to stay in your home 7+ years, want to maximize long-term savings, and are in a state with ownership-favoring incentives. The 30% federal tax credit no longer applies to 2026 installations (eliminated by the One Big Beautiful Bill Act, signed July 4, 2025), so evaluate state-level incentives separately. Lease if you have credit below 650, value simplicity over optimization, or plan to move within 5-7 years. Ownership still generates significantly more lifetime savings for qualified borrowers due to post-payoff years of free electricity, but the gap narrows without the federal ITC.
How does the federal solar tax credit work with financing?
The residential federal solar tax credit no longer applies to systems installed after December 31, 2025. The One Big Beautiful Bill Act (Public Law 119-21, signed July 4, 2025) eliminated the residential Residential Clean Energy Credit (Section 25D) for new installations in 2026 and beyond. For systems installed on or before December 31, 2025, the 30% credit applied only to purchased systems (cash or loan), not to leased systems or PPAs. Homeowners with pre-2026 installations who have unused credit may still carry it forward to future tax years.
For 2026 and later installations, the tax credit distinction between ownership and leasing no longer exists at the federal level. State-level incentives remain available in many markets and should be evaluated separately.
What happens to solar loans or leases when I sell my home?
Owned systems purchased through cash or loan transfer with the home and typically add value. Lawrence Berkeley National Lab research found solar homes sell for approximately $4 per watt more than comparable non-solar homes. If you have a loan balance, you can pay it off from sale proceeds or, in some cases, transfer the loan to the buyer. Leased systems require the buyer to qualify for and assume the lease, which can complicate sales. Approximately 77% of lease transfers complete successfully, but buyer objections sometimes require the seller to buy out the remaining lease.
Are solar loan interest rates tax deductible?
Solar loan interest is generally not tax deductible unless the loan is structured as a home equity loan or HELOC secured by your primary residence. Unsecured solar loans and equipment-secured solar loans do not qualify for the mortgage interest deduction. However, interest deductibility is often less valuable than the 30% federal tax credit on the system itself. Consult a tax professional for guidance on your specific situation.
What is a dealer fee in solar financing?
A dealer fee is an upfront payment from the installer to the lender that “buys down” the interest rate on solar loans. When you see advertised rates of 0.99% or 1.99%, the installer is typically paying 15-30% of the loan amount to the lender to subsidize that rate. This fee gets added to your system price. A $25,000 system with a 25% dealer fee becomes a $31,250 loan. The effective APR, considering the inflated principal, often exceeds 8-10%. Always compare the total cost (system price plus all interest) rather than focusing on the advertised rate alone.
How long does solar financing approval take?
Solar loan approval typically takes 1-5 business days from application to decision. Pre-qualification with a soft credit pull can provide an estimate within minutes. Full approval requires income verification and homeownership confirmation, which extends the timeline. Lease and PPA approvals are often faster at 24-72 hours because the financing company’s risk is lower given their retained ownership. The overall installation timeline of 4-12 weeks from contract to operation is usually limited by permitting and utility interconnection rather than financing approval.
Can I refinance my solar loan later?
Yes, solar loans can typically be refinanced like any other loan. If interest rates decline or your credit improves, refinancing may reduce your monthly payments. Some solar loans have prepayment penalties, so check your terms before refinancing. Alternatively, you may be able to fold solar loan balances into a home equity refinance or cash-out mortgage refinance, potentially achieving lower rates by using home equity as collateral. However, this converts an unsecured obligation into secured debt against your home.
Key Takeaways
-
Financing knowledge dramatically improves lead quality. Leads who understand their financing options close at 2-3x the rate of financing-naive leads. Adding financing qualification questions to lead forms improves conversion without reducing volume.
-
The federal tax credit no longer applies to new residential installations. The One Big Beautiful Bill Act (Public Law 119-21, signed July 4, 2025) eliminated the residential ITC for systems placed in service after December 31, 2025. For 2026 and beyond, state-level incentives and system economics – not federal tax credit capture – drive the loan-versus-lease decision. Check DSIRE (dsireusa.org) for state-specific incentives by market.
-
Loans beat leases for qualified borrowers. Homeowners with credit above 650 generate more lifetime savings through loan ownership versus leasing – primarily from post-payoff years of free electricity and state-level incentives where available. The ITC elimination narrows the gap but does not close it for borrowers with favorable loan terms.
-
Leases serve specific populations well. Credit-challenged consumers, those with minimal tax liability, and homeowners who value simplicity over optimization can achieve meaningful savings through leases. These leads should route to lease-focused providers.
-
Dealer fees obscure true loan costs. Advertised rates of 0.99-2.99% typically include dealer fee buydowns that add 15-30% to system prices. Effective APRs often exceed 8-10% when calculated on inflated principal. Educated leads ask about total cost, not just rate.
-
Escalators compound significantly. Lease and PPA escalators of 2-3% annually turn $150 monthly payments into $296 monthly by year 25. Total payments can exceed $75,000 for $25,000 systems. Leads who understand escalators make better decisions.
-
Storage changes the equation. Battery attachment rates exceeding 40% nationally (79% in California) reflect changed economics under reduced net metering. Storage-interested leads represent premium prospects worth dedicated routing.
-
Qualification questions enable intelligent routing. Credit range, tax situation, homeownership duration, and financing preference questions allow lead generators to route prospects to appropriate financing options, improving close rates for all parties.
Sources
- Lawrence Berkeley National Laboratory: Tracking the Sun – Residential solar financing mix; 22% cash purchases, 78% financing; loan/lease/PPA breakdown
- Solar Energy Industries Association: Solar Market Insight – Residential solar installation costs, average system size, and financing trend data
- U.S. Department of Energy: DSIRE Incentives Database – State solar incentives, net metering policies, and utility-specific program availability
- One Big Beautiful Bill Act, Public Law 119-21 (2025) – Elimination of residential Section 25D federal Investment Tax Credit effective January 1, 2026
Financing information updated January 2026. The residential federal Investment Tax Credit (Section 25D) was eliminated for systems placed in service after December 31, 2025, by the One Big Beautiful Bill Act (Public Law 119-21, signed July 4, 2025). State and local incentives vary and are subject to change; verify current availability at dsireusa.org. All financial examples are illustrative; actual costs and savings depend on individual circumstances, local rates, and system specifications. This content is educational and does not constitute financial or tax advice. Consult qualified professionals for guidance on your specific situation.