Content programs that ignore the routing layer below them produce traffic, not revenue.
Why Topic-First Content Fails Lead-Generation Economics
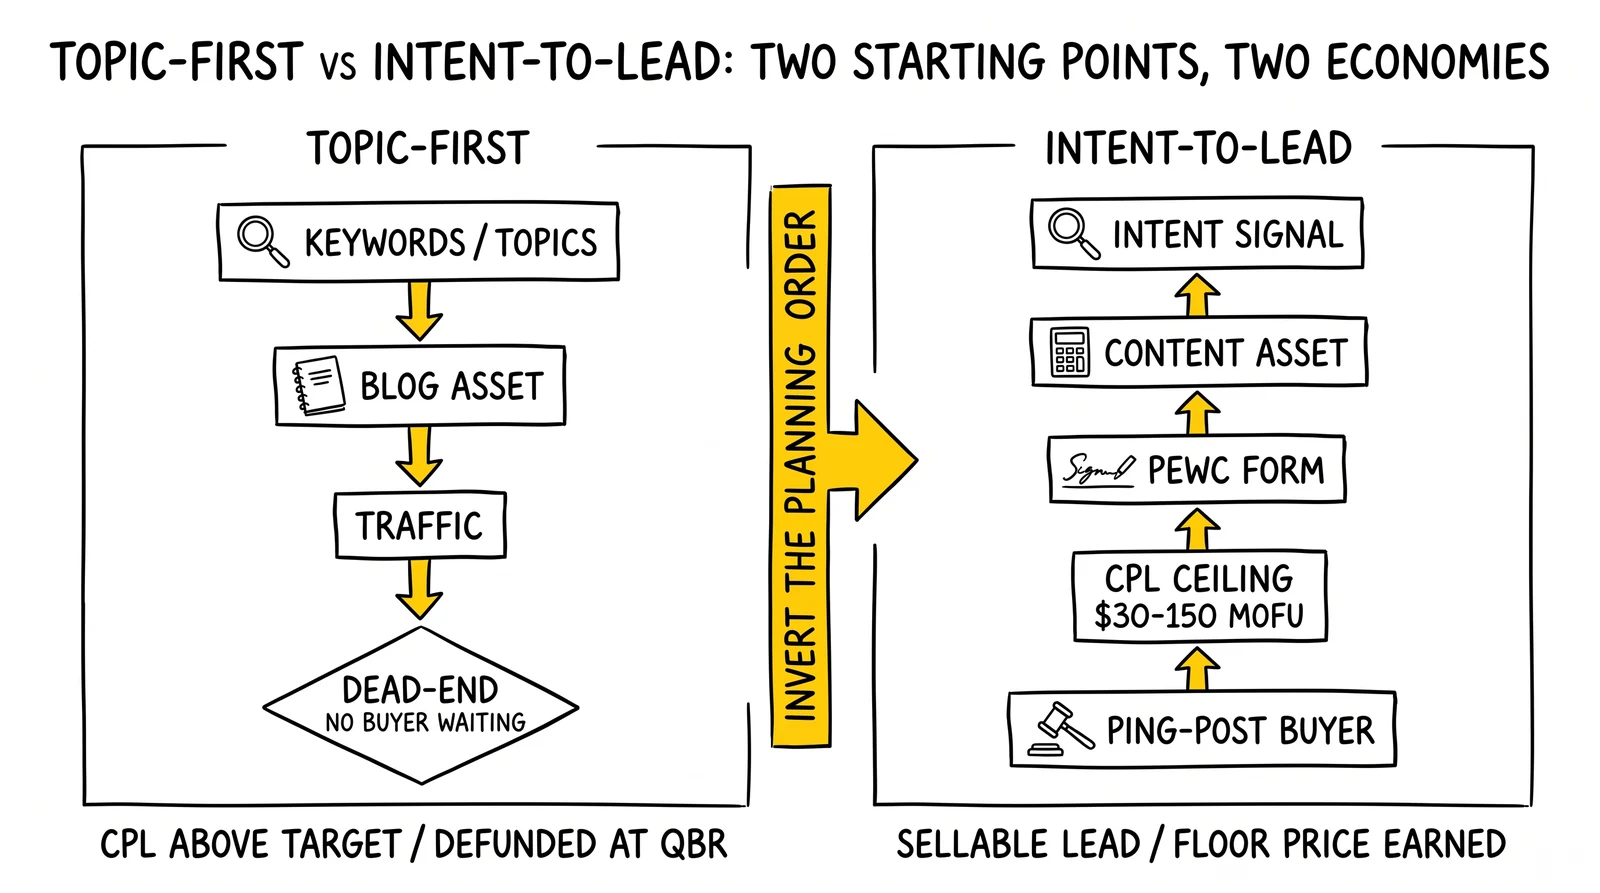
Content marketing for lead generation operates under a misconception that breaks most programs before launch: the belief that content success is measured by traffic, engagement, or social shares. Operators who run content as a brand-awareness function treat these metrics as proxies for value, then discover at quarterly review that content-influenced lead capture sits well below paid-media benchmarks, attribution-adjusted CPL exceeds the levers any optimization can pull, and the program either gets defunded or limps forward without economic justification.
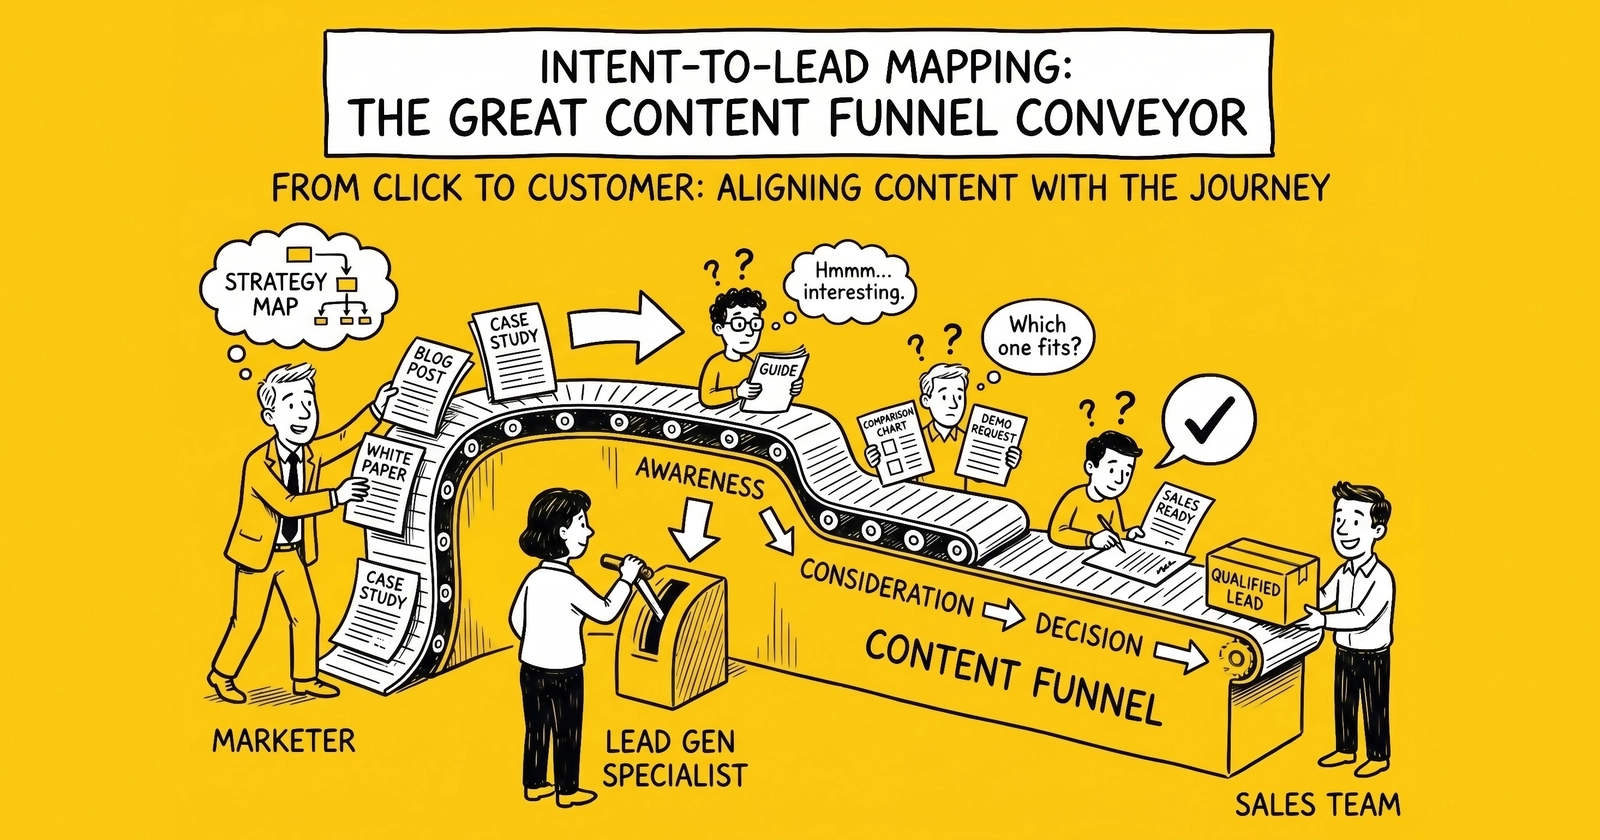
The disconnect between content activity and lead-generation results stems from a planning failure visible in nearly every underperforming program. Content strategies that begin with topics or keywords – rather than the conversion paths and routing destinations they enable – produce assets that rank, attract visitors, and never progress those visitors toward a capture form a buyer will actually pay for. The asset is built before the buyer exists. The buyer never appears.
Intent-to-lead mapping inverts this approach. Rather than asking what topics deserve coverage, the framework starts from the routing destination and works backward: which buyers in a ping-post auction will accept this lead, what their scoring engines weight, what consent capture must satisfy under TCPA and state mini-TCPA statutes, what CPL the unit economics support, and what content sequence produces a buyer-ready lead at that cost.
This analysis examines the framework operators use to design that mapping: classifying intent signals by purchase-readiness, aligning content to funnel stages with TCPA-compliant capture, selecting attribution models that survive scrutiny, and tying lead-quality scoring to content origin so buyers in ping-post platforms like boberdoo, Phonexa, and LeadsPedia can route appropriately. CPL benchmarks across insurance, solar, mortgage, and legal anchor the discussion in observable economics rather than aspirational ROI math.
Intent Signal Classification
The Intent Spectrum
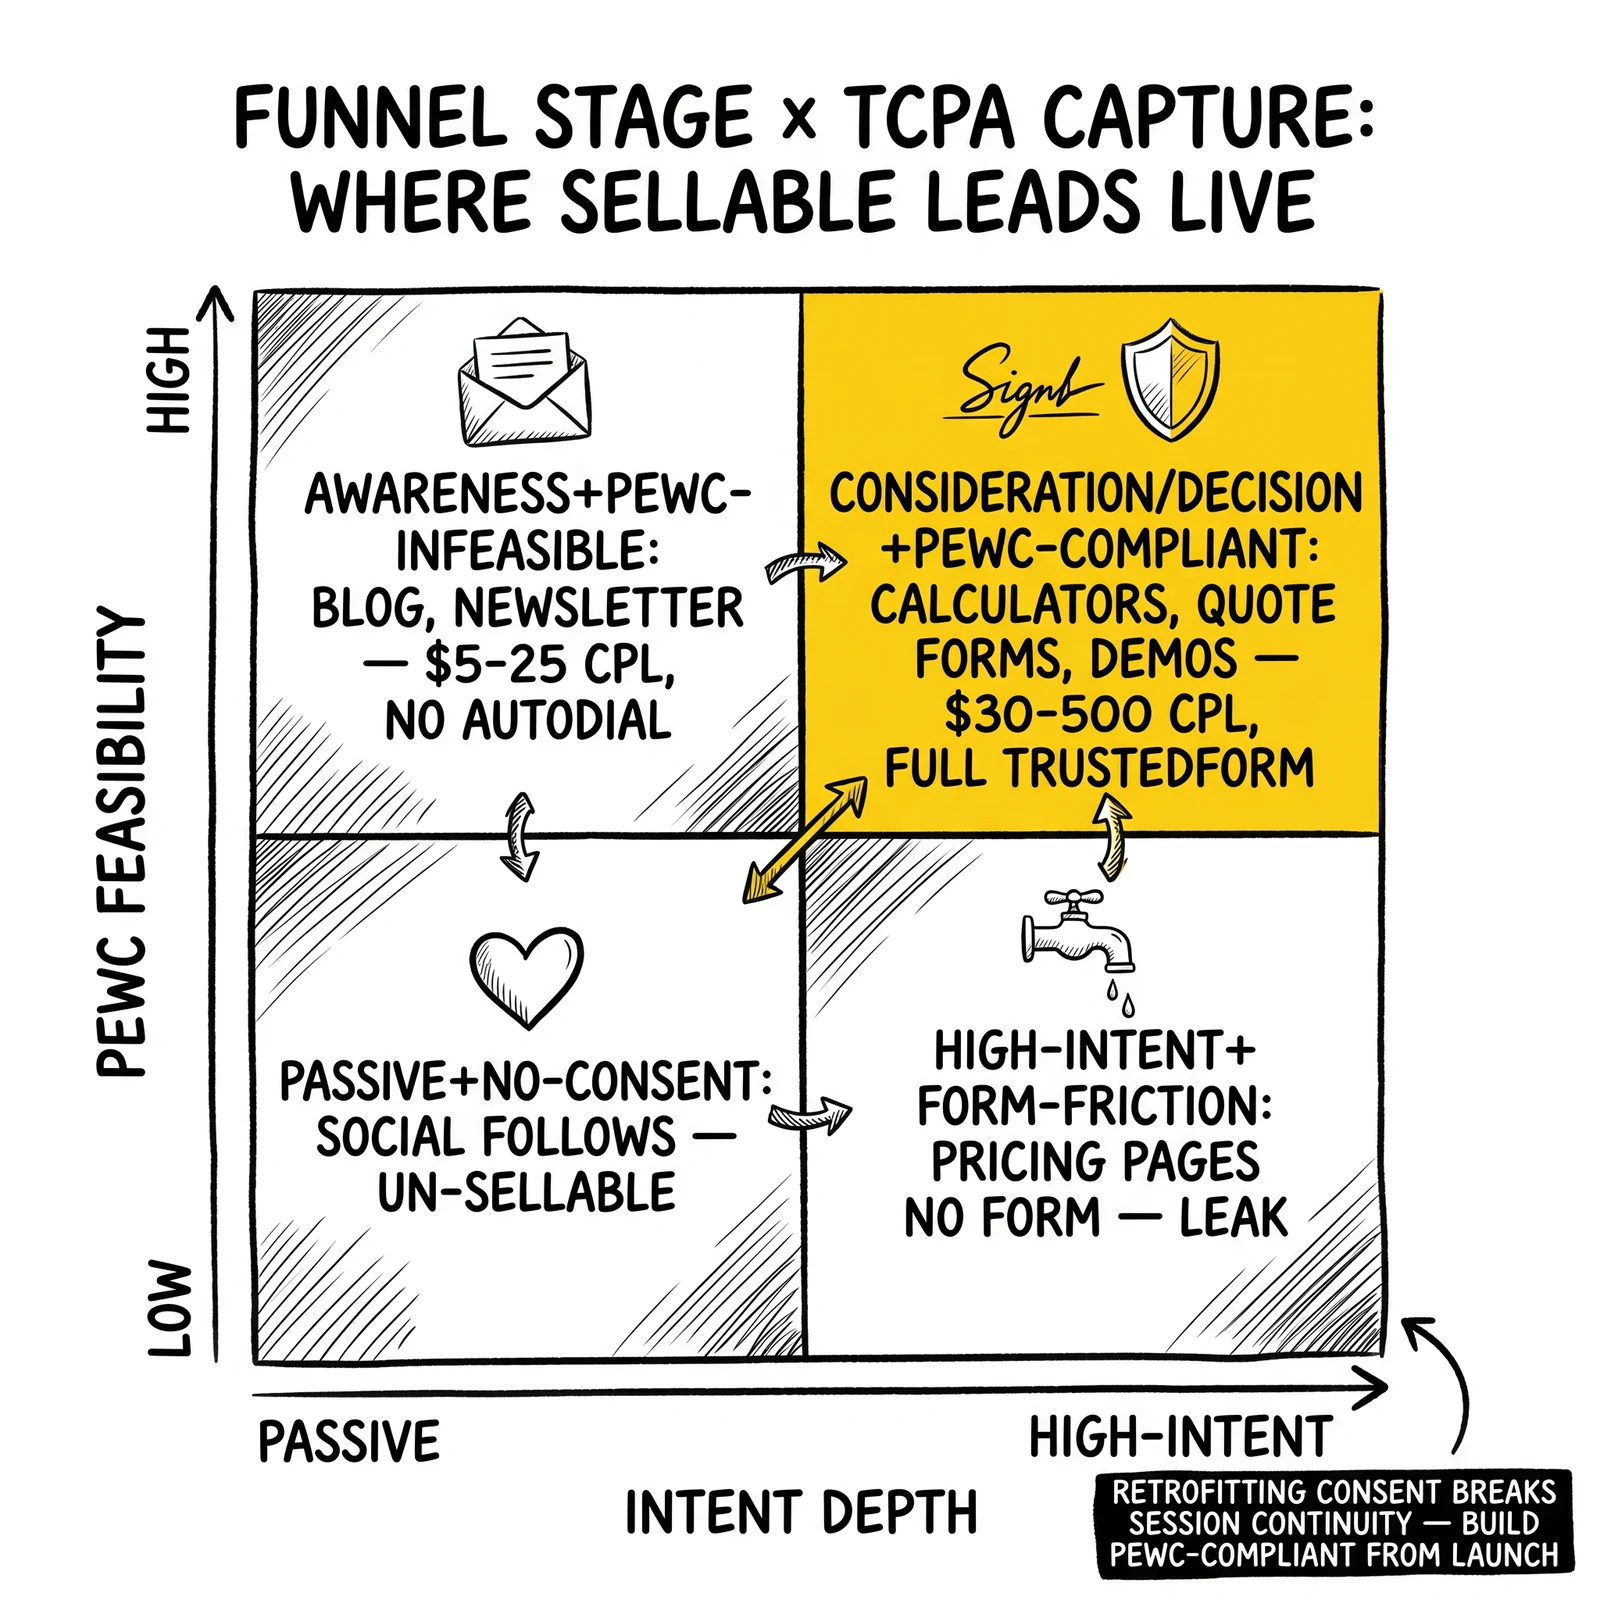
Intent signals exist on a spectrum from passive interest to active purchase consideration. Where a signal falls on this spectrum determines appropriate content responses, realistic conversion expectations, and – critically for lead-gen operators – whether the resulting capture event will satisfy buyer-side acceptance criteria.
At the passive end sit general information-seeking behaviors: reading industry news, consuming educational content, following thought leaders on social. These signals indicate topic interest but not purchase consideration. Content targeting passive intent should educate and build awareness rather than push toward conversion – conversion attempts at this stage produce friction without results, and the leads that do convert score poorly under buyer scoring engines because session signals (time-on-site, page depth, return visit count) indicate research mode rather than purchase mode.
Mid-funnel intent signals demonstrate active problem recognition: comparing solutions, researching vendors, calculating costs, reading reviews. Prospects at this stage have identified a need they intend to address within an actionable window. Content should help evaluation while positioning the operator’s offering favorably. Conversion offers should be low-commitment – guides, calculators, comparison tools – rather than direct consultation requests, and the capture form architecture must already include TCPA-compliant consent language because mid-funnel leads are routinely sold into call-center distribution.
High-intent signals indicate imminent purchase decisions: pricing-page visits, case-study consumption, demo requests, specific feature research. Prospects displaying these signals have largely completed evaluation and are preparing to choose. Content at this stage should reduce friction and answer final objections rather than continuing education. Conversion offers can be direct – quotes, consultations, trials – because purchase readiness has been established and the resulting lead clears at the highest floor prices on ping-post platforms.
| Intent Level | Signal Examples | Buyer Scoring Weight | TCPA Capture Feasibility | Typical CPL Range |
|---|---|---|---|---|
| Passive | Blog reading, social follows, newsletter signup | Low (informational) | Difficult – soft CTA cannot support PEWC language | $5-25 (when convertible) |
| Mid-Funnel | Comparison searches, calculator use, gated guide downloads | Medium-High | Feasible – form-driven CTA supports explicit PEWC | $30-150 (vertical-dependent) |
| High-Intent | Pricing research, demo interest, vendor reviews, “near me” queries | High (purchase-ready) | Standard – direct offer aligns with PEWC | $40-500 (vertical-dependent) |
CPL ranges drawn from the project’s cost per lead benchmarks reference, HubSpot’s 2024 State of Marketing Report, and aggregated lead-network platform data.
First-Party vs. Third-Party Intent Data
Intent signals divide into two categories based on collection source, each with distinct advantages and limitations for content strategy and downstream routing.
First-party intent data comes from behaviors on owned properties: site visits, content downloads, email engagement, form interactions. First-party data provides high accuracy – the operator knows exactly what happened – but limited coverage, since the data only describes visitors who already arrived. Content strategy using first-party intent focuses on conversion optimization: ensuring visitors progress through the funnel toward capture, with TrustedForm or Jornaya certificates documenting the journey for buyer-side TCPA compliance. ActiveProspect’s TrustedForm session replay is increasingly required by call-center buyers before they will accept leads, especially in regulated verticals like Medicare and mortgage.
Third-party intent data aggregates behaviors across the broader web through data partnerships with publishers, platforms, and consortiums. Third-party data provides broad coverage – operators can identify prospects before those prospects find the operator’s site – but variable accuracy that depends on data-provider methodology. Content strategy using third-party intent focuses on prospect acquisition: producing content that intercepts prospects during research elsewhere, often with paid distribution against intent-targeted audiences sourced from Bombora, 6sense, or vertical-specific data providers.
The most defensible content strategies combine both data types into a single funnel. Third-party intent identifies prospects worth pursuing; content created to intercept those prospects brings them to owned properties; first-party intent then guides them through the funnel toward conversion with full TrustedForm session capture. This integration requires both technical infrastructure (data-platform connections, server-side tracking, sub-ID passthrough into the lead-posting API) and strategic alignment.
| Data Type | Accuracy | Coverage | Primary Use | Buyer-Acceptance Implication |
|---|---|---|---|---|
| First-Party | High | Limited to existing visitors | Conversion optimization | TrustedForm/Jornaya certificate available |
| Third-Party | Variable | Broad | Prospect acquisition | Requires landing-page session capture before consent moment |
| Combined | High (composite) | Broad | Integrated funnel | Full session replay from arrival through PEWC capture |
Intent Signal Patterns by Vertical
Different verticals exhibit distinct intent-signal patterns that should inform content strategy and routing infrastructure decisions.
In auto and home insurance, intent signals include quote-comparison behavior across multiple carrier sites, policy-renewal timing spikes (visible in 30-day windows ahead of renewal dates), life-event indicators (home purchase, new baby, divorce, retirement-related searches), and rate-sensitivity research. The Insurance Information Institute documents that auto-insurance shopping concentrates around renewal periods and rate-increase notices, which lets operators time content distribution to known demand windows rather than averaging across the year. CPLs for auto insurance run $25-75 with mid-market median around $40-50 per HubSpot’s aggregated benchmarks; carriers route the highest-intent leads (multi-quote comparison sessions with TrustedForm certificates) into preferred buyer queues.
Solar and home-improvement verticals show intent through utility-bill research, federal and state incentive investigation, equipment comparison (panel types, battery storage, inverter specs), installer reviews, and financing exploration. The Solar Energy Industries Association’s quarterly Solar Market Insight reports document seasonal demand patterns – interest peaks in spring and summer, with dramatic regional variation tied to net-metering policy, utility rate structures, and state-level rebate programs. Solar lead CPLs run $75-250 nationally with mid-market median around $100-175. Geographic variation is extreme: California, Texas, and Florida solar leads command premiums of 1.8-2.5x the national median because installer demand concentrates there, while leads in low-adoption states clear at floor prices.
Mortgage intent signals correlate strongly with rate movements. Rate-drop announcements trigger refinance research within 24-48 hours, producing measurable spikes in calculator usage and comparison-tool engagement. Purchase intent signals include home-search activity, pre-approval research, and down-payment calculator usage. The cyclical nature of mortgage interest requires content strategies and content-distribution infrastructure that can scale fast when rate conditions create opportunity – operators who staff content production seasonally rather than maintaining always-on capacity miss the highest-margin windows. Mortgage purchase CPLs range $50-200; refinance CPLs range $40-150 and inverse-correlate with rates.
Legal verticals demonstrate intent through specific incident research (car-accident procedures, workplace-injury rights), statute-of-limitations queries, compensation-estimation searches, and attorney-evaluation patterns. Urgency varies sharply by practice area: personal-injury intent often emerges within 24-72 hours of incidents, while business-law matters develop over months. Personal-injury CPLs are the industry’s highest, ranging $200-500 with mid-market median around $275-400, justified by case values that frequently exceed $50,000.
Funnel-Stage Content Architecture
Content Mapped to Stage and Capture
Effective content funnels progress visitors through stages corresponding to evolving information needs and purchase readiness. Each stage requires different content types, conversion offers, success metrics, and – for operators routing to ping-post buyers – distinct lead-metadata profiles. Attempting to shortcut this progression by pushing bottom-funnel offers to top-funnel visitors produces poor conversion rates and leads that score badly under buyer scoring engines.
The awareness stage serves prospects who have identified a problem or interest but have not begun solution research. Content at this stage validates concerns, establishes the problem’s importance, and introduces solution categories without immediate product positioning. Success metrics focus on engagement (time on page, scroll depth, return visits) rather than conversion, since direct lead capture at this stage produces leads that fail buyer-side scoring.
The consideration stage serves prospects actively evaluating solutions. Content provides evaluation frameworks, comparison analysis, and decision-support tools. Conversion offers – gated guides, calculators, assessment tools – capture contact information in exchange for value. This is the funnel’s high-yield stage for lead-gen operators because the content type natively supports TCPA-compliant consent capture: the form CTA is explicit, the value exchange is clear, and the disclosure language can be integrated into form architecture without violating the FCC’s “clear and conspicuous” requirement.
The decision stage serves prospects prepared to choose. Content reduces friction through case studies, FAQ resolution, and implementation walkthroughs. Conversion offers can be direct – consultations, demos, quotes – because decision readiness has been established. Decision-stage leads clear at the highest floor prices in ping-post auctions because journey signals (multiple session, deep page-engagement, comparison-tool completion) demonstrate purchase intent that buyer-side scoring engines weight heavily.
| Stage | Prospect Question | Content Types | Conversion Offer | TCPA Capture | Routing Profile |
|---|---|---|---|---|---|
| Awareness | ”What’s the problem?” | Blog posts, thought leadership, industry reports | Newsletter, content subscription | Soft opt-in only; no PEWC | Low buyer demand; nurture sequence |
| Consideration | ”What are my options?” | Comparison guides, calculators, gated reports | Gated assets, tools, assessments | PEWC-compliant form architecture | Mid-tier buyer queues; standard floor prices |
| Decision | ”Is this the right choice?” | Case studies, pricing pages, demo content | Consultation, demo, quote | PEWC with full TrustedForm certificate | Premium buyer queues; top floor prices |
Stage-Specific Content Design
Content creation for each funnel stage requires distinct approaches to format, depth, and call-to-action design. Mismatching content to stage is the most common content-strategy failure observed across lead-gen verticals.
Awareness content should be freely accessible (no gating), optimized for organic search visibility, and focused on problem validation rather than solution selling. Format options include blog posts addressing common questions, industry trend analysis, and educational resources explaining key concepts. These pieces build trust and establish topical authority without triggering the defensive response premature selling creates. For a solar operator, awareness content might include explainers on net-metering reform, utility-rate trajectory analysis, or homeowner-electricity-bill anatomy. Visitors who engage demonstrate relevant interest that subsequent content can develop.
Consideration content warrants gating when value justifies the information exchange. The functional test: would the content be worth paying for if it weren’t free? If yes, gating is appropriate. If no, the gate creates friction without commensurate value. Format options include detailed guides, comparison frameworks, ROI calculators, and self-assessment tools. Continuing the solar example, consideration content might include a 25-year cost-comparison calculator covering solar versus generator versus grid, or a state-by-state incentive eligibility tool. These resources help prospects evaluate options while capturing contact information that enables follow-up nurturing – and the form architecture should embed PEWC-compliant consent language from launch, since retrofitting consent into existing forms typically requires rebuilding the entire flow and breaking historical attribution data.
Decision content should emphasize proof and friction reduction. Case studies with quantified outcomes, customer stories from similar situations, and implementation guides showing the path from decision to result address final concerns blocking conversion. Calls to action should be direct – “Get Your Custom Quote” or “Schedule a Consultation” – because the audience has demonstrated readiness through journey signals that ping-post buyers will pay premium prices to receive.
Conversion Path Design and Sub-ID Tracking
Each content piece should have a defined conversion path – the route from content consumption to lead capture, with sub-ID parameters identifying the originating asset throughout. Undefined conversion paths waste the engagement that good content generates; missing sub-IDs prevent the asset-level performance analysis required to optimize a content portfolio.
For ungated awareness content, conversion paths typically move through multiple touchpoints. A visitor reads a blog post, sees related-content recommendations, returns for additional articles, eventually encounters a consideration-stage offer (guide, calculator), provides contact information, and enters a marketing-automation nurture sequence progressing toward direct conversion offers. Sub-IDs persist across the journey via cookied or session-bound identifiers, letting operators reconstruct first-touch and last-touch attribution at the asset level.
For gated consideration content, the conversion path shortens but still requires follow-up. Lead capture begins the relationship, but most captured leads are not sales-ready. Nurture sequences delivering additional value build trust and qualification while progressing leads toward decision-stage readiness. Behavioral triggers – downloading decision content, visiting pricing pages, high email engagement – indicate readiness for sales handoff or direct posting into buyer queues.
For decision content, conversion paths should be immediate and frictionless. Visitors consuming case studies and implementation guides have signaled readiness; the conversion offer should be prominently visible and easy to complete. A/B testing conversion-offer placement and messaging on this high-intent traffic produces some of the highest measured-lift gains in the typical lead-gen optimization program, often 15-40% capture-rate improvement on a single test cycle.
| Content Stage | Conversion Path Length | Sub-ID Tracking Imperative | Follow-Up Approach |
|---|---|---|---|
| Awareness | 5-10+ touchpoints | First-touch sub-ID critical for attribution | Educational nurture, behavioral progression |
| Consideration | 2-5 touchpoints | Asset-level sub-ID for ROI analysis | Value-add nurture, scoring threshold to handoff |
| Decision | 1-2 touchpoints | Last-touch sub-ID for buyer reporting | Direct sales handoff or ping-post posting |
TCPA Implications by Funnel Stage
Content-funnel design intersects directly with TCPA compliance – the federal statute (47 U.S.C. § 227) governing telemarketing calls, autodialed contact, and prerecorded voice messages. The Federal Communications Commission’s enforcement of TCPA, combined with state mini-TCPA statutes in Florida, Oklahoma, Washington, and Maryland, creates a compliance perimeter that determines which content stages can produce sellable leads and which cannot.
Awareness-stage content rarely supports Prior Express Written Consent capture. The call-to-action – typically a newsletter signup or content subscription – is too soft to support unambiguous opt-in language, and the visitor has not identified themselves as a buyer of any product or service. Operators who attempt to capture autodial consent on awareness forms face two failure modes: leads that legally cannot be contacted by autodialer or prerecorded voice (because consent does not satisfy “clear and conspicuous” requirements), and leads that buyers refuse to accept because TrustedForm certificates show ambiguous consent context.
Consideration-stage content can capture PEWC when forms include the FCC’s required disclosures: clear identification of the seller (or sellers in shared-lead arrangements), an explicit statement that consent is not a condition of purchase, and unambiguous agreement to be contacted by autodialer or prerecorded voice at the number provided. Operators routing leads to call-center buyers via ping-post should architect consideration-stage forms as PEWC-compliant from launch. The FCC’s 2024 one-to-one consent rule (which took effect in adjusted form after the Eleventh Circuit’s January 2025 ruling) further constrains shared-lead distribution, requiring careful structuring of multi-buyer disclosures. Compliance documentation through TrustedForm or Jornaya certificates provides the session-replay evidence buyers and regulators expect.
Decision-stage content typically aligns most cleanly with PEWC because the conversion offer (consultation, demo, quote) explicitly invites contact. Forms at this stage should capture full session replay, IP, geolocation, time-of-day, and explicit consent language with seller identification. Leads from decision-stage content typically command floor prices 1.4-2.0x higher than leads from consideration-stage forms because the journey signals support buyer scoring at the highest tier and the consent record withstands TCPA scrutiny.
For operators in regulated verticals – Medicare, ACA health, mortgage, debt relief – content-funnel design must account for vertical-specific compliance overlays. CMS regulations on Medicare lead generation (effective October 2024) require Scope of Appointment documentation and impose Third-Party Marketing Organization disclosure requirements that change which content forms can produce sellable leads.
Attribution Modeling for Content-Driven Lead Generation
The Attribution Challenge
Content marketing’s contribution to lead generation is notoriously difficult to measure, and this measurement challenge produces both under-investment (when content’s impact is invisible) and mis-investment (when attribution models misrepresent content’s role).
The fundamental problem: content often influences decisions without appearing in standard attribution reports. A prospect might read three blog posts over two weeks, building trust and education, then convert through a paid-search click. Last-click attribution credits the paid-search campaign with the entire conversion, while the content that enabled the conversion receives nothing. This measurement failure has real strategic consequences. Marketing budgets flow toward channels with visible attribution (paid search, paid social) while content marketing appears ineffective despite substantial contribution. Operators who improve content attribution typically discover content is performing better than reports suggested – and that investment reallocation toward content improves overall marketing efficiency.
First-touch attribution swings to the opposite extreme, crediting whatever initiated awareness regardless of what drove the actual conversion decision. A social-media click three months before conversion receives full credit while the decision-stage case study that closed the deal receives nothing. Neither extreme accurately represents content’s multi-touch influence.
Multi-Touch Attribution Models
Multi-touch attribution distributes conversion credit across touchpoints based on various weighting schemes. These models better represent content’s role but introduce complexity and subjectivity in weight assignment. The multi-touch attribution guide for lead generation details model selection trade-offs at depth.
Linear attribution divides credit equally across all touchpoints. If five touchpoints preceded conversion, each receives 20% credit. The model treats all content equally regardless of position – a reasonable default when underlying data does not justify differential weighting, but potentially misleading when touchpoint influence genuinely varies by funnel position.
Time-decay attribution weights recent touchpoints more heavily than distant ones, reflecting the assumption that closer-to-conversion interactions have more influence. The model typically under-credits awareness content (which occurs early) while over-crediting decision content (which occurs late). Decay rate is configurable but often requires calibration through testing. Time-decay suits short-cycle verticals where most journeys complete within 14-30 days – auto-insurance comparison shopping, for instance.
Position-based attribution assigns fixed percentages to first and last touchpoints while distributing the remainder across middle touches. A common configuration assigns 40% to first touch, 40% to last touch, and divides 20% among middle touchpoints. The model explicitly values both awareness (first touch) and conversion (last touch) while acknowledging mid-funnel contribution. Operators in long-cycle verticals (mortgage purchase, B2B SaaS) typically anchor attribution decisions to position-based output because the model’s balance between awareness and conversion mirrors observed buyer behavior.
Data-driven attribution in Google Analytics 4 uses machine learning to assign credit based on observed conversion patterns. The approach in principle produces more accurate weights than fixed-rule models, but Google’s documentation acknowledges the model performs poorly for properties with fewer than 600 monthly conversions per channel. Operators with sufficient volume should run data-driven attribution alongside position-based, treat divergence between the two as a sensitivity test on content investment, and avoid either extreme weighting.
| Model | Credit Distribution | Best For | Content Implication |
|---|---|---|---|
| Linear | Equal across all touchpoints | Default when data is limited | Values all content equally |
| Time-Decay | Weighted toward recent | Short sales cycles (14-30 days) | Favors decision content |
| Position-Based (40/20/40) | First and last emphasized | Balanced view, most lead-gen verticals | Values awareness and decision |
| U-Shaped | First touch + lead-creation moment | Lead-focused organizations | Values content that initiates and converts |
| Data-Driven (GA4) | Algorithmic, per-conversion | Properties with 600+ monthly conversions per channel | Variable; requires divergence analysis |
Implementation Reality
Practical attribution implementation requires technical infrastructure tracking visitor journeys across touchpoints and connecting pre-conversion behavior to post-conversion outcomes. Cookie-based tracking provides the traditional infrastructure, placing identifiers that persist across sessions. Privacy regulations and browser restrictions have degraded cookie reliability, but first-party cookies on owned properties remain functional for most operators.
Server-side tracking addresses cookie degradation by capturing events at the server level rather than relying on client-side tracking. Implementation is more complex but produces more reliable data as browsers continue to restrict client-side capabilities. The architecture stack – server-side events, modeled conversions, MMM and incrementality testing – anchors most cookieless attribution programs.
UTM-parameter discipline ensures campaign-level attribution even when individual journey tracking fails. Every content distribution should include UTM parameters identifying source, medium, campaign, and content asset. Sub-IDs append to UTMs and persist into the lead-posting API so buyers can analyze conversion rates by source over 30-90 day windows and either bid up sources that perform or blacklist sources that do not. Most ping-post platforms support sub-ID passthrough natively.
CRM integration connects pre-conversion tracking to post-conversion outcomes. When leads convert to customers, revenue attribution requires linking the customer record back to the touchpoints that influenced the journey. Most CRMs support custom fields capturing original source, lead-creation source, and conversion source – operators should ensure these fields populate accurately and feed back into content-investment decisions.
Content ROI Calculation by Funnel Stage
Cost Accounting for Content Programs
Content ROI calculation answers the fundamental business question: does the content investment generate returns justifying continued spending? Accurate ROI calculation requires capturing both the full cost of content production and the revenue attribution to content-influenced conversions.
Content costs extend beyond obvious production expenses. A full cost accounting includes writer fees (internal or external), editor time, design and multimedia production, subject-matter-expert involvement, distribution costs (paid promotion, email-platform fees, link-acquisition spend), technology costs (CMS, analytics, attribution platforms), and management overhead. Operators who account only for direct production costs understate true content investment, inflating apparent ROI by factors that often exceed 2x.
Revenue attribution connects content consumption to customer revenue through the chosen attribution model. If a customer worth $5,000 lifetime value converted through a journey where the attribution model assigns 25% credit to content touchpoints, content receives $1,250 revenue attribution. Aggregating these attributions across all customers produces total content-attributed revenue. The Content Marketing Institute’s annual benchmarks document attribution-adjusted ROI distributions across B2B and B2C content programs and provide a useful sanity check on operator-specific calculations.
ROI calculation then follows standard form: (Revenue − Cost) / Cost × 100. Operators should run this calculation by funnel stage as well as in aggregate, since aggregated ROI obscures the asset-level patterns that should drive production decisions.
CPL by Funnel Stage Across Verticals
The economics of content production differ sharply by funnel stage. Top-of-funnel content carries low per-lead conversion rates but high traffic volume; bottom-funnel content reverses both metrics. Operators who model content investment without stage-segmented CPL targets typically over-produce awareness content and under-produce decision content, missing the highest-margin segment of the funnel.
| Funnel Stage | Auto Insurance CPL | Mortgage Purchase CPL | Solar CPL | Personal Injury CPL |
|---|---|---|---|---|
| Awareness (TOFU) | $5-15 | $10-25 | $15-40 | $50-100 |
| Consideration (MOFU) | $30-50 | $60-100 | $75-150 | $150-300 |
| Decision (BOFU) | $40-75 | $90-200 | $125-250 | $275-500 |
Ranges aggregate published benchmarks from HubSpot’s State of Marketing Report, the project’s CPL by industry reference, and lead-network platform-disclosed bidding floors. Specific operators should calibrate against their own conversion data; the table represents directional ranges rather than guaranteed performance.
The CPL gradient by stage carries an implication operators frequently miss: content investment should weight toward consideration and decision stages because the CPL premium at those stages typically exceeds the production-cost premium. A $3,000 calculator that captures 8 leads per month at $80 attributed value produces $640 monthly revenue – payback within 5 months and compounding returns thereafter. The same $3,000 invested in awareness blog posts produces broader traffic but lead capture at 1/3 the rate or less, extending payback to 12-18 months even in well-distributed programs.
Lead-Quality Scoring and Content Origin
Buyer-side lead-scoring engines weight several signals that correlate strongly with content stage of origin. Time-on-site before form submission runs higher for consideration-stage leads (typically 4-12 minutes) than for awareness-stage leads (typically 1-3 minutes). Pages-per-session runs 3-5 for mid-funnel converters versus 1-2 for awareness converters. Referring content type, time-of-day, device class, and consent recency all feed buyer scoring models in regulated verticals.
ActiveProspect and Jornaya capture session-level data via TrustedForm certificates that document the entire journey from first arrival to consent moment, which buyers increasingly require before accepting leads. Operators producing content for ping-post distribution should expose journey signals in lead metadata so buyers can score accurately. Leads sold without journey context typically clear at 20-40% lower prices than equivalent leads with full TrustedForm session replay; in regulated verticals the gap can exceed 50%.
This is the operational consequence of intent-to-lead mapping that topic-first content programs miss: the same lead, captured from the same form, prices differently depending on what content drove the journey and whether that journey is documented. Content strategy is not separate from lead-pricing strategy – the two are functionally identical for operators routing leads to external buyers.
Implementation Pattern for Operators
Phase 1: Intent-Signal Audit and Routing-Map Construction
Implementation begins with systematic mapping of intent signals relevant to the operator’s vertical and the buyer queues those signals can route to. The audit covers existing content (categorized by funnel stage and intent signal addressed), competitor content (mapped to identify both competitive necessities and differentiation opportunities), and buyer-acceptance criteria (which signals translate into accepted leads at acceptable prices).
Most operators discover heavy concentration in one stage – typically awareness – with gaps at consideration and decision. The gaps represent immediate opportunity, particularly when the missing assets are calculator or comparison-tool formats that capture PEWC-compliant consent at consideration depth. Routing-map construction tags each existing and planned asset with the intended buyer queue, expected CPL, and required consent infrastructure.
Phase 2: Production Prioritization and TCPA-Compliant Form Architecture
With intent signals mapped, gap analysis identifies the highest-priority content needs. Production prioritization combines signal value (correlation with conversion), opportunity size (search volume, audience size, ping-post buyer demand), and competitive gap (how underserved is this signal by existing content). High-value signals with large audiences and limited competition represent primary targets.
Content briefs for priority topics specify the intent signal addressed, funnel stage, target audience, key messages, conversion-path design, sub-ID schema, and required PEWC consent architecture. Forms should be built PEWC-compliant from the first version – retrofitting consent into existing capture flows typically requires rebuilding the entire form, breaking historical attribution data and creating gaps in TrustedForm session continuity.
Production velocity should match strategic needs. Operators with significant content gaps may need accelerated production (3-5 pieces weekly) to achieve baseline coverage; steady-state operations typically produce 1-2 high-quality pieces weekly. Quality should never be sacrificed for velocity – mediocre content fails to achieve strategic objectives regardless of volume, and underperforming assets often acquire low-confidence buyer reputations that persist for months.
Phase 3: Attribution and Sub-ID Infrastructure
Attribution infrastructure should be established concurrent with content production. Minimum viable tracking includes UTM-parameterized links for all content distribution, Google Analytics 4 with content groupings by funnel stage, sub-IDs in the lead-posting API, and CRM fields capturing lead-source information. Enhanced tracking adds multi-touch journey capture, server-side tracking for privacy resilience, dedicated attribution platforms, and TrustedForm session replay tied to lead records for buyer reporting.
Initial attribution model selection should balance accuracy with operational simplicity. Operators without attribution experience should start with position-based models (40/20/40) that acknowledge multiple touchpoints without requiring complex weighting decisions. As operators gain experience with attribution data, they can refine toward models calibrated to specific journey patterns and add data-driven attribution as a parallel reference once monthly conversion volume exceeds the GA4 threshold.
Phase 4: Optimization, Buyer Feedback Loop, and Content-Paid Coupling
With production and attribution operational, continuous optimization maximizes program returns. A/B testing on conversion elements within high-performing content typically produces 15-40% capture-rate gains per test cycle, compounding into substantial lead-volume improvements at the portfolio level.
The buyer feedback loop converts content optimization into revenue optimization. Ping-post buyers report sub-ID-level conversion data back to operators through standard reporting interfaces. Sub-IDs that consistently produce conversions earn higher floor prices and qualify for placement with premium buyers; sub-IDs that consistently fail to convert get blacklisted and the underlying content asset retired or rebuilt.
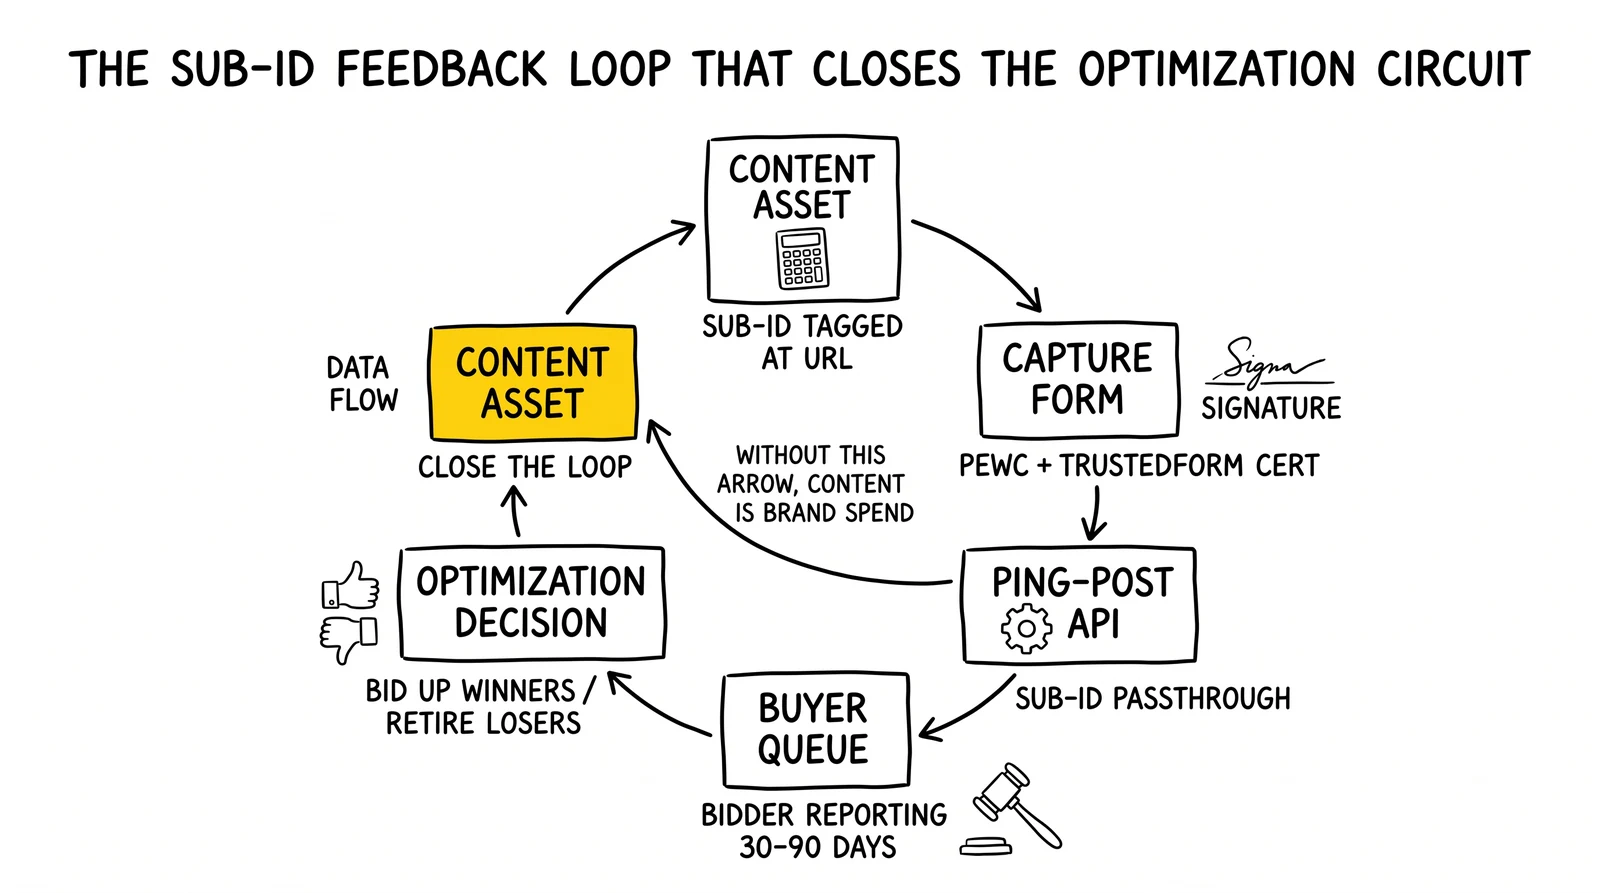
Content-paid coupling closes the optimization circuit. An operator who identifies a high-converting consideration-stage piece through organic data should run paid traffic (Google Ads, Meta Ads, native via Taboola or Outbrain) to that piece at a CPC producing lead CPL within target. The reverse also works: paid-traffic data identifies which intent signals convert at acceptable cost, and content production prioritizes assets addressing those signals. Operators who treat content and paid as separate disciplines forfeit the optimization loop that makes both more efficient.
Common Failure Modes
Production Without Routing Strategy
The most common content failure is producing content without routing intent – writing about topics because they seem interesting rather than because they feed a defined buyer queue at acceptable CPL. The result: high-traffic content libraries that generate engagement metrics without generating sellable leads.
The symptom: high-traffic content with low conversion rates across the portfolio, lead capture concentrated in a small subset of assets, and aggregate CPL above target despite individual asset performance reports suggesting otherwise. Visitors arrive but do not progress toward capture because no progression was designed; the leads that do convert score poorly in buyer scoring engines because journey signals indicate research mode.
The fix: every content piece should have documented strategic purpose tying content asset to intent signal, funnel stage, target buyer queue, expected CPL, and required consent infrastructure. Content without clear strategic purpose should not enter production regardless of how appealing the topic seems.
Funnel-Stage Mismatch
Creating content appropriate to one funnel stage while deploying conversion offers appropriate to a different stage produces friction and poor results. Awareness content with aggressive demo CTAs, or decision content with newsletter signup offers, both fail because the offer does not match audience readiness and the resulting lead profile does not align with what buyers in either tier will pay for.
The fix: audit content-to-offer alignment systematically. Each content piece should have offers appropriate to its funnel stage and audience readiness level, with form architecture matching the consent and journey-signal requirements of the intended buyer queue.
Attribution Neglect and Sub-ID Gaps
Operating content programs without attribution measurement makes ROI optimization impossible and leaves content-investment decisions to intuition rather than evidence. Operators without attribution tend toward either under-investment (because content’s contribution is invisible) or mis-investment (because allocation cannot be optimized without performance data). Sub-ID gaps create a parallel failure mode at the buyer-reporting layer: without sub-ID continuity through the lead-posting API, operators cannot tie buyer-reported conversion data back to specific content assets, and the optimization loop breaks.
The fix: implement attribution measurement appropriate to operational scale. Even basic UTM tracking with CRM source capture and sub-ID passthrough enables directional attribution analysis. Dedicated attribution platforms add precision but are not prerequisites for operating a measurable content program.
Distribution Underinvestment
Excellent content that nobody sees represents a costly failure mode. Content requires distribution investment proportional to production cost – a $3,000 detailed guide that reaches 500 people wastes most of its value because the lead-capture rate cannot scale below a certain audience floor.
The fix: budget distribution investment alongside production investment. A reasonable guideline allocates at least 50% of total content budget to distribution (paid promotion, email distribution, social amplification, SEO link investment) rather than production alone. The landing-page optimization reference covers the conversion-rate side of distribution efficiency.
Key Takeaways
-
Topic-first content fails lead-gen economics. Content programs that begin with keywords rather than routing destinations produce traffic without sellable leads. Operators should design every asset backward from the buyer queue it feeds and the CPL the unit economics support.
-
TCPA capture feasibility differs by funnel stage. Awareness content rarely supports PEWC; consideration and decision forms must be built PEWC-compliant from launch because retrofitting consent breaks historical attribution and TrustedForm session continuity.
-
CPL ranges by stage and vertical anchor production decisions. Consideration and decision content typically command CPL premiums that exceed production-cost premiums, weighting investment toward calculators, comparison tools, and case studies rather than awareness blog volume.
-
Sub-ID infrastructure is non-negotiable for operators routing to ping-post buyers. Without sub-ID continuity from first touch through lead-posting API to buyer reporting, asset-level optimization is impossible and content investment defaults to brand spend.
-
TrustedForm session replay determines buyer pricing. Leads sold without journey context clear at 20-40% lower prices than equivalent leads with full session capture. Operators in regulated verticals should treat ActiveProspect or Jornaya integration as foundational rather than optional.
-
Position-based attribution serves most lead-gen verticals. The 40/20/40 model balances awareness and decision credit appropriately for long-cycle verticals; data-driven attribution requires conversion volume thresholds many operators do not meet.
-
Content-paid coupling closes the optimization loop. Organic data identifies which content converts; paid traffic scales those proven assets. Treating the two channels as separate disciplines forfeits the optimization gains that make both more efficient.
-
Distribution should match or exceed production investment. Content programs that under-fund distribution produce small-audience assets with insufficient lead volume to support their fixed costs. Allocating 50%+ of content budget to distribution is a reasonable operating floor.
Sources
- Federal Communications Commission – Telephone Consumer Protection Act Rules and Regulations, FCC.gov, 2024 – Tier 1, primary regulatory source on PEWC standards and autodialer consent requirements
- Federal Trade Commission – FTC’s Endorsement Guides, FTC.gov, 2024 – Tier 1, primary source on lead-generation marketing disclosure requirements
- HubSpot – 2024 State of Marketing Report, HubSpot Research, 2024 – Tier 2, source for content marketing benchmarks and lead conversion rate data
- Demand Gen Report – 2024 B2B Buyer Behavior Study, Demand Gen Report Research, 2024 – Tier 2, source for the finding that 47% of B2B buyers consume three to five content pieces before vendor engagement
- Solar Energy Industries Association – Solar Market Insight Report, SEIA, Q4 2024 – Tier 2, source for solar vertical seasonal demand patterns and geographic CPL variation
- Content Marketing Institute – B2B Content Marketing Research and Benchmarks, CMI, 2024 – Tier 2, source for content program ROI distribution data
- ActiveProspect – TrustedForm Documentation and Buyer Specifications, ActiveProspect, 2024 – Tier 3, primary source for consent certification and session-replay infrastructure
- Google – GA4 Attribution Model Reference, Google Analytics Help, 2024 – Tier 3, primary source for data-driven attribution methodology and minimum-volume thresholds
- Google – Customer Journey to Online Purchase, Think with Google, 2024 – Tier 3, source for multi-touchpoint purchase research patterns
This analysis reflects content strategy practice for U.S. lead-generation operators as of April 2026. Vertical CPL ranges, TCPA enforcement posture, and ping-post pricing dynamics evolve continuously – operators should calibrate against current vertical data and consult counsel on consent capture before launching new funnel architecture.