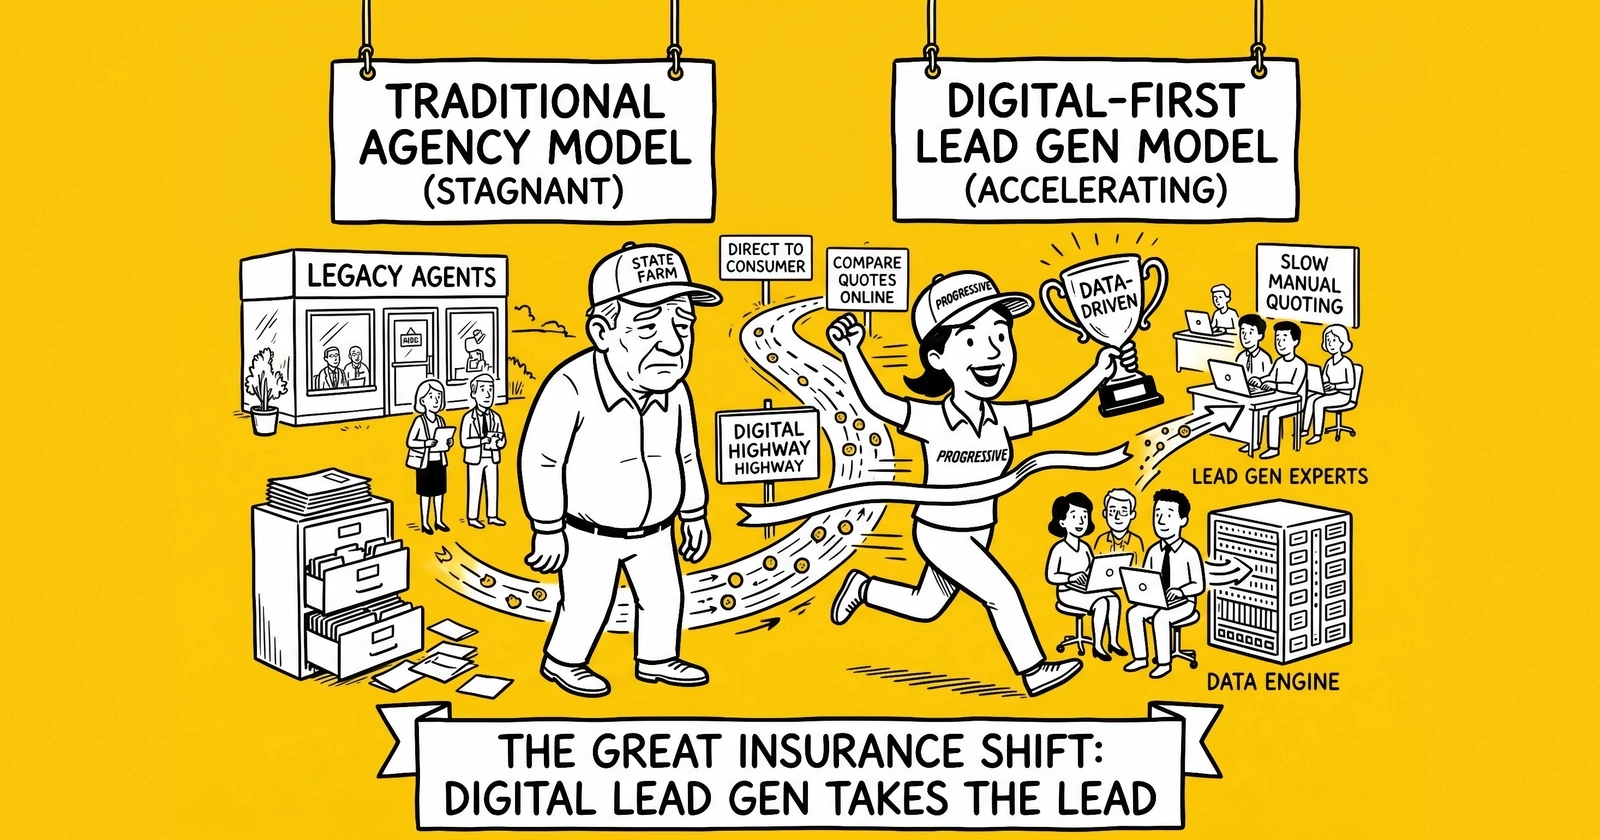
Eighty-four years of State Farm leadership at the top of the U.S. personal auto insurance market ended quietly in a single S&P Global Market Intelligence note dated May 18, 2026 – and the structural read for auto-lead aggregators, broker panels, and carrier-direct teams is more consequential than the headline.
The S&P Finding That Closed the 84-Year Run
On May 18, 2026, S&P Global Market Intelligence published a market-research note with a single conclusion the U.S. personal auto insurance industry had been approaching for at least six quarters: Progressive Corporation’s trailing-12-month U.S. private auto direct premiums written had passed State Farm’s for the first time since State Farm became the country’s largest personal auto insurer in 1942. The S&P GMI estimate put Progressive at approximately $70.2 billion in trailing-12-month direct premiums written through March 31, 2026, against State Farm’s $68.7 billion – a gap of roughly $1.5 billion, with State Farm’s premium base sliding 0.1 percent over the same period while Progressive’s grew 11.6 percent.
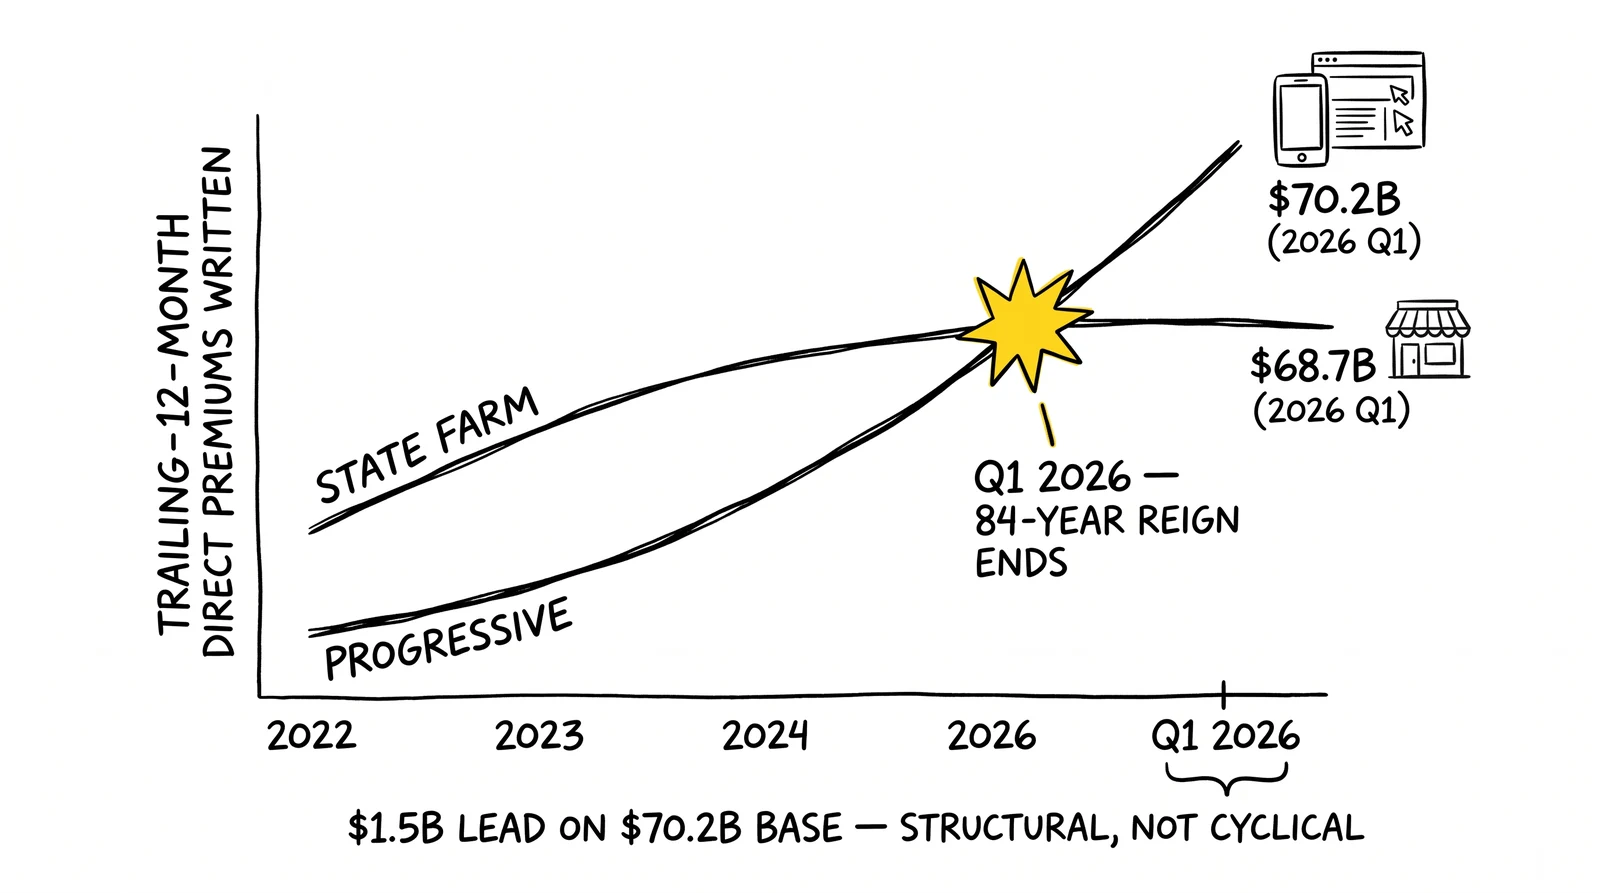
The single-quarter print was the visible event. Progressive booked approximately $18.1 billion in private auto direct premiums written in Q1 2026, against State Farm’s roughly $17.1 billion – the first time in the matchup’s recorded history that Progressive cleared State Farm inside a single quarter. The trailing-12-month leadership change followed mechanically from the multi-quarter compounding of similar gaps and was confirmed publicly within ten weeks of the quarter’s close.
The historical anchor matters. State Farm had ranked as the No. 1 U.S. personal auto insurer continuously since 1942 – five years before Progressive’s founding – and held that position through the post-war captive-agent build-out, the 1970s independent-agent expansion of competitors, the 1990s GEICO direct-mail surge, the 2000s Progressive direct-channel build, and the 2020s loss-cost shock that compressed combined ratios across the industry. Eighty-four years of leadership change in a single S&P bulletin is the kind of structural inflection that the auto-insurance lead generation funnel prices around for the next decade.
This article covers what the overtake means for the lead-generation industry specifically: how the dominant carrier’s distribution model shifts the pricing benchmark for aggregator panels, why the carrier-direct bid now anchors paid-media auctions in ways the captive-channel era did not, what the second-order effects are at MediaAlpha, EverQuote, LendingTree, and QuinStreet, and what the operational responses should be in the next 60 to 180 days.
What Actually Changed: Channel Mix, Not Just Numbers
The most common reading of the overtake – Progressive grew faster, State Farm grew slower, the cumulative arithmetic finally tipped – captures the surface but misses the structural read. The deeper change is in which distribution channel now sets the pricing benchmark for the largest pool of personal auto premium in the country.
State Farm’s captive-agent model – the prior price-setter
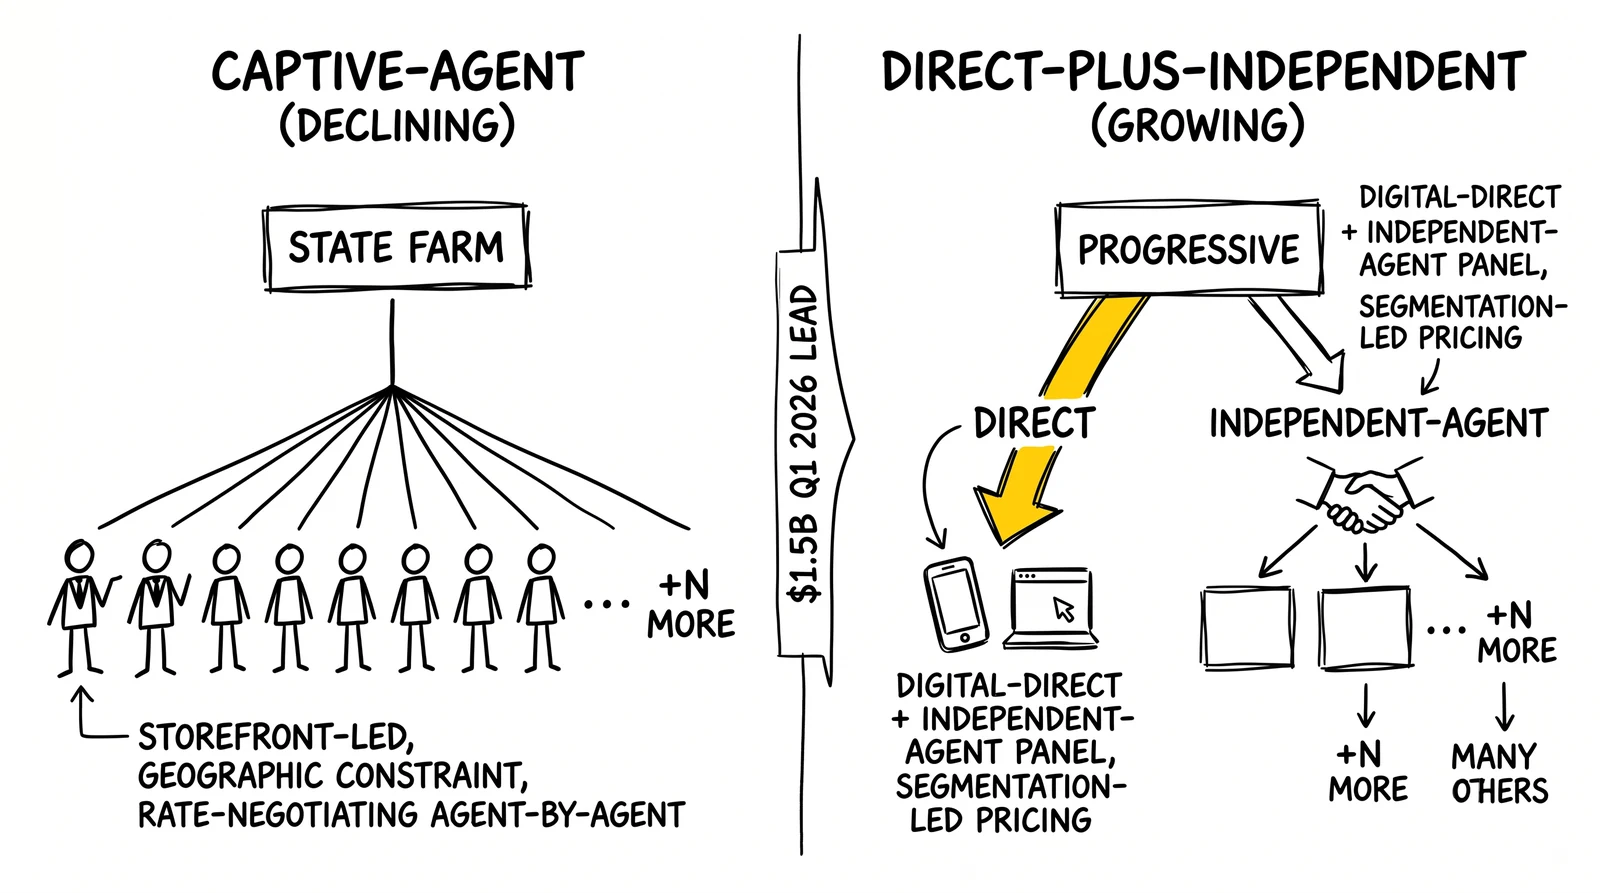
State Farm’s leadership through eight decades rested on a captive-agent channel of approximately 19,000 exclusive agents who sold State Farm and only State Farm. The channel’s strengths were structural: brand consistency, multi-line cross-sell (auto, home, life, banking) inside a single agent relationship, and an underwriting model that rewarded long-tenure customers with multi-line discounts that aggregators could not replicate. The channel’s weaknesses became structural in the 2020s: a cost base estimated by agents on industry forums at roughly 15 percent of premium just to support the captive-agent infrastructure, an acquisition motion concentrated in agent-driven cross-sell rather than paid-media bid efficiency, and a limited ability to participate in the price-comparison shopping behavior that came to dominate Gen X and Millennial auto-insurance acquisition.
The implication for the lead-generation industry was straightforward through most of the captive era: State Farm did not buy materially from third-party aggregator panels at the carrier level. Captive agents purchased local-market lead inventory directly through agent-buyer programs at MediaAlpha, EverQuote, and other marketplaces, but at per-agent volumes that did not anchor the carrier panel. The marketplace’s pricing benchmark was anchored by Progressive, GEICO, and Allstate – the carriers with substantial direct-acquisition teams bidding into the same auctions aggregators bid into. State Farm’s leadership in policies-in-force terms was real, but its absence from the carrier-side aggregator-bid pool meant the price-setting was already done by the No. 2 carrier in the market.
That asymmetry is part of why the overtake’s structural read is not merely “the larger carrier changed.” The aggregator-relevant carrier changed only in terms of which carrier sets the renewal-policy denominator that funds incremental marketing spend – and now that denominator is at Progressive, which already anchored the paid-media auction.
Progressive’s direct-and-independent-agent model – the new dominant denominator
Progressive’s distribution model is structurally different from State Farm’s in three dimensions that matter for lead-gen operators.
First, the company runs the largest direct-to-consumer acquisition machine in the personal auto market by ad spend. S&P Global Market Intelligence reported that Progressive’s advertising expenditure hit a record approximately $3.5 billion in 2024, up roughly 187 percent from the $1.22 billion spent in 2023, with first-half 2025 spending around $2.4 billion. The direct channel is the company’s primary growth engine, and the direct-acquisition arms race detailed in the Q1 2026 earnings analysis shows that the spend trajectory is accelerating rather than plateauing.
Second, Progressive operates through approximately 38,000 independent agents – roughly twice State Farm’s captive count – which means the carrier participates in the agent-channel inventory aggregators route to as well as in the direct-channel auctions. The independent-agent channel is structurally lower-cost per policy than the captive-agent channel because agents carry their own overhead and operate across multiple carrier appointments rather than as exclusive State Farm employees. That cost-structure advantage feeds back into the per-policy economics that bound carrier-direct CPC bids.
Third, the company has invested heavily in segmentation infrastructure – telematics through Snapshot, real-time underwriting filters integrated with paid-media bid logic, and risk-priced cohort acquisition – that GEICO and State Farm have approached more cautiously. The segmentation infrastructure means Progressive can bid asymmetrically on the cohorts its underwriting model favors and bid down on the cohorts that fail filters, which produces a higher effective CPC on the prospects aggregators are also competing for.
The combined effect: the carrier whose distribution model anchors the largest paid-media auctions, the largest independent-agent panel, and the most sophisticated segmentation infrastructure has now also assumed the largest renewal-premium base in the personal auto market. The structural compounding effect runs in Progressive’s favor across every dimension that matters for the aggregator panel pricing model.
Why the Overtake Is a Lead-Gen Industry Event, Not Just an Insurance Event
The lead-generation industry rarely treats carrier earnings as breaking news. Quarterly prints from Progressive, GEICO, Allstate, and Berkshire Hathaway move through industry channels as data points rather than as structural events. The State Farm overtake is the exception, and the reason is specific to how the lead-gen industry prices its inventory.
The carrier-direct bid is the auction floor
In auto-insurance lead generation, the per-lead price an aggregator can sustainably charge is bounded above by the carrier’s internal cost-per-policy benchmark net of the conversion friction the aggregator carries – qualification rate, contact rate, bind rate. When the leading carrier’s direct-acquisition team is bidding aggressively in the same Google and Meta auctions the aggregator bids into, the aggregator’s per-prospect media cost rises faster than the per-lead price the carrier will pay. Margin compresses.
The mechanism is purely mathematical. A carrier that can acquire a policyholder directly at $400 in marketing cost will pay an aggregator only what the aggregator can deliver below that internal benchmark net of conversion friction. As the carrier’s direct-acquisition efficiency improves – and Progressive’s improvement is now the documented trajectory – the per-lead price the aggregator can sustainably charge falls. The S&P overtake confirms that the carrier whose efficiency improvements are setting the floor is also now the carrier with the largest renewal-premium base funding the next round of efficiency improvements.
The compounding mechanic is the part that distinguishes the overtake from a quarterly news cycle. Progressive added an estimated 3.3 million net policies in the trailing twelve months through Q1 2026 at a per-policy lifetime margin in the range of $1,500 to $2,500 over a four-to-five-year retention horizon. The incremental renewal-premium pool from that policy growth – somewhere in the order of $5 billion to $8 billion in additional retained premium over the retention curve – funds the next two years of acquisition spend without requiring any external capital. Aggregators do not have an equivalent compounding mechanic; per-lead revenue does not carry through retention curves at the aggregator level.
Panel pricing power follows the dominant participating carrier
A second, more subtle implication: the pricing power inside an aggregator panel reflects which carrier the panel can plausibly route incremental inventory to at a clearing per-policy economics. In the captive era, with State Farm absent from the aggregator panel at material volume, the panel’s pricing power rested on Progressive, GEICO, and Allstate’s appetite. Aggregators ran panels organized around those three carriers’ filters, fraud thresholds, and per-lead pricing tiers, with State Farm captive-agent inventory layered on as an agent-channel side flow.
In the post-overtake configuration, Progressive’s panel slot is structurally more important than it was a quarter ago. The aggregator’s ability to credibly route high-quality inventory to Progressive – at a clearing per-policy economics – is now the dominant determinant of the panel’s overall pricing power. The marketplace cannot credibly threaten to send Progressive’s panel slot to State Farm if Progressive’s terms tighten; State Farm does not participate at carrier-direct volume. The marketplace also cannot credibly threaten to send the slot to GEICO at the same intensity Progressive demands, because GEICO is running a deliberately moderate ramp under Berkshire Hathaway’s underwriting discipline.
The implication is that Progressive’s marketplace-side negotiating leverage strengthens through the back half of 2026, and aggregator panels carrying meaningful Progressive volume should expect Progressive-side bid reprices on a more aggressive cadence. The aggregators that have already shifted to quarterly contract renegotiation with carrier-bid-indexed pricing – as discussed in the Q1 2026 direct-acquisition arms race analysis – will absorb the pressure with margin protection. Aggregators on annual fixed-price schedules will absorb it at the per-lead margin line.
MediaAlpha and EverQuote – Q1 2026 strength as a leading-edge view
The carrier-direct compression model is consistent with – not contradicted by – the strong Q1 2026 numbers reported by the two largest publicly traded auto-insurance lead marketplaces. MediaAlpha reported Q1 2026 revenue of approximately $310 million, above the high end of guidance, with adjusted EBITDA of roughly $31.4 million. EverQuote reported Q1 2026 revenue of $190.9 million, up 15 percent year over year, with adjusted EBITDA of $29.3 million, up 30 percent. Both attributed growth to broader carrier participation and to combined ratios in the 80s freeing carrier ad budgets.
What the strong Q1 prints reflect is the demand side of the equation – carriers spending more in aggregate as underwriting profitability allows them to. What they do not yet reflect is the supply-side compression that arrives when the dominant carrier’s per-policy economics improve faster than the marketplace’s per-transaction take rate. The Q1 reads are the high-water mark of carrier-spend demand. The Q3 and Q4 reads will be the early signal of whether the carrier-direct bid floor has begun to compress marketplace take rates structurally. Operators reading MediaAlpha and EverQuote’s earnings transcripts for the lead-gen industry signal should focus on the take-rate-per-converted-policy commentary in the back half of 2026, not on the Q1 demand strength.
The Distribution-Model Read: Why Captive Lost to Direct-Plus-Independent
State Farm’s loss of the top position is not the result of a single misstep or a one-quarter underwriting shock. It is the visible output of a multi-decade structural divergence in distribution-model economics that the 2022-2023 loss-cost shock accelerated rather than caused.
The captive-agent cost base
State Farm’s approximately 19,000 captive agents represent both the company’s historical strength and its structural cost burden. Each captive agent operates an office with rent, staff, benefits, and administrative overhead funded out of the commission structure State Farm pays – a cost structure agents on industry forums have estimated runs at roughly 15 percent of premium. The captive base supports very strong cross-sell economics (multi-line auto-home-life) and very high retention rates among existing customers, but it does not scale efficiently against the new-customer acquisition motion that paid-media-led carriers run.
The structural challenge for State Farm intensified through 2024 and 2025 as the loss-cost shock that compressed combined ratios across the industry forced rate increases that arrived faster than the captive-agent channel could communicate, retain, or cross-sell against. Customers who shopped – and the industry-wide “unprecedented shopping activity” Berkshire’s Greg Abel described in Q1 2026 commentary is the measurable signal of this – found that Progressive, GEICO, and direct-channel competitors had rate filings and segmentation models that produced lower quotes for substantial customer cohorts. State Farm’s response was constrained by the captive-channel cost structure; the company could not reduce average premium without eroding the agent-commission structure that funded the channel.
State Farm is now restructuring captive-agent compensation in response. The Annual Investment Payment Program – the deferred-compensation scheme central to many captives’ retirement plans – continues through 2028, with payments after 2028 tied to performance targets. The direction-of-travel is compression and specialization of the captive channel rather than its elimination, but the compression itself reduces the marketing-budget room State Farm has to fund agent-side acquisition. That budget contraction flows downstream to the agent-buyer side of aggregator transactions: agent buyers competing against State Farm captives in local markets have less pricing flexibility, which compresses the per-lead price aggregators can charge agent buyers in those markets.
The direct-and-independent-agent advantage
Progressive’s hybrid distribution model captures the cost structure of independent agents (lower per-policy overhead than captives) combined with the scale economics of direct acquisition (paid media at $3.5 billion annual run-rate). The independent-agent channel produces approximately half Progressive’s policy mix; the direct channel produces the other half. Both channels reinforce the segmentation infrastructure that the company has invested in over two decades.
The key economic advantage is that neither channel carries the captive-agent fixed-cost overhead. Independent agents operate their own offices, carry their own overhead, and earn commissions on policies they bind across multiple carrier appointments. Direct-channel acquisition costs are variable rather than fixed: paid-media spend scales up or down with auction conditions, and the carrier can pull bids on cohorts that fail underwriting filters without disrupting a captive-agent compensation structure. The combination produces a per-policy cost-to-acquire that is structurally lower than the captive-channel cost-to-acquire, and the per-policy lifetime margin that runs through the retention curve produces a larger renewal-premium pool to fund the next year of acquisition.
The overtake is the visible output of this structural divergence. It is not a single-event reversal that captive-channel-led carriers can engineer back; it is a multi-year compounding gap that widens with each renewal cycle.
What State Farm could do – and why most options are slow
Three responses are theoretically available to State Farm. The first is to invest in direct-channel infrastructure at scale – paid media, segmentation, real-time underwriting integration – to compete in the same auctions Progressive bids into. The challenge is that direct-channel build takes years, not quarters, and competing against Progressive’s two decades of segmentation investment from a standing start is a structural disadvantage. The second is to modernize the captive-agent channel – combining agents with digital tools and AI to reduce the per-agent cost-to-serve while preserving the cross-sell economics. The challenge is the negotiation with the agent base; reducing the captive-cost burden requires either fewer agents or different compensation terms, and both create channel-conflict risk. The third is acquisition or partnership – buying a direct-channel platform or partnering with an aggregator at carrier-level depth. The challenge is that the available acquisition targets are smaller than the gap State Farm needs to close.
None of these responses produces a 12-month reversal of the trajectory. The realistic State Farm posture through 2026 and 2027 is to defend the captive-channel renewal book against further shopping erosion while building direct-channel and AI-driven capacity that begins to contribute by 2028. The aggregator-side implication is that State Farm’s contribution to the marketplace pricing benchmark stays muted through the medium term, and Progressive’s contribution stays dominant.
How GEICO and Allstate Fit Into the New Configuration
The four-carrier picture at the top of the U.S. personal auto market – Progressive, State Farm, GEICO, Allstate, with USAA as a constrained-eligibility fifth – defines the carrier-side participation profile that aggregator panels are organized around. Two of the four are now moving in different directions than the past several years suggested.
GEICO – the moderating ramp under Berkshire discipline
GEICO’s Q1 2026 print reflected the most pronounced Berkshire-style underwriting discipline. Pre-tax underwriting profit fell to approximately $1.42 billion from $2.17 billion a year earlier – a roughly 35 percent decline – while written premiums grew only 1.5 percent to $11.7 billion. The decline was driven primarily by lower average premiums per private passenger auto policy as carriers responded to the broader market’s pricing softening, partially offset by growth in commercial auto business.
The strategic posture is consistent with GEICO’s behavior through 2022-2023, when the company explicitly throttled marketing spend to defend underwriting margin and accepted multi-year share loss as the trade-off. Berkshire CEO Greg Abel told shareholders in Q1 2026 commentary that the auto market was seeing “unprecedented shopping activity” as the industry softens after three years of steep rate hikes – a warning that the easy growth window has closed and that GEICO would continue running disciplined rather than aggressive acquisition spend.
For aggregator panels, GEICO’s gradual ramp is a partial offset to Progressive’s acceleration. GEICO does not contest the largest paid-media auction inventory at the same intensity Progressive does, which leaves clearing CPCs on some inventory lower than a fully aggressive two-carrier configuration would produce. The offset is partial, not full: GEICO’s gradual ramp is still upward-sloping, and Progressive’s acceleration is large enough on its own to set the auction floor in many segments. But the GEICO posture is the reason the compression on aggregator margin is steep rather than catastrophic.
Allstate – the rebalancing carrier
Allstate ranked fourth among U.S. auto insurers by 2024 direct premiums written, at approximately $37.24 billion in DPW. The company has been more explicit than Progressive or GEICO about its strategic shift from a captive-agent-dominant model toward a more balanced direct-and-agent model, and its 10-K disclosures since 2024 have detailed the direct-channel ramp. The Q1 2026 print confirmed the directional signal: Allstate’s combined ratio trajectory continued to improve, and the marketing-spend disclosure pointed toward direct-channel expansion through the back half of 2026.
The aggregator-relevant signal at Allstate is that the carrier is now structurally similar to Progressive in terms of channel mix – direct-and-independent-agent – even if its scale is smaller. Allstate’s direct-channel bid pressure adds to Progressive’s in the same paid-media auctions, and Allstate’s independent-agent channel competes for the same aggregator panel slots Progressive’s does. The combined pressure on aggregator margin is materially stronger with Allstate moving in this direction than it would be in a scenario where Allstate held its captive-agent posture.
USAA – the constrained-eligibility offset
USAA’s $22.14 billion in 2024 DPW ranked fifth and is constrained to military-affiliated members. USAA does not bid into open paid-media auctions at the intensity the other top-four carriers do, and its aggregator-panel participation is limited by the eligibility constraint. USAA’s role in the aggregator landscape is a slight stabilizer rather than a competitive force; aggregator panels routing inventory to USAA-eligible prospects do so through specific filters rather than as a general carrier panel slot. The overtake at the top of the market does not change USAA’s contribution materially.
Berkshire Hathaway, Auto-Owners, American Family – the long tail
Berkshire Hathaway as a group ranked third at approximately $44.4 billion in 2024 DPW (predominantly GEICO). Auto-Owners Insurance Group at $7.31 billion DPW (up 20 percent in 2024) and American Family at $6.47 billion DPW (up 8.2 percent) round out the upper-middle tier of carriers. The aggregator-panel implication is that the second-tier carriers continue to grow share, and some are growing share faster than the top-four carriers. Aggregators with diversified panel composition – not over-concentrated in the top-three – have a less exposed position than aggregators relying on Progressive, State Farm, and GEICO as the dominant buyers.
The Lead-Gen Operator Read: Three Operational Implications
The structural read is durable enough to inform 60-to-180-day operational decisions. Three implications are most immediate.
Implication one: panel composition mapping by carrier-channel exposure
The first operational move is to map current panel composition by carrier-channel exposure, not just by carrier name. Inventory routed to Progressive-direct-channel buyers carries different compression risk than inventory routed to Progressive-independent-agent-channel buyers, which carries different risk again from inventory routed to State Farm captive agents.
Progressive-direct-channel inventory faces the steepest immediate compression – the carrier-direct bid floor is rising fastest in this segment, and per-lead pricing is most exposed. Progressive-independent-agent inventory faces moderate compression – agents have more flexibility than carrier-direct teams, but the channel’s per-policy economics improve in parallel with the direct-channel improvements. State Farm captive-agent inventory faces a different shape: the carrier’s budget contraction reduces the agent-side per-lead price, which is a buyer-side compression rather than a supply-side compression. GEICO inventory faces lighter compression due to the moderating ramp. Allstate inventory faces moderate-to-steep compression as the direct-channel build accelerates.
Operators who have not mapped panel composition by carrier-channel exposure should treat that mapping as the first 30-day priority. The mapping informs contract repricing priorities (which buyer relationships need quarterly cadence first), inventory-mix shift priorities (which carrier-undervalued cohorts to chase first), and capital-allocation priorities (which buyer-side relationships warrant additional investment).
Implication two: bid-indexed pricing as a structural defense
The second operational move is to renegotiate buyer contracts to carrier-bid-indexed pricing rather than annual fixed-price schedules. The bid-indexed structure has been the dominant recommendation in the direct-acquisition arms race analysis for several months. The S&P overtake reinforces the recommendation by making the dominant carrier’s bid pressure structurally durable rather than cyclically variable.
The implementation reality is that bid-indexed pricing requires either a third-party CPC data source the index can reference, the aggregator’s own auction-loss telemetry as a published index, or a hybrid. Buyer-side acceptance depends on the buyer’s perception of the index’s neutrality; carriers generally accept third-party-sourced indexes more readily than aggregator-published indexes. The legal work of drafting indexing language is non-trivial; aggregators without specialized contracting counsel typically produce weaker indexing terms than aggregators who invest in the legal work. The realistic timeline for top-5 buyer renegotiation is 60 to 90 days; full-panel renegotiation runs 120 to 180 days.
The operators who complete the renegotiation before Q4 2026 will absorb the back-half-2026 compression with margin protection. The operators who do not will absorb it at unchanged contractual prices.
Implication three: inventory dimensions Progressive undervalues
The third operational move is to shift inventory mix toward conversion-quality dimensions Progressive’s segmentation infrastructure undervalues. Progressive’s bid logic is most aggressive on the cohorts the lifetime-value model favors: full-file consumers in carrier-preferred geographies with vehicle profiles inside the preferred mix and short conversion-velocity profiles. The bid is less aggressive on thin-file consumers, prospects in geographies where the underwriting filter is restrictive, prospects with vehicle profiles outside the preferred mix, and prospects whose conversion-velocity profile suggests longer time-to-bind.
Aggregators shifting toward the undervalued cohorts take on more complex qualification logic and longer prospect-to-bind cycles in exchange for less direct competition with Progressive’s bid. The trade-off is justifiable: per-lead pricing in the undervalued cohorts compresses less, and the overall margin profile on the inventory mix improves. The build cost is qualification-logic engineering (60 to 120 days) plus segment-level analytics infrastructure (40 to 80 days). Aged-lead segments are one of the cohorts in this category – carrier-direct models prefer fresh acquisition over aged-arbitrage cohorts that have specific conversion patterns the direct-acquisition bid logic does not optimize for.
The combined effect of the three implications is to reposition the aggregator from a per-lead seller competing against Progressive’s segmentation-led bid logic to an operator with diversified channel exposure, bid-indexed pricing protection, and inventory mix differentiated against the Progressive-favored cohorts. The repositioning is structurally more durable than the prior model, and the operators completing it through 2026 will be the operators with the strongest 2027 P&L.
The Broader Industry Signal: Direct-Plus-Segmentation as the New Default
The State Farm overtake is the most visible signal of a broader industry transition that extends beyond personal auto insurance into the full lead-generation landscape. The pattern is that direct-acquisition-and-segmentation-led carriers are displacing captive-agent-led carriers as the price-setters in every personal-lines vertical with parallel distribution structures.
Medicare – the next vertical to watch
The Medicare Advantage and Medicare Supplement vertical has historically been dominated by carrier-direct mailers and call-center programs at UnitedHealthcare, Humana, and Aetna, with captive-and-independent-agent channels carrying the rest of the volume. The 2026 carrier exit pattern – UnitedHealthcare dropping 109 counties, Humana retreating from approximately 89 percent to 85 percent of U.S. counties, Aetna closing roughly 90 plans – is producing a displaced-beneficiary cohort that captive and independent agents are competing for at the local level. Aggregators routing Medicare leads should expect a similar structural shift over the next 18 months: the carriers that retain direct-acquisition capacity through the carrier-exit cycle will set the bid floor in the post-exit landscape, and the captive-channel-led participants will face compression of their agent-channel cost structure. The pattern mirrors the auto vertical’s trajectory.
Home insurance – the climate-stressed parallel
The home insurance vertical is going through a different shape of the same structural shift. Florida and California non-renewal rates at multi-year highs (Florida at approximately 3.35 percent, California at 3.18 percent in 2026 reporting) are forcing buyer-side concentration: fewer carriers willing to bind in the most exposed geographies, and the carriers that retain direct-acquisition capacity in those markets command pricing power. Aggregator panels in home insurance face buyer-base contraction in the most affected geographies. The aggregators best positioned through 2027 are those with diversified geographic exposure and inventory dimensions that the retained carriers value.
Life insurance and the captive-modernization opportunity
The life insurance vertical is the inverse case: captive-agent channels at Northwestern Mutual, MassMutual, New York Life, and Prudential still command meaningful share, and the direct-channel build has been slower than in auto. The State Farm overtake in auto is a leading indicator of what happens to captive-channel-led carriers when the direct-channel competitors invest in segmentation infrastructure faster than the captive base can be modernized. Life-insurance lead operators should treat the auto-vertical overtake as a 36-to-60-month forward signal for their own vertical’s trajectory.
The common pattern across verticals: the carrier whose distribution model couples direct acquisition with segmentation infrastructure becomes the price-setter for the vertical, and aggregator panels reprice around that carrier’s bid logic. The State Farm overtake is the canonical case study of the transition.
What Would Falsify the Structural Read
The carrier-direct-floor argument is conditional on observable behavior. The same falsification framework that applied to the Q1 2026 earnings analysis applies here, with State-Farm-specific signals to add.
The argument should be reweighted or abandoned if the following evidence appears in the next two quarters:
- State Farm recapture of trailing-12-month leadership. If Q2 2026 or Q3 2026 prints show State Farm closing the gap rather than widening it, the overtake is a single-quarter inflection rather than a structural transition. Watch for the S&P Global Market Intelligence quarterly note updating the ranking through the next two cycles.
- Progressive marketing-spend pullback without policy-count slowdown. If Progressive’s 10-Q discloses materially reduced advertising and marketing expense while policy-in-force growth holds – implying the company is achieving share gains through retention and cross-sell rather than incremental acquisition – the auction-floor pressure on aggregators weakens. Watch the second-half-2026 quarterly advertising-expense disclosures.
- State Farm direct-channel announcement at scale. If State Farm publicly announces a multi-billion-dollar direct-channel investment program or an acquisition of a direct-channel platform, the structural divergence narrative changes. The realistic timeline for such an announcement is 12 to 24 months, but a faster move would warrant reassessment.
- MediaAlpha or EverQuote take-rate-per-policy compression. If Q3 2026 or Q4 2026 prints from the public marketplaces show take-rate-per-converted-policy compressing materially relative to revenue growth – even as carrier-spend remains strong – the carrier-direct bid floor is operating as the structural compression mechanism. Watch the take-rate commentary in earnings transcripts.
- A Berkshire Hathaway aggressive ramp at GEICO. If GEICO transitions from disciplined throttle to aggressive ramp – measured through quarterly marketing-spend disclosure and policy-count growth re-acceleration – the auction pressure on aggregators intensifies further. Greg Abel’s Q1 2026 “unprecedented shopping activity” framing suggests the disciplined posture continues for now, but the posture is reviewable on a quarterly cadence.
If two or more of those signals appear by the end of Q4 2026, operators should reweigh the structural read. The base case is that none of them does.
Key Takeaways
The S&P Global Market Intelligence note dated May 18, 2026 confirmed that Progressive’s trailing-12-month U.S. private auto direct premiums written through March 31, 2026 reached approximately $70.2 billion, against State Farm’s $68.7 billion, ending an 84-year State Farm leadership streak that began in 1942. The overtake is the first leadership change in U.S. personal auto since World War II.
The Q1 2026 single-quarter print – Progressive at approximately $18.1 billion versus State Farm at $17.1 billion – was the first time Progressive exceeded State Farm in a single quarter. Trailing-12-month leadership followed mechanically from multi-quarter compounding of similar gaps. Progressive grew 11.6 percent over the trailing twelve months; State Farm declined 0.1 percent.
The structural read for the lead-generation industry is that the dominant distribution model has shifted from captive-agent-led (State Farm) to direct-and-independent-agent-led-plus-segmentation (Progressive). The carrier that sets the paid-media auction floor, the carrier that anchors aggregator panel pricing power, and the carrier with the largest renewal-premium pool funding incremental acquisition are now the same carrier – Progressive – for the first time in modern industry history.
State Farm’s captive-agent cost burden (industry-estimated approximately 15 percent of premium across 19,000 captive agents) is the structural constraint that produced the divergence. The company is restructuring captive-agent compensation through 2028 in response, but the realistic posture is to defend the renewal book through 2026-2027 while building direct-channel capacity that begins contributing by 2028.
Progressive’s distribution model – approximately $3.5 billion in 2024 advertising spend (up 187 percent from 2023), approximately 38,000 independent agents (twice State Farm’s captive count), and segmentation infrastructure integrated with paid-media bid logic – produces a per-policy cost-to-acquire structurally lower than the captive channel and a renewal-premium pool that compounds the advantage over time.
GEICO’s Q1 2026 underwriting profit declined approximately 35 percent to $1.42 billion as Berkshire Hathaway maintained disciplined direct-channel ramp; the moderation partially offsets Progressive’s acceleration in shared paid-media auctions. Allstate’s direct-channel rebalance adds incremental pressure rather than offsetting it.
MediaAlpha’s Q1 2026 revenue of approximately $310 million and EverQuote’s Q1 2026 revenue of $190.9 million reflect strong demand-side carrier spend in Q1, but operators should watch back-half-2026 take-rate-per-converted-policy commentary for the early signal of structural marketplace compression rather than the Q1 demand strength.
Three operational implications are immediate: map current panel composition by carrier-channel exposure (not just by carrier name); renegotiate buyer contracts to carrier-bid-indexed pricing on a 60-to-180-day cadence; shift inventory mix toward conversion-quality dimensions Progressive’s segmentation undervalues. Operators completing the moves before Q4 2026 enter 2027 with structural margin protection; operators who do not will absorb back-half compression at unchanged contractual prices.
The broader industry signal is that direct-acquisition-and-segmentation-led carriers are displacing captive-agent-led carriers as price-setters across every personal-lines vertical with parallel distribution structures. Medicare, home insurance, and life insurance will see versions of the same structural transition over the next 12 to 60 months. The State Farm overtake is the canonical case study for the transition pattern.
For auto-insurance lead operators specifically, the planning window is 60 days. The build window is 180 days. The structural trajectory will not wait for slower operators to catch up, and the carrier-direct floor confirmed by the S&P overtake is now a permanent feature of the auction landscape rather than a cyclical pressure that reverses with the next loss-cost cycle.
Sources
Tier 1: Primary Research and Regulatory Disclosures
-
S&P Global Market Intelligence, “Progressive now No. 1 US private auto insurer for full 12 months, estimates show,” May 18, 2026 – https://www.spglobal.com/market-intelligence/en/news-insights/research/2026/05/progressive-now-no-1-us-private-auto-insurer-for-full-12-months-estimates-show
-
AM Best Rankings, “Progressive Edges Out State Farm to Claim Lead in US Total Auto DPW” – https://news.ambest.com/newscontent.aspx?refnum=266819&altsrc=177
-
National Association of Insurance Commissioners, Quarterly Market Share Reports, Personal Auto Line – https://content.naic.org/
-
S&P Global Market Intelligence, “Progressive’s advertising expenditure hits record high in 2024,” March 2025 – https://www.spglobal.com/market-intelligence/en/news-insights/articles/2025/3/progressives-advertising-expenditure-hits-record-high-in-2024-88020488
-
EverQuote, Inc., “EverQuote Announces First Quarter 2026 Financial Results,” Investor Relations – https://investors.everquote.com/press-releases/press-release-details/2026/EverQuote-Announces-First-Quarter-2026-Financial-Results/default.aspx
Tier 2: Established Industry Trade Press
-
Carrier Management, “Progressive Is Biggest Auto Insurer, Surpassing State Farm: S&P GMI,” May 18, 2026 – https://www.carriermanagement.com/news/2026/05/18/288098.htm
-
Insurance Journal, “Progressive Is Biggest Auto Insurer, Surpassing State Farm, Says S&P GMI,” May 19, 2026 – https://www.insurancejournal.com/news/national/2026/05/19/870454.htm
-
Claims Journal, “Progressive Is Biggest Auto Insurer, Surpassing State Farm, S&P Says,” May 20, 2026 – https://www.claimsjournal.com/news/national/2026/05/20/337692.htm
-
Repairer Driven News, “S&P: Progressive passes State Farm in annual market share,” May 28, 2026 – https://www.repairerdrivennews.com/2026/05/28/sp-progressive-passes-state-farm-in-annual-market-share/
-
Carrier Management, “Growth Going to be Hard: Abel Talks GEICO, Berkshire Tech Transformation,” May 4, 2026 – https://www.carriermanagement.com/news/2026/05/04/287521.htm
-
Insurance Journal, “Berkshire CEO Abel Says Insurance Becoming Increasingly Competitive,” May 4, 2026 – https://www.insurancejournal.com/news/national/2026/05/04/868202.htm
-
Insurance Business, “State Farm blinked. That doesn’t mean their agents won” – https://www.insurancebusinessmag.com/us/news/breaking-news/state-farm-blinked—that-doesnt-mean-their-agents-won-579449.aspx
Tier 3: Earnings Transcripts and Marketplace Disclosures
-
MediaAlpha (MAX) Q1 2026 Earnings Transcript, Motley Fool, April 29, 2026 – https://www.fool.com/earnings/call-transcripts/2026/04/29/mediaalpha-max-q1-2026-earnings-transcript/
-
Investing.com, “Earnings call transcript: MediaAlpha Q1 2026 beats revenue forecast” – https://www.investing.com/news/transcripts/earnings-call-transcript-mediaalpha-q1-2026-beats-revenue-forecast-stock-dips-93CH-4647306
-
Investing.com, “EverQuote Q1 2026 slides: 30% EBITDA growth, AI drives expansion” – https://www.investing.com/news/company-news/everquote-q1-2026-slides-30-ebitda-growth-ai-drives-expansion-93CH-4674791
-
Coverager, “An 84-year reign came to an end, and more” – https://coverager.com/an-84-year-reign-came-to-an-end-and-more/
Tier 4: Supporting Industry Context
-
ValuePenguin, “10 Largest Auto Insurance Companies (June 2026)” – https://www.valuepenguin.com/largest-auto-insurance-companies
-
Agency Checklists, “NAIC 2025 Market Share | Top 25 Private Passenger Auto Insurers” – https://agencychecklists.com/2025/03/17/naic-2025-market-share-top-25-private-passenger-auto-insurers-74894/
-
The Insurer, “Progressive overtakes State Farm in US auto insurance: S&P Global Market Intelligence” – https://www.theinsurer.com/ti/news/progressive-overtakes-state-farm-in-us-auto-insurance-sp-global-market-2026-05-20/
-
Insurance Intel Substack, “Progressive ends State Farm’s 84-year auto reign” – https://insuranceintel.substack.com/p/progressive-ends-state-farms-84-year
Closing
The S&P Global Market Intelligence note that confirmed the overtake will be remembered for the historical anchor – 84 years of State Farm leadership ending in a single quarterly print. The structural anchor matters more. The carrier that now sets the floor in the largest paid-media auctions in personal-lines insurance also now anchors the largest renewal-premium base in the segment, and the two reinforcing positions compound through every retention cycle. Aggregator panels priced around the captive-channel era of State Farm leadership require repricing around the direct-and-segmentation era of Progressive leadership. The repricing is not an event; it is a multi-quarter sequence with a planning window of 60 days and a build window of 180 days. The operators who treat the S&P note as breaking news will spend 2026 absorbing margin compression at unchanged contractual prices. The operators who treat it as the formal start of a structural repricing will run the next nine to twelve months on contract repricing, inventory-mix shift, and panel-composition rebalancing that repositions the business for the post-overtake auction landscape. The carrier-direct floor confirmed by the overtake is now a permanent feature of the auction, and the decision about which group to be in is being made now.
Market-share data, premium figures, and competitive dynamics reflect publicly reported conditions through June 25, 2026. Carrier strategy, paid-media auction dynamics, and aggregator buyer-side pricing change continuously; verify current terms through primary issuer filings, S&P Global Market Intelligence quarterly notes, and direct buyer relationships before making operational decisions. This article provides general industry analysis and does not constitute legal, financial, investment, or compliance advice. Consult qualified counsel for specific questions related to contract repricing, panel composition, and consent frameworks.