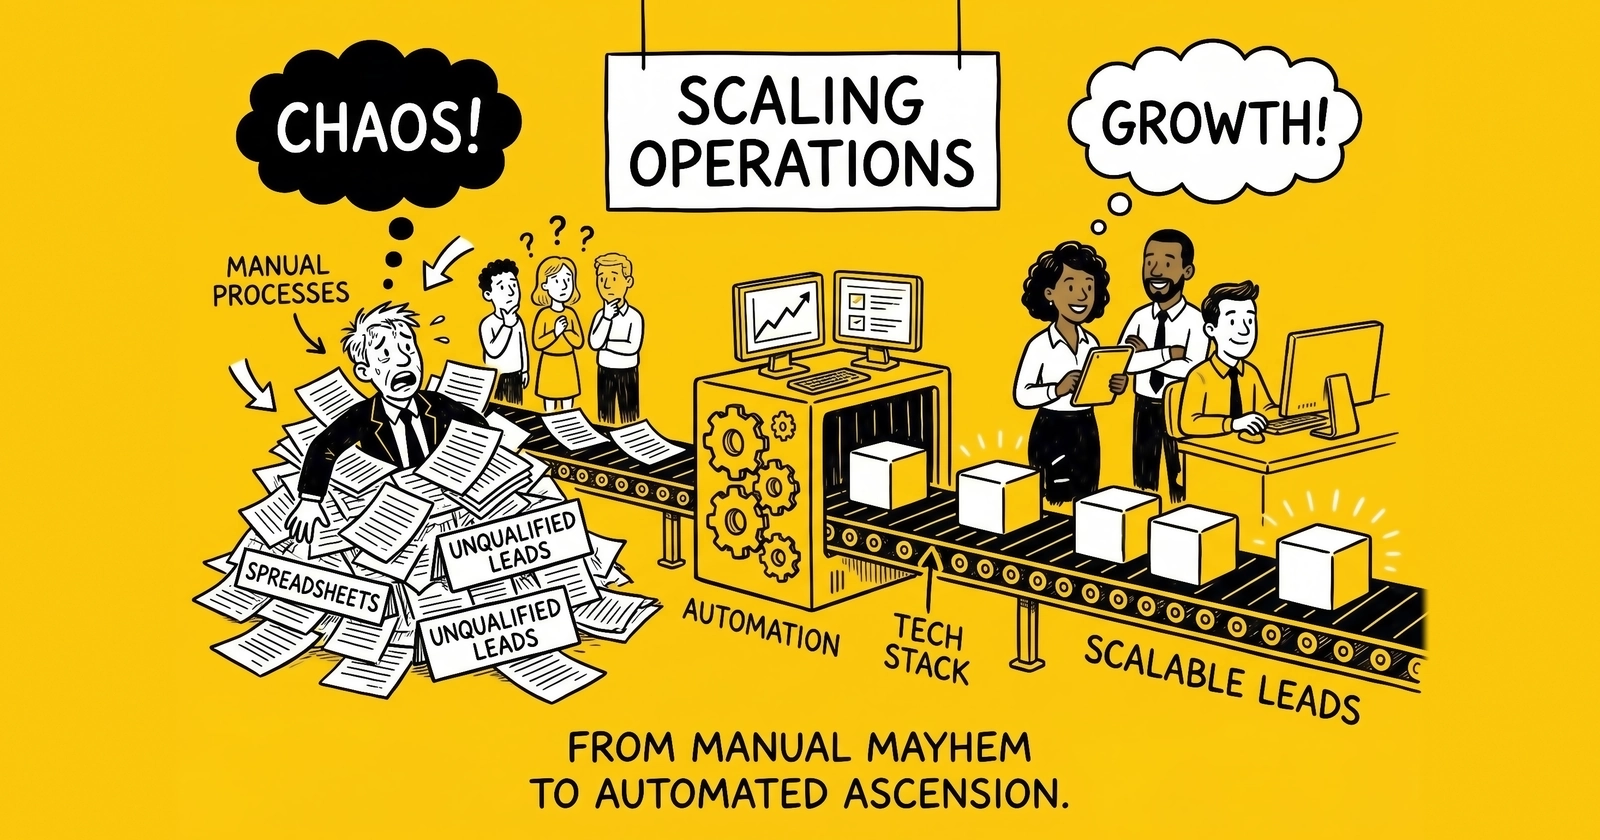
Scaling a lead generation business is a sequence problem, not an ambition problem.
The gap between lead generation businesses that plateau at $2 million annually and those that reach $20 million or $100 million rarely traces to market opportunity or strategic vision. The divergence shows up in operational sequence: when the operator hires the first head of compliance, when the ping-post stack migrates from a hosted vendor to custom code, when buyer concentration drops below the threshold where a single account pause can collapse a quarter, and when working-capital infrastructure can absorb a bad month without forcing distress sales. Most lead generation operations hit revenue ceilings not because demand is exhausted but because operational sequence drifts out of alignment with revenue, and the resulting failure modes (return-rate spirals, buyer concentration crashes, traffic-policy reversals) compound differently above $10 million than they do below.
This analysis covers the operational thresholds, hiring sequence, vendor stack milestones, working-capital math, and named failure modes that determine whether a lead generation operator compounds growth from $1 million through $100 million or reverses inside 18 months.
What scaling actually means in lead generation
Three structural features make lead-gen scaling different from generic services scaling.
First, the cost-revenue lag is built into the model. Traffic spend on Google, Meta, or programmatic platforms is due within 7 to 14 days. Buyer payments under net-30 or net-60 terms arrive 30 to 60 days later. Every additional dollar of monthly revenue increases the working-capital gap proportionally, which means revenue growth without parallel credit access produces cash-flow tightening rather than cash accumulation. The site’s 60-day float rule analysis covers this dynamic in depth; this guide treats it as a given and focuses on the operational decisions that follow from it.
Second, the buyer side concentrates faster than founders expect. A new lead-gen business signs three to five buyers in its first year and assumes diversification will follow naturally. In practice the largest buyer typically grows fastest because integration depth, performance trust, and capacity all reinforce themselves. By $5 million in revenue, the top three buyers commonly represent 60 to 75 percent of monthly purchases. That concentration becomes existential by $10 million, where a single buyer pause (compliance review, internal capacity cut, vertical-economics shift) can wipe out a quarter of revenue inside 30 days.
Third, regulatory exposure scales nonlinearly. The Federal Communications Commission collected over $200 million in TCPA-related forfeiture orders during 2023 and 2024, and individual plaintiff-firm settlements regularly exceed $5 million per matter. Plaintiff firms target larger operators because the recoverable damages justify the work. A $500,000 operation with a per-state PEWC gap might never face a class action. A $20 million operation with the same gap is on the litigation map. Compliance underinvestment is the single most common reason scaling lead generators reverse, and the dollar-amount investment that prevents the failure is usually less than 1 percent of annual revenue.
These three features (cost-revenue lag, buyer concentration gravity, regulatory exposure curve) interact. A return-rate spike pushes the operator to expand traffic into lower-intent sources, which pushes return rates higher, which causes the largest buyer to pull caps, which collapses the cash flow that was already tight from working-capital lag, which forces compliance underinvestment to defer the next litigation-prep spend. The pattern is recognizable enough that ActiveProspect and LeadsCouncil have both published operator surveys describing it.
Revenue stage thresholds: $1M, $10M, $100M
The conventional four-stage model (foundation, validation, scaling, enterprise) maps poorly onto lead generation because the actual inflection points are tied to specific operational triggers, not revenue bands. Three thresholds matter most.
Crossing $1 million: from operator to operation
At $1 million in annual revenue, the founder is still doing every job that defines the business. Traffic buying, buyer relationships, compliance review, finance, and quality assurance all live in one or two heads. The transition that has to happen between $1 million and $3 million is the externalization of the founder’s tacit knowledge into systems that can be operated by others. This is the documentation phase covered in the site’s guide on SOPs and operational playbooks for lead generation.
Concrete operational milestones at this stage include selecting a primary distribution platform (boberdoo, Phonexa, LeadsPedia, or LeadsBridge for entry-level operations), implementing TrustedForm or Jornaya consent capture on every form, signing fractional compliance counsel, and establishing a real bookkeeper relationship that can produce monthly close inside 10 days. The first dedicated hire is typically a media buyer who can run paid search at scale, freeing the founder to handle buyer relationships and operations.
Crossing $10 million: the infrastructure rebuild year
The $5 million to $15 million band is where most operations either build the infrastructure that supports the next decade or accumulate debt that forces a contraction. The hiring sequence at this stage is the most consequential single decision the founder makes during the entire scaling arc, and most operators get it wrong by hiring revenue-side talent (more media buyers, more buyer-account managers) before the bottleneck functions (compliance, data engineering, finance).
A defensible hiring sequence in the $5 million to $15 million band looks like this: dedicated compliance manager (not just retained counsel), data engineer who owns the warehouse and reporting layer, head of buyer accounts who relieves the founder of day-to-day buyer management, fractional or full CFO depending on growth rate, and a second-channel media buyer to begin diversifying traffic away from a single platform. Operators that hire two more media buyers before the compliance manager typically discover the cost of the wrong sequence during a regulatory inquiry or buyer-side audit.
This is also the band where the technology-stack rebuild happens. The hosted ping-post platform that worked at $2 million begins to produce friction at $10 million as buyer integrations get more bespoke, custom routing logic accumulates, and reporting requirements outgrow the vendor’s UI. The build-versus-buy decision is covered in detail in the site’s analysis of build versus buy for lead management software; for this guide the practical answer is that operators below $15 million should stay on a vendor and operators above $25 million should evaluate custom infrastructure based on margin opportunity and integration depth.
Crossing $100 million: organizational design as the binding constraint
Above $20 million, technology and capital stop being the binding constraints and organizational design becomes everything. Operators at this scale are running multi-vertical, multi-channel businesses where the head of operations cannot personally know every buyer, every traffic source, or every compliance state. The organizational structures that support this scale (vertical leads with P&L responsibility, dedicated heads of compliance and finance, separate engineering teams for distribution and data) require deliberate design rather than organic growth.
The few operators that reach $100 million in pure lead-generation revenue (rather than rolling lead-gen into broader marketing services or contact-center revenue) typically built one of three structures: a vertical-holding model where each vertical is run as a near-autonomous unit, a platform model where the operator licenses or co-builds technology that other operators use, or an integration model where lead generation feeds an owned conversion step (contact center, agency, marketplace). Each structure carries different organizational design implications and different failure modes.
Hiring sequence by revenue stage
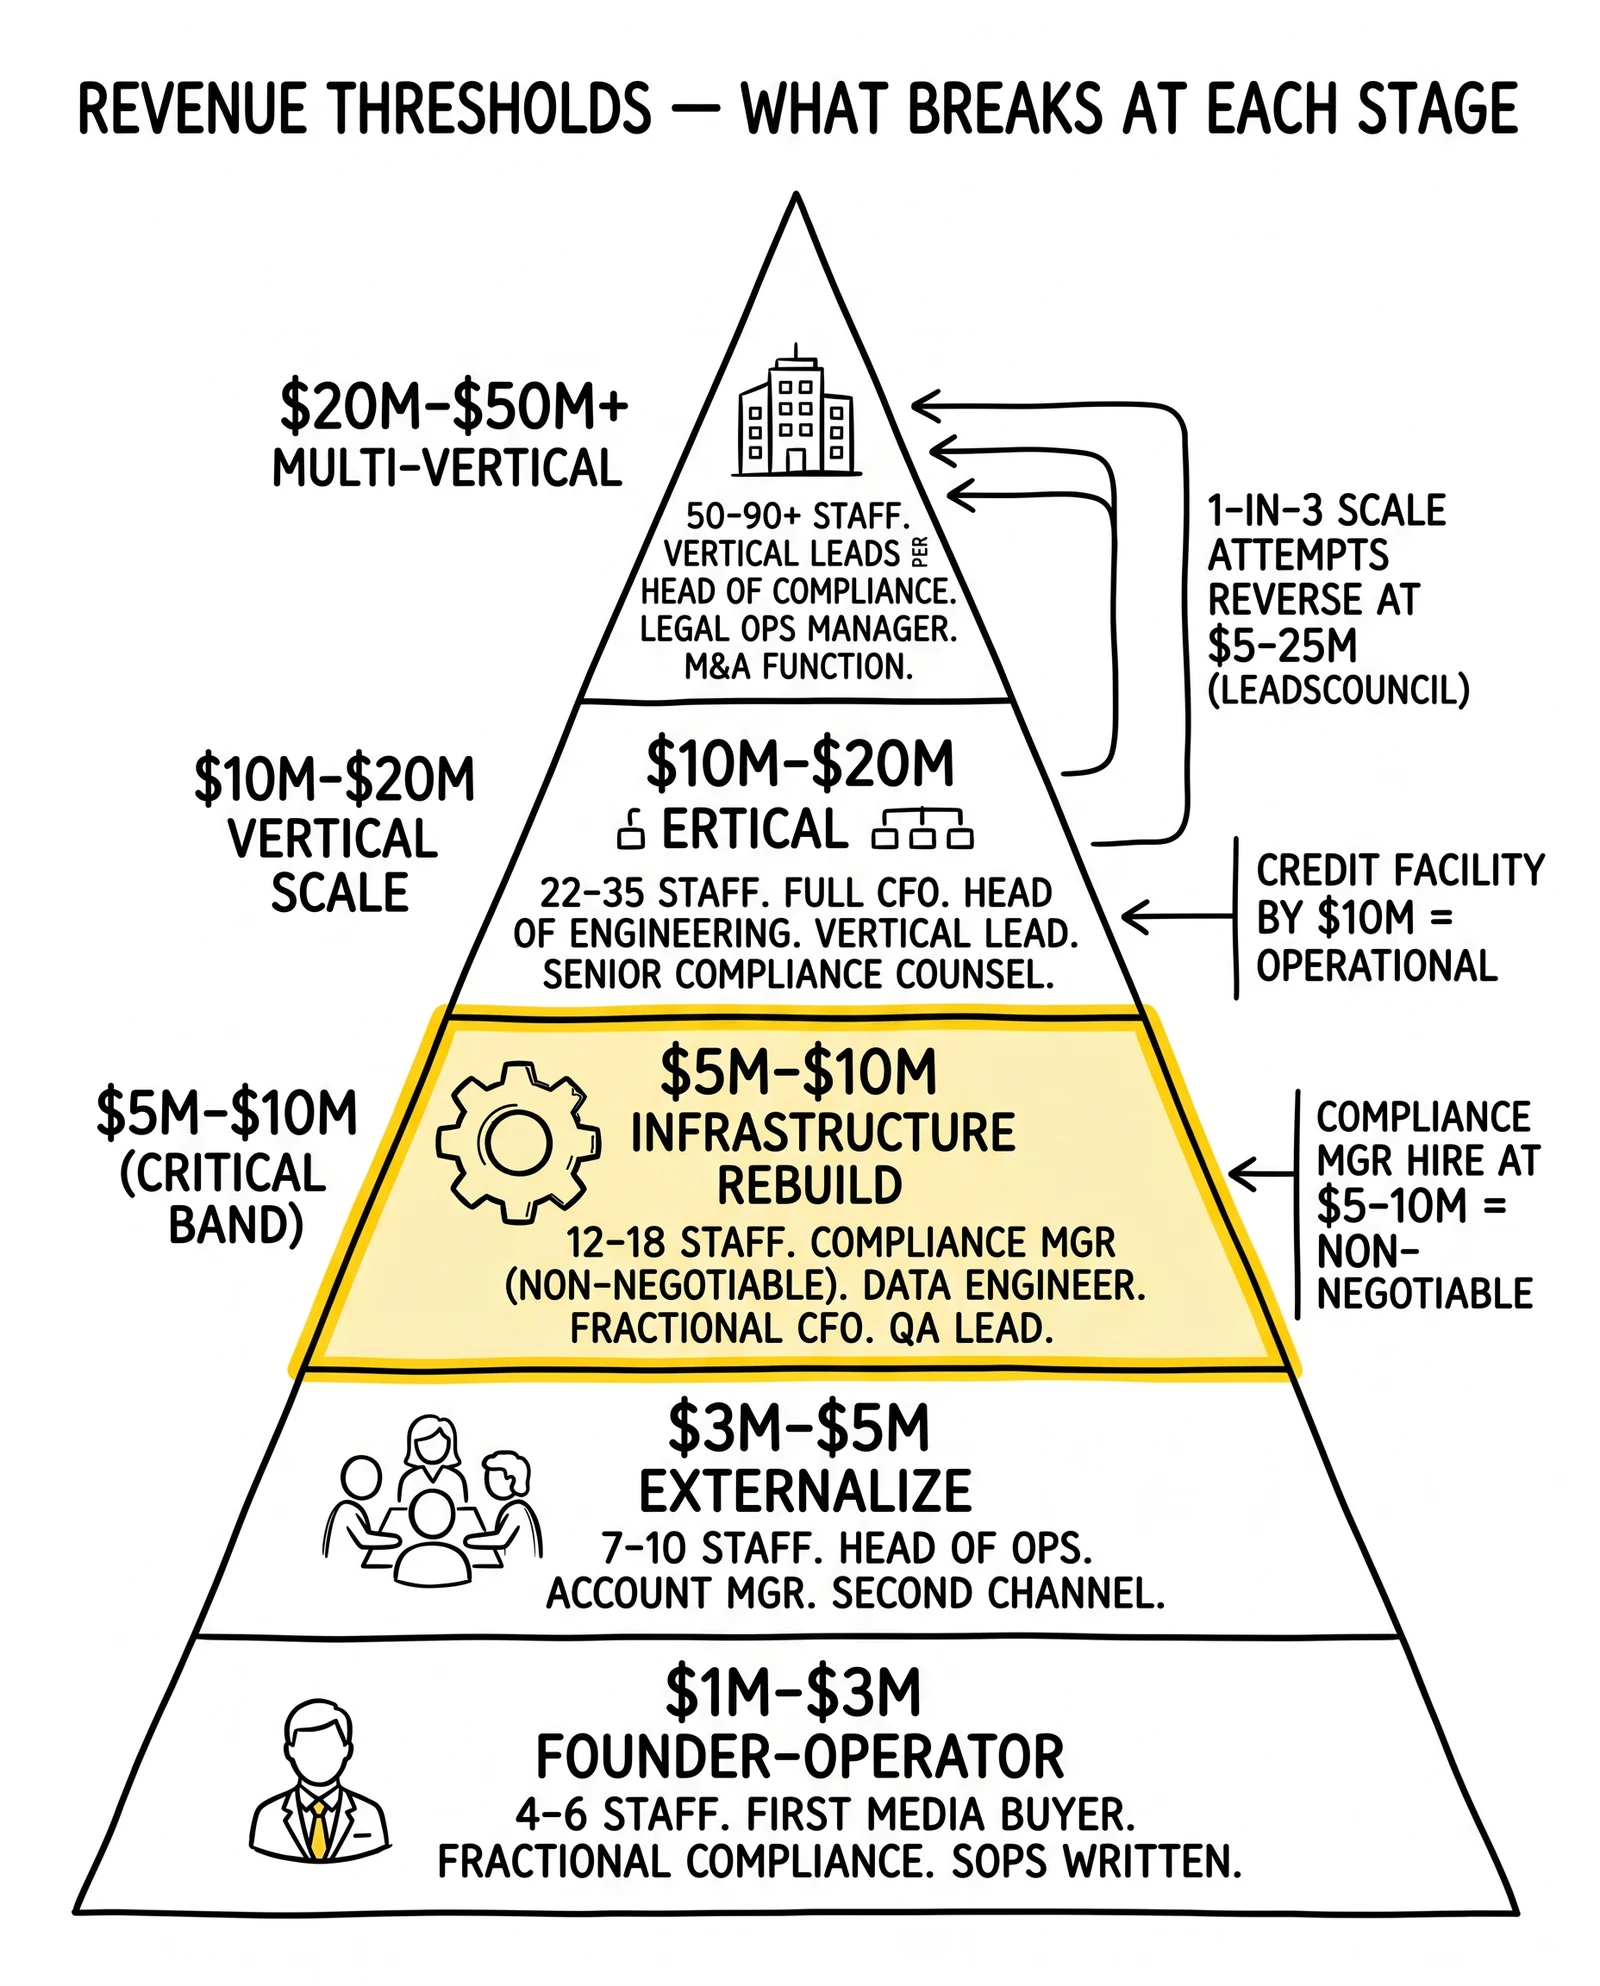
The single most common scaling mistake is hiring out of sequence. Operators staff revenue-side functions before bottleneck functions because revenue-side hires are easier to justify with current-month math and bottleneck hires only produce returns months later. The table below presents the defensible sequence based on operator-survey data and the named failure modes that follow from skipping a step.
| Revenue Band | Hires Added in This Band | Total Approximate Headcount | Common Wrong-Order Failure |
|---|---|---|---|
| $1M to $3M | Senior media buyer; bookkeeper; fractional compliance counsel | 4 to 6 | Founder remains bottleneck on buyer relationships |
| $3M to $5M | Head of operations; account manager for buyers; junior media buyer (second channel) | 7 to 10 | Buyer concentration above 40 percent goes unmanaged |
| $5M to $10M | Compliance manager; data engineer; fractional CFO; QA lead | 12 to 18 | Compliance gap surfaces during a buyer audit, triggering pause |
| $10M to $20M | CFO; head of buyer accounts; head of engineering; vertical lead (first); senior compliance counsel on retainer | 22 to 35 | Tech-stack debt forces a stop-the-world migration |
| $20M to $50M | Vertical leads per major vertical; head of compliance; head of marketing analytics; legal operations manager | 50 to 90 | Founder cannot personally maintain top-buyer relationships, churn spikes |
| $50M+ | C-suite buildout; M&A function; corporate development; multi-region or multi-vertical org structure | 120+ | Bureaucracy displaces founder pattern recognition; scaling stalls |
Several details deserve emphasis. The compliance manager hire belongs in the $5 million to $10 million band, not later. Operators that defer this hire until $15 million or $20 million typically pay for the deferral through a litigation event or a buyer-side audit that pauses 20 to 40 percent of revenue for 60 to 120 days. The data engineer is similarly load-bearing because the analytics and finance functions cannot operate without clean data infrastructure, and consultants cannot substitute for an in-house engineer who owns the warehouse.
The vertical-lead hire in the $10 million to $20 million band is the inflection point that determines whether the operator can run more than two verticals. Vertical leads need operator backgrounds in their specific vertical (auto insurance, Medicare, mortgage, solar) because the sourcing, compliance, and buyer dynamics differ enough that cross-pollination produces mediocre results. The Bureau of Labor Statistics reported median wages of $19.74 per hour for customer service representatives in May 2024, a benchmark that matters because vertical leads in call-driven verticals manage organizations where this is the largest single line item.
Vendor stack thresholds
The lead-generation vendor ecosystem has a small number of dominant operators that handle most of the operational work for businesses below $25 million in annual revenue. The decision points around when to add, replace, or build past these vendors are predictable enough that they can be specified by revenue band and use case.
Distribution and ping-post infrastructure
Four vendors handle most of the mid-market distribution workload. boberdoo is the longest-running and most flexible at the configuration level, particularly for ping-tree depth. Phonexa bundles distribution with dialer and call-tracking modules, which is valuable for operations that mix lead and call delivery. LeadsPedia leans toward affiliate-heavy and call-heavy operators with strong reporting at the affiliate-payout layer. LeadExec, owned by ClickPoint Software, ships a pre-integrated quality stack (TrustedForm, IPQS, Trestle, BriteVerify) and remains accessible at the entry tier through a free Starter plan. Pricing for the paid plans of all four vendors runs from the low four figures monthly at entry to $20,000 or more monthly for high-volume custom deployments, with implementation fees layered on top.
| Vendor or Capability | Best Fit Use Case | Typical Monthly Cost | Revenue Band Where It Becomes Limiting |
|---|---|---|---|
| boberdoo | Multi-source ping-post with deep routing rules | $1,500 to $12,000 | $20M to $30M; routing depth ceiling reached |
| Phonexa | Mixed lead and call distribution; integrated dialer | $2,500 to $20,000 | $25M-plus for call-heavy operators |
| LeadsPedia | Affiliate-heavy and call-tracking workflows | $2,000 to $15,000 | $20M; affiliate-payout reporting depth |
| LeadExec (ClickPoint Software) | Distribution + routing with pre-integrated quality stack; free Starter tier | $0 (Starter) to $15,000 | $25M-plus when integration depth becomes binding |
| TrustedForm (ActiveProspect) | TCPA consent certificates on every lead | $0.05 to $0.15 per certificate | Required infrastructure at every stage |
| Jornaya LeadiD (Verisk) | TCPA consent certificates; alternative to TrustedForm | $0.04 to $0.12 per certificate | Required infrastructure at every stage |
| Snowflake or BigQuery | Cross-source analytics warehouse | $4,000 to $25,000 | Becomes load-bearing above $5M revenue |
Source: vendor public pricing pages and operator reports compiled through 2026.
The threshold at which a hosted vendor stops being the right answer is typically $20 million to $25 million in revenue, and only when the operator has identified a specific routing or integration capability that produces margin advantage the vendor cannot replicate. Below $25 million, the engineering cost of replacing a vendor (typically a two-to-four-engineer team plus on-call infrastructure costs of roughly $600,000 to $1.4 million fully loaded annually) exceeds the licensing savings. Above $50 million the calculus inverts for operators that have specific differentiation reasons to own the routing layer.
Consent and compliance infrastructure
ActiveProspect’s TrustedForm and Verisk’s Jornaya LeadiD are the two dominant consent-certification services used as evidence in TCPA defense. Both produce timestamped certificates that document the consumer’s interaction with the lead form, which has been accepted in litigation as primary evidence of consent. Operators that scale past $5 million revenue without consent certificates on every lead are accumulating litigation exposure that materializes as soon as a plaintiff firm finds the operation.
Per-state PEWC (prior express written consent) capture became operationally required after the FCC’s 2023 ruling that closed the lead-generation TCPA loophole, and most multi-buyer operators rebuilt their consent flows during 2024. The site’s TCPA compliance guide for lead generators covers the specific consent-language requirements; for this guide the relevant scaling fact is that consent infrastructure becomes more expensive as buyer counts grow because every buyer needs to be enumerated in the consent disclosure.
Data warehouse and analytics
Operators below $5 million typically run on the analytics layer their distribution platform provides plus a Google Sheets or Looker Studio reporting overlay. Above $5 million the data volume and query complexity outgrow vendor analytics, and a dedicated warehouse becomes load-bearing. Snowflake and BigQuery are the two dominant choices; Snowflake’s pricing model bills compute and storage separately, with mid-market operators typically spending $4,000 to $25,000 monthly. Redshift remains common for operators already standardized on AWS.
The data engineer hire mentioned in the previous section is what makes this stack work. Operators that try to run a warehouse without a dedicated engineer either accumulate technical debt that forces a rebuild within 18 months or pay consultants three to five times the cost of the hire. The site’s tech-stack guide for lead generation startups covers the minimum-viable end of this stack; the scaling-stage build adds the warehouse, transformation layer (typically dbt), and observability tooling.
Working capital math at scale
The cash-flow inversion that defines lead generation produces working-capital requirements that grow proportionally with revenue but compound nonlinearly with growth rate. Treating this as a financing problem rather than an operational problem is what separates operators that scale from those that stall.
The mechanics are straightforward. Traffic platforms (Google, Meta, programmatic exchanges) charge weekly or every 14 days. Buyers pay net-30 to net-60 depending on the contract, with some larger buyers stretching to net-75 or net-90 in tighter macro environments. The gap between traffic outlay and buyer collection is the working-capital float. At $20 million in annual revenue with 50 percent of cost going to traffic and a 45-day average collection lag, the float is roughly $1.2 million tied up at any given moment. At a 60-day lag the float climbs above $1.6 million. The site’s cash-flow management guide walks through the calculation in detail; the relevant scaling-stage points are summarized below.
Three financing instruments solve this gap above $5 million revenue. Factoring against buyer receivables advances 80 to 90 percent of invoiced amounts within one to three days at fees of 1.5 to 3 percent per 30-day period. Revenue-based financing offered by lenders such as Capchase, Pipe (now wound down), Clearco, and several lead-gen-specific lenders provides 6-to-12-month advances against forward revenue at effective rates of 12 to 25 percent annualized. Asset-backed credit lines from regional banks or specialty lenders typically require $10 million-plus revenue and a clean compliance history but offer rates closer to prime plus 3 to 5 percent.
Operators that scale past $20 million without an institutional credit relationship typically end up bootstrapping growth from retained earnings, which caps growth at roughly 30 to 50 percent annually. Operators that build the credit relationship by $10 million can sustain 80 to 150 percent annual growth without distress, assuming margins remain healthy. The implication is that the right time to set up the credit facility is well before it is needed, because lenders require six to nine months of clean financials and underwriting that becomes harder to assemble during a crunch.
Buyer concentration as the dominant existential risk
Buyer concentration is the single most common cause of scaling reversal between $5 million and $20 million revenue. The mechanics are simple enough that the failure pattern is predictable, but operator behavior consistently underweights the risk because the dominant buyer is also the highest-margin, lowest-friction revenue source.
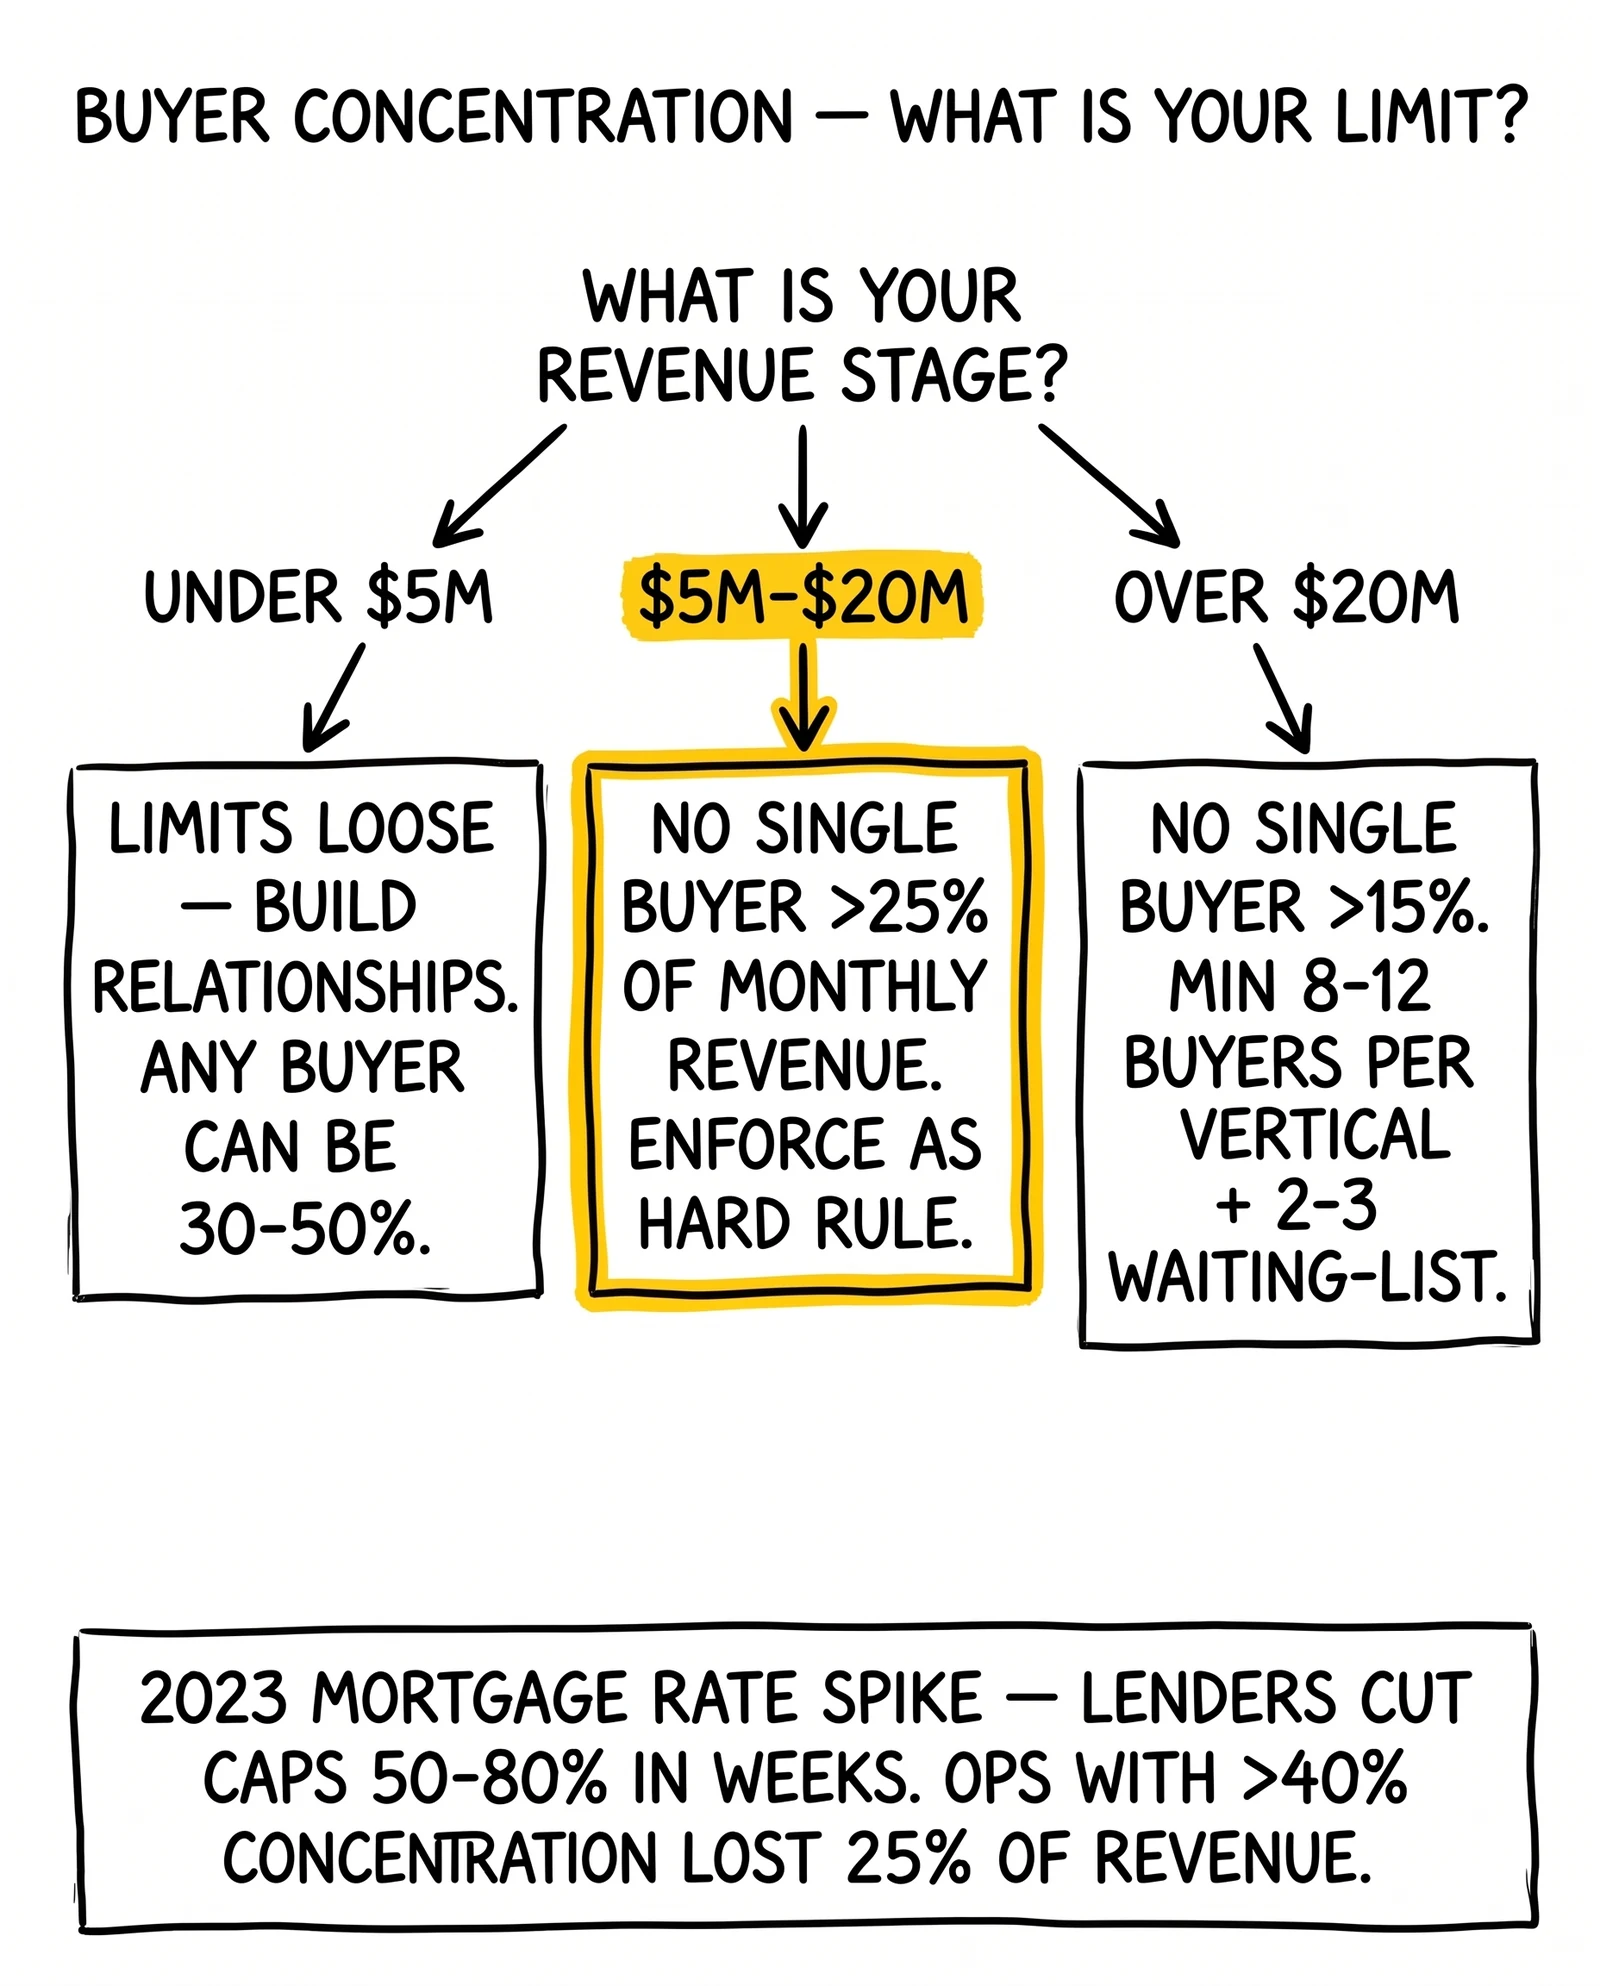
The general rule is that no single buyer should exceed 25 percent of monthly revenue once an operation passes $5 million annually, and no single buyer should exceed 15 percent above $20 million. The risk is not gradual: a buyer can pause within 24 hours over a compliance concern, an internal capacity change, a vertical-economics shift, or a corporate decision unrelated to the operator’s performance. When that buyer represented 35 to 50 percent of revenue, the cash-flow gap opens immediately and traffic spend has to be cut faster than other buyers can absorb redirected volume.
The pattern repeated across the 2023 mortgage rate spike, where major lenders cut buying caps 50 to 80 percent within weeks. Lead-gen operators with mortgage-vertical concentration above 40 percent of revenue lost a quarter of total revenue between February and May 2023. The same pattern showed up in Medicare during 2024 marketing-rule rewrites, in solar during the California NEM 3.0 transition, and in short-term consumer credit periodically when buyers tighten approval thresholds.
Defending against buyer concentration requires three behaviors. First, enforce concentration limits as a hard rule rather than a guideline; this means turning down volume from the top buyer once they exceed the cap, even when the marginal economics are attractive. Second, build integration depth with eight to twelve buyers per vertical so that volume can be redirected within 48 hours when a top buyer pauses. Third, maintain waiting-list relationships with two to three additional buyers who have completed integration testing and can absorb redirected volume on short notice. The site’s revenue-share versus fixed-price contract analysis covers the contract structures that make rapid redirection possible.
Quality drift during scaling
Quality drift is the operational corollary to buyer concentration and produces most of the failure cascades that show up in the $5 million to $20 million band. The underlying mechanic is that traffic-source dilution and operational-attention dilution interact: as the operator pushes volume into lower-intent traffic sources to feed scale targets, return rates rise; as headcount grows faster than process maturity, quality monitoring lags the actual quality drift. The combination produces a six-to-twelve-week window in which return rates climb without operator awareness, followed by a buyer-side response that collapses revenue.
The site’s dedicated guide on scaling lead volume without sacrificing quality covers the volume-quality trade-off curve and source-dilution dynamics in depth. For the scaling-stage operator the relevant decisions are structural: dedicated quality-assurance staffing by $5 million revenue, real-time return-rate dashboards by $10 million, and source-level kill switches that pause traffic automatically when return rates exceed defined thresholds. Operators that try to manage quality through periodic review meetings rather than real-time monitoring typically discover problems through buyer escalations rather than internal alerts.
Named failure modes operators actually encounter
Five failure modes account for most scaling reversals between $5 million and $25 million revenue. They are recognizable enough that naming them in advance is the single highest-return exercise an operator can run during stage planning.
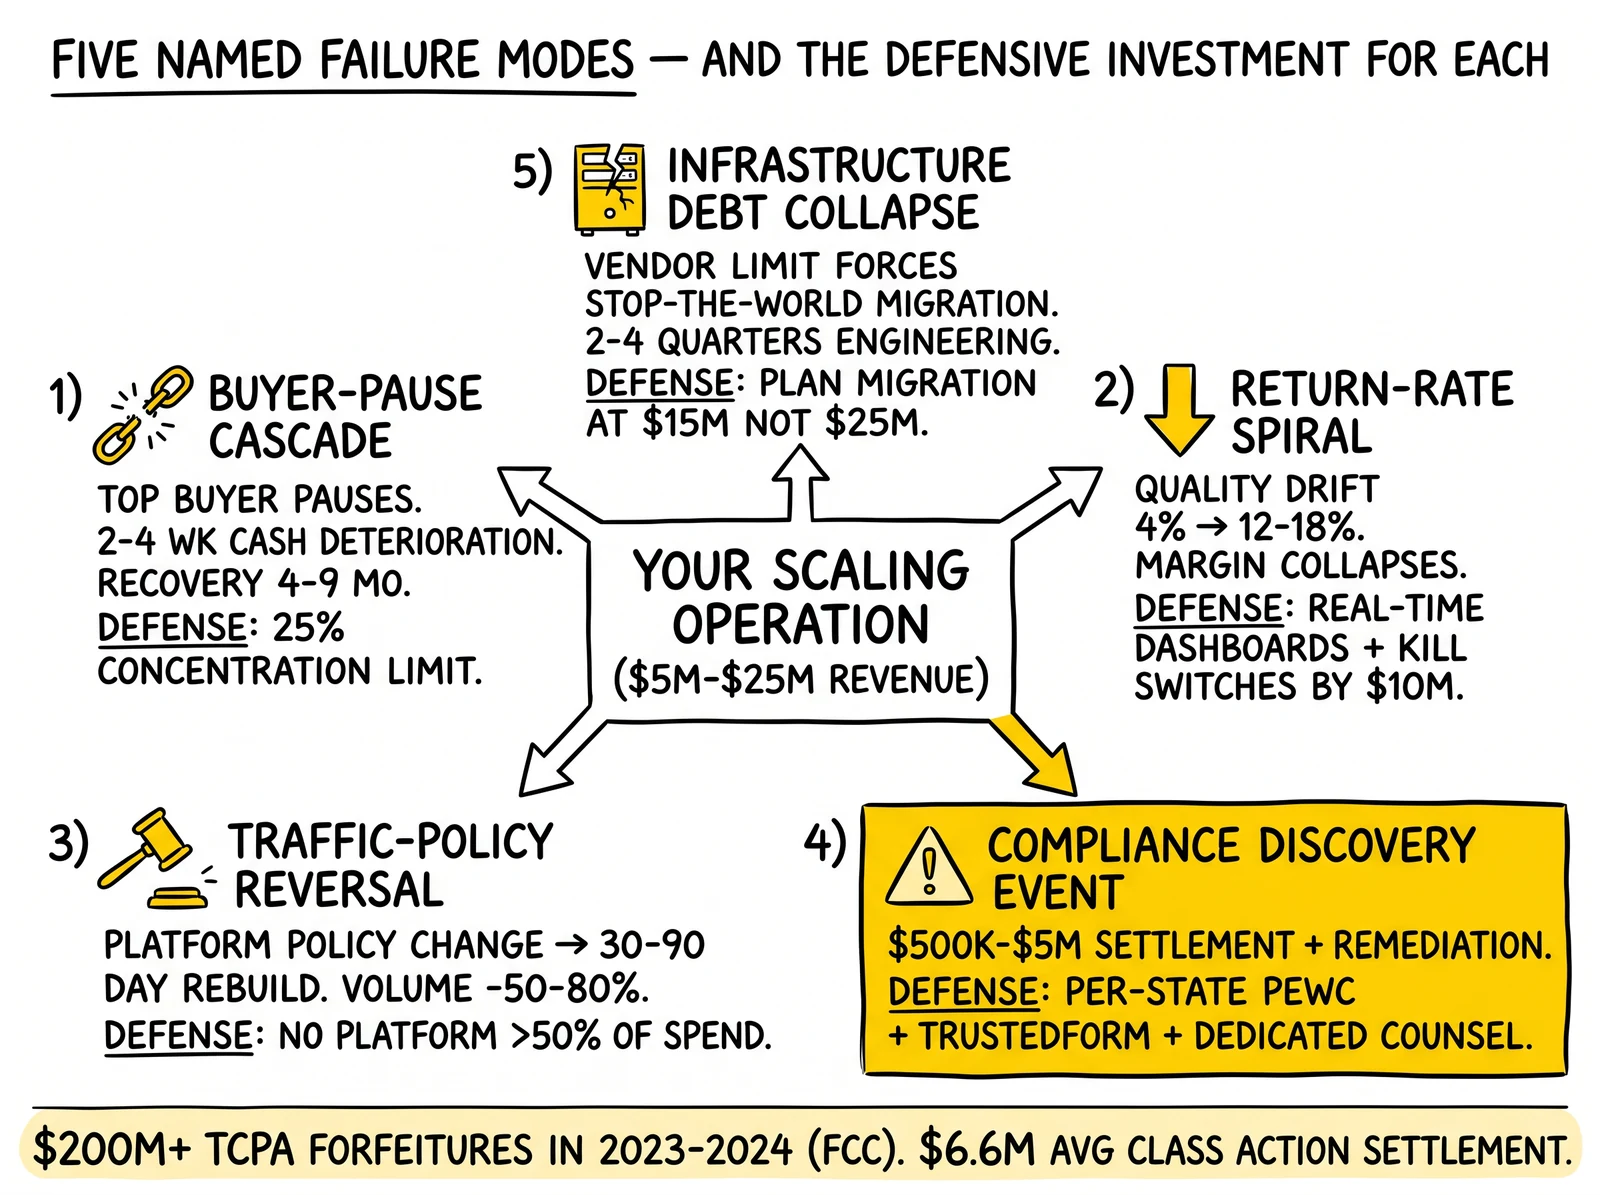
The buyer-pause cascade. Top buyer pauses purchasing over a compliance concern. Traffic spend continues at planned levels because contracts and platform commitments do not pause as quickly. Cash position deteriorates over two to four weeks. Operator cuts traffic, which reduces volume to the remaining buyers, which damages those relationships. Recovery typically takes four to nine months and often requires outside capital.
The return-rate spiral. Quality drift pushes return rates from 4 to 6 percent into the 12 to 18 percent range. Buyer-side acceptance drops faster than the operator can identify the problem source. Margin per delivered lead falls below traffic cost. Operator either absorbs losses while diagnosing or cuts traffic abruptly, both of which damage buyer relationships.
The traffic-policy reversal. A major traffic platform changes policy in a way that disqualifies the operator’s primary funnel. Recent examples include Google’s restricted-content policy changes affecting Medicare, debt settlement, and addiction treatment. The reversal produces a 30-to-90-day rebuilding cycle in which volume drops 50 to 80 percent and the operator has to rebuild compliant funnels.
The compliance discovery event. A plaintiff firm or regulatory inquiry discovers a per-state consent gap, a missing PEWC, an undisclosed buyer in the consent language, or a misrepresented offer. Settlement and remediation costs typically run $500,000 to $5 million for a mid-market operator. Insurance coverage for these events is partial at best.
The infrastructure debt collapse. The hosted vendor that worked at $5 million begins producing operational friction at $15 million. The operator defers migration during scaling because the project is large. Eventually a buyer integration request, a reporting requirement, or a routing-logic limitation forces a stop-the-world migration that consumes engineering capacity for two to four quarters.
Each failure mode has a specific defensive investment. Buyer-pause cascades are prevented by concentration limits. Return-rate spirals are prevented by real-time quality monitoring and source-level kill switches. Traffic-policy reversals are prevented by channel diversification with no single platform exceeding 50 percent of traffic spend. Compliance discovery events are prevented by per-state PEWC capture, consent-certificate infrastructure, and dedicated compliance counsel. Infrastructure debt collapse is prevented by treating the vendor migration or upgrade as a planned project at $15 million rather than a forced one at $25 million.
Multi-vertical versus single-vertical scaling paths
Operators reaching $20 million revenue typically face a structural choice: deepen the existing vertical (more buyers, more channels, more geographic reach within one industry) or add a second vertical. The decision is consequential because the operational structures, buyer relationships, and compliance investments do not transfer cleanly.
Single-vertical scaling produces deeper buyer relationships, more sophisticated traffic operations, and stronger compliance specialization within the chosen vertical. The ceiling is the size of the vertical’s lead-generation TAM and the operator’s market share within it. Auto insurance, Medicare, mortgage, and solar each support several $50-million-plus pure-play operators; smaller verticals (specific legal niches, regional home services) cap out earlier.
Multi-vertical scaling produces revenue diversification but requires duplicating most of the operational stack: separate buyer relationships, separate compliance infrastructure (often separate state licensing), separate traffic operations, and typically a vertical lead per major vertical. The hire cost alone runs $300,000 to $700,000 fully loaded per added vertical before any traffic or buyer-acquisition spend. Operators that try to add a vertical without dedicated leadership typically discover that the founder cannot personally cover both verticals at the depth required, and one vertical underperforms.
The site’s vertical specialization versus multi-vertical analysis covers the decision framework; for this guide the relevant scaling fact is that the multi-vertical decision is best made by $10 million revenue, before the operator has invested heavily in single-vertical operational depth that becomes a sunk cost.
What the case against scaling looks like
Not every lead generation operation should pursue $20 million or $100 million revenue. The case for staying smaller is real and underweighted in most strategic discussion.
A $3 million to $7 million single-vertical operator with three to five long-term buyer relationships, low compliance exposure, and a founder who personally manages most decisions can run 25 to 40 percent operating margins on relatively low complexity. Scaling past $10 million typically compresses margin to 12 to 22 percent because the additional headcount, infrastructure, and credit costs grow faster than gross profit during the build-out years. Scaling past $20 million means accepting the failure-mode catalog described above and the personal-time profile of a CEO rather than an operator.
LeadsCouncil and ActiveProspect operator surveys show that roughly one in three scaling attempts in the $5 million to $25 million band reverse within 18 months, and a meaningful fraction of those reversals end in distress sales rather than orderly shutdowns. The honest assessment for many operators is that staying at $5 million to $10 million produces better personal economics and lower stress than the $20-million-plus arc, particularly for founders who built the operation and prefer operating to managing.
Key Takeaways
-
Scaling lead generation is a sequence problem rather than a strategy problem; the hiring order between $5 million and $15 million revenue determines whether the operation reaches $20 million or reverses inside 18 months.
-
The compliance manager hire belongs in the $5 million to $10 million band, not later; deferring the hire until $15 million or $20 million typically results in a litigation or buyer-audit event that pauses 20 to 40 percent of revenue for 60 to 120 days.
-
Vendor stack migration from boberdoo, Phonexa, or LeadsPedia to custom infrastructure is rarely defensible below $25 million revenue and depends on identifying specific routing or integration capability that produces margin advantage the vendor cannot replicate.
-
Working-capital float scales linearly with revenue but credit access changes nonlinearly; the right time to set up the institutional credit facility is by $10 million revenue, well before it is operationally needed.
-
Buyer concentration is the dominant existential risk in the $5 million to $20 million band; the defensible cap is 25 percent of monthly revenue per buyer above $5 million and 15 percent above $20 million, enforced as a hard rule rather than a guideline.
-
Quality drift produces failure cascades at predictable revenue bands because traffic-source dilution and operational-attention dilution compound; defense requires real-time return-rate monitoring and source-level kill switches by $10 million revenue.
-
Five named failure modes (buyer-pause cascade, return-rate spiral, traffic-policy reversal, compliance discovery event, infrastructure debt collapse) account for most scaling reversals between $5 million and $25 million; each has a specific defensive investment.
-
The multi-vertical versus single-vertical decision is best made by $10 million revenue before single-vertical operational depth becomes a sunk cost; multi-vertical scaling requires duplicating most of the operational stack at $300,000 to $700,000 fully loaded per added vertical.
Sources
- U.S. Federal Communications Commission, Enforcement Bureau, “TCPA Forfeiture Orders 2023-2024,” fcc.gov/enforcement, retrieved 2026.
- U.S. Bureau of Labor Statistics, “Occupational Employment and Wages, Customer Service Representatives, May 2024,” bls.gov/oes/current/oes434051.htm, May 2024.
- ActiveProspect, “State of Lead Generation Report 2024,” activeprospect.com, 2024.
- LeadsCouncil, “2024 Industry Best Practices Survey,” leadscouncil.org, 2024.
- U.S. Federal Trade Commission, “Complying with the Telemarketing Sales Rule,” ftc.gov, 2024.
- Consumer Financial Protection Bureau, “Lead Generation in Consumer Finance Markets, Final Report,” consumerfinance.gov, 2024.
- U.S. Small Business Administration, “Working Capital Financing Guidance,” sba.gov/funding-programs/loans, 2024.
- Snowflake, “Data Cloud Pricing and Compute Benchmarks,” snowflake.com/pricing, 2024.
Conclusion
The operators that compound from $5 million through $50 million revenue look superficially similar in strategy and substantively different in sequence. They hire the compliance manager before the second media buyer. They set up the credit facility at $10 million rather than $20 million. They enforce buyer-concentration caps as a rule rather than a guideline. They treat vendor migrations as planned projects rather than forced ones. None of these decisions create competitive advantage in isolation; in combination they produce the operational durability that lets the business absorb the buyer pauses, traffic-policy reversals, and compliance events that all scaling lead generators eventually face. The honest framing is that the scaling arc rewards operational discipline more than strategic ambition, and the failure modes are predictable enough that naming them in advance is the highest-return planning exercise available.