The shrinking carrier panel – not the shrinking consumer demand – is the binding constraint on Florida and California home-insurance lead monetization in 2026.
The two-state non-renewal problem in one paragraph
Florida non-renewed 3.35% of homeowners policies in calendar year 2024 – the highest rate in the country and roughly 1.7 times the state’s 2018 rate of 1.96%. California non-renewed 3.18% – the second-highest rate nationally and roughly 3.9 times its own 2018 rate of 0.82%. Those numbers come from a Weiss Ratings analysis of National Association of Insurance Commissioners Market Conduct Annual Statement (MCAS) filings, which lag by roughly 12 months. The 2026 picture is partly improved in Florida thanks to legislative reform plus reinsurance softening, and partly worse in California because the January 7, 2025 SB 824 moratorium on non-renewals in the Palisades, Eaton, Hurst, Lidia, Sunset, and Woodley fire ZIPs expired on January 7, 2026 – meaning the official non-renewal counter only just restarted in the most exposed areas. Home-insurance lead aggregators reading the headlines focus on premiums and consumer impact. The under-discussed operator-side effect is panel-shrinkage: the count of carriers willing to bind a homeowners policy in a given ZIP has fallen, which compresses lead auction depth, raises rejection rates on shared inventory, and pushes some ZIPs into a near-monoline residual-market posture where the only buyer is Citizens (Florida) or the FAIR Plan (California). Panel availability is the binding constraint, and the operators who survive 2026 are the ones building their pricing models around “binding-eligible carriers per ZIP” rather than national panel count.
Florida: the non-renewal wave, the depopulation snap-back, and what aggregators see
Florida’s 3.35% non-renewal rate represents the third year of multi-percent-level non-renewal pressure after years of legal-system abuse, AOB litigation, and assignment-of-benefits fraud that pushed loss ratios to unsustainable levels. The 2022 to 2023 reform package – SB 2-A, SB 76, and related legislation – broke the litigation feedback loop. Florida accounted for more than 72% of the nation’s homeowners claim-related litigation in 2023 despite representing only 10% of national homeowners claims, according to data the Insurance Information Institute (Triple-I) has documented in its Florida market briefs.
Progressive’s 56,000-policy roof-age underwriting cut
Progressive announced in spring 2024 that it would not renew approximately 56,000 Florida homeowners policies – including 47,000 DP-3 (dwelling property, rental-focused) policies plus 53,000 high-risk property policies – citing underwriting guidelines that capped roof age at 15 years across all roof types (a tightening from the prior composition-shingle-only standard). Florida statute now constrains roof-age-only non-renewals if an authorized inspection shows at least five years of remaining useful life, but the underwriting signal Progressive sent in 2024 mattered for the lead-gen ecosystem: a Top-5 national P&C brand telegraphing that it would exit a chunk of Florida home is precisely the kind of move that thins aggregator panels.
Lead aggregators routing Florida home submissions in 2024 to 2025 saw the downstream effect: the per-impression match rate on submissions originating from Florida ZIPs with high-roof-age housing stock fell, even as consumer search intent stayed elevated. The mismatch – high search intent, low binding-eligible carrier count – is the operational definition of panel shrinkage.
Citizens’ depopulation reversal – and what it means for the panel
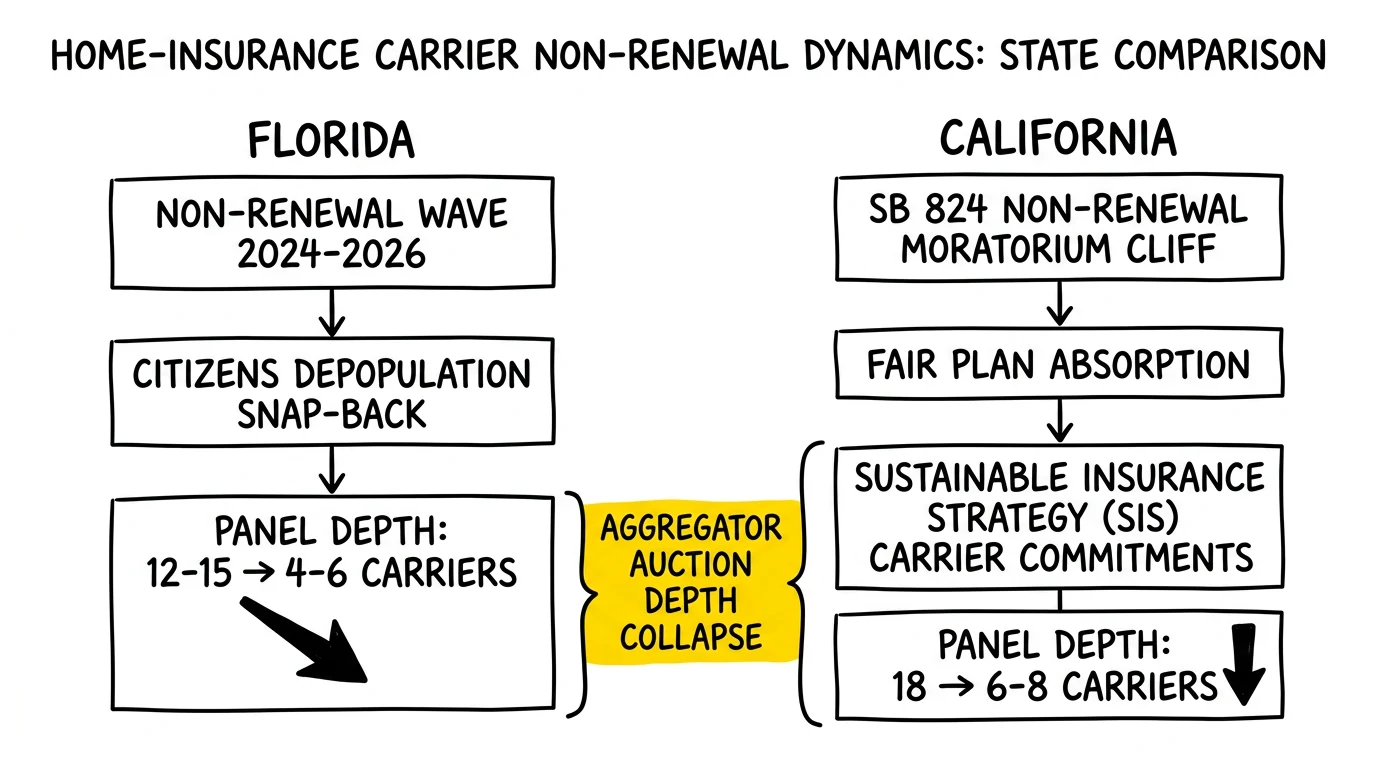
Citizens Property Insurance – Florida’s state-backed residual market – peaked at approximately 1.42 million policies in October 2023. By January 2026 the count had fallen to approximately 385,000 to 395,000 policies, the lowest level since 2012. The depopulation program – under which private carriers can request takeout of specific Citizens policies – transferred more than 546,000 policies to private carriers in 2025 alone.
That transfer is good news for aggregators on its face. More private-carrier policies in force should mean more binding-eligible buyers per ZIP. But the panel reality is more nuanced. The takeout carriers – Slide Insurance, Florida Peninsula, Frontline (which received a certificate of authority in April 2026 for a new reciprocal exchange company), Wingsail Insurance (a Spinnaker Insurance subsidiary authorized in February 2026 for homeowners multiperil), Builder Reciprocal Insurance Exchange (managed by Texas-based Millennial Specialty Insurance), and the broader set of approximately 20 new property insurers Florida has approved since the reforms – are smaller-scale operators with concentrated geographic appetite, not broad-spectrum national writers. An aggregator’s panel may technically have more “names” in Florida in 2026 than in 2023, but the carriers in those names are buying in narrower ZIP slices, with stricter wind-mitigation and roof-age criteria, at lower per-lead bid ceilings than the Top-15 nationals.
The 2026 Citizens rate cut signal
Citizens recommended an 8.7% statewide-average rate decrease for 2026 – the first meaningful Citizens personal-lines decrease since 2015 – with more than 150,000 policyholders receiving cuts of 10% or greater. The Office of Insurance Regulation approved the filing and rates took effect June 1, 2026. For dwelling HO-3/HW-2 policies, the actuarially sound average premium dropped from approximately $6,347 in 2024 to approximately $3,617 in 2026, a 43% reduction the rate filing attributed largely to SB 2-A.
The downstream lead-gen read: when residual-market rates fall sharply, shopping intent rises because Citizens-eligible homeowners – historically the largest segment of motivated shoppers – now have a cheaper baseline to evaluate against private-carrier quotes. Shopping intent translates into form fills, which translates into aggregator inventory. But unless the panel of private buyers has grown in those same ZIPs (and at the same rate), the inventory will price softer because too many leads will route to too few binding-eligible carriers. The 8.7% Citizens cut is a tailwind for top-of-funnel volume and a stress test for panel-depth assumptions.
Reinsurance softening as a leading indicator
Florida reinsurance rates fell 15% to 20% on a risk-adjusted basis at the June 1, 2026 renewals, per Guy Carpenter analysis published in late May and June 2026. Citizens specifically saw roughly 30% lower placement costs and a net rate-on-line of 8.46% versus 11.95% in 2025 – a 29.2% year-over-year reduction. More than $3.2 billion in new Florida-focused catastrophe bonds priced in 2026 from 12 sponsors, with alternative capital re-entering aggressively after the 2024 to 2025 hard market.
For aggregators, the reinsurance read-through is the key carrier-appetite leading indicator. Reinsurance is the largest variable cost on a Florida homeowners book; when it drops 30%, the carrier’s combined ratio mathematics improve, which expands the geographic appetite for new business. Aggregators should expect panel depth in Florida to expand modestly through Q3 and Q4 2026 as carriers refile and reopen ZIPs – but the expansion will concentrate in interior counties and lower-roof-age housing stock, not coastal storm corridors.
California: the SB 824 cliff, the FAIR Plan absorption, and Sustainable Insurance Strategy carrier commitments
California’s 3.18% non-renewal rate in 2024 was already at a multi-decade high. The January 7, 2025 Palisades and Eaton fires – which together drove approximately $30 billion in insured value losses, roughly 5,400 FAIR Plan claims, and approximately $3.5 billion in FAIR Plan claims paid – extended and complicated the picture. Governor Newsom’s January 7, 2025 emergency declaration triggered SB 824’s mandatory one-year non-renewal moratorium for ZIP codes within or adjoining the perimeters of the Palisades, Eaton, Hurst, Lidia, Sunset, and Woodley fires. Commissioner Lara’s Bulletin 2025-1 (amended January 17, 2025) identified the affected ZIPs: 90049, 90265, 90272, 90290, 90402, 91301, 91302, 91320, 91356, 91361, 91364, 91436 for Palisades; 91001, 91006, 91007, 91011, 91016, 91020, 91024, 91042, 91101, 91103, 91104, 91106, 91107, 91108, 91206, 91208, 91214, 91706, 91731, 91732, 91775, 91780, 93563 for Eaton.
The moratorium expired on January 7, 2026. Insurers may again issue non-renewals in those ZIPs subject to standard 75-day notice requirements. The early-2026 picture: the official non-renewal counter just restarted in the most fire-exposed Southern California ZIPs, which means the 2025 calendar-year MCAS data – to be reported by carriers in 2026 – will be artificially depressed, and the 2026 calendar-year data – reportable in 2027 – will likely show a sharp non-renewal acceleration in those ZIPs. The lead-gen operating implication: California panel-shrinkage in fire-exposed ZIPs is going to be a 2027 headline, not a 2026 one, but the carriers are pricing and underwriting for the 2027 expected reality today.
FAIR Plan’s record load
The California FAIR Plan grew from roughly 124,000 policies in 2019 to approximately 668,600 in late 2025 and 684,388 as of March 2026, representing about $750 billion in total exposure. The January 2025 fires forced a $1 billion personal-lines assessment on member insurers under Commissioner Lara’s Order 2025-1 – the first FAIR Plan assessment in more than 30 years (prior assessments date to the 1993 Altadena and Malibu fires). Roughly half of the assessment can be passed through to consumers as recoupment surcharges under Bulletin 2025-4.
The FAIR Plan added approximately 16,000 net residential policies in Q1 2026 – a noticeable slowdown from quarterly growth of 35,000 to 50,000 in 2023 and 2024. The slowdown partly reflects Sustainable Insurance Strategy carrier commitments to write in undermarketed ZIPs, but it also reflects the simple ceiling effect: the FAIR Plan reached the practical limits of its underwriting and claims-handling capacity. The Plan’s October 2025 filing for a 35.8% rate increase was approved at approximately 29% effective October 15, 2026.
For aggregators, FAIR Plan growth signals panel-shrinkage in the inverse: every policy that lands on the FAIR Plan is a policy that no admitted carrier wanted to bind, which by definition removes that ZIP from the binding-eligible carrier list of every aggregator’s panel. The Plan does not buy leads; it accepts applications from licensed brokers. So aggregator monetization on FAIR Plan-bound consumers is effectively zero – and the FAIR Plan now writes a meaningful share of policies in dozens of ZIPs that aggregators previously monetized at premium auction prices.
Sustainable Insurance Strategy: the carrier-commitment lever
Commissioner Ricardo Lara’s Sustainable Insurance Strategy – finalized in late 2024 and operative throughout 2025 and 2026 – permits insurers to use forward-looking catastrophe models (Verisk Wildfire Model, Moody’s RMS, KCC) and the net cost of reinsurance in California rate filings, provided they commit to writing at least 85% of their statewide market share in ZIPs the California Department of Insurance has identified as “undermarketed” and high-risk. The CDI defines undermarketed ZIPs as those where more than 15% of policies are on the FAIR Plan, plus low-income high-premium ZIPs where premiums exceed $4 per $1,000 of coverage.
SIS took full effect on January 1, 2025 – days before the Palisades fire ignited. The CDI began accepting rate applications using the Verisk Wildfire Model in 2025, with Moody’s RMS and KCC reviewed shortly thereafter. The most-extensive overhaul of California’s insurance regulation since Proposition 103 passed in 1988, SIS represents a binding commitment-for-pricing-flexibility trade: carriers get forward-looking models and reinsurance pass-through; California gets carrier-mandated writing in fire-exposed ZIPs.
For aggregators, the SIS read-through is the key California carrier-appetite leading indicator. Carriers participating in SIS – State Farm, Allstate, Farmers, USAA, and the long tail of admitted writers actively pricing in California – are contractually committed to writing 85% of their statewide share in undermarketed ZIPs. That means aggregator submissions originating from undermarketed ZIPs should see improving binding-eligible-carrier counts through 2026 and 2027 as SIS-participating carriers fulfill their 85% commitments – even as those same carriers continue to non-renew non-SIS-participating-customer policies in adjacent ZIPs.
The forward-looking-model permission also matters for pricing. Verisk and the cat-model triumvirate price for forward-looking expected loss (the AAL – average annual loss – and PML – probable maximum loss – frameworks), which means California carriers can finally write to a defensible loss-cost view rather than the historical-retrospective-only constraint that Proposition 103 long enforced. The downstream lead-gen effect is structurally bullish for aggregator panels in California – but the structural improvement is being absorbed against a worsening tail of climate-driven loss reality.
NAIC Climate Risk Disclosure: the upstream signal aggregators don’t track but should
The NAIC Climate Risk Disclosure Survey – based on the Task Force on Climate-related Financial Disclosures (TCFD) framework adopted by NAIC in April 2022 – requires insurer responses by August 31, 2026 for the 2025 reporting year. The survey covers carriers domiciled in 15 participating states that together represent approximately 80% of the US insurance market, including both Florida and California. The TCFD-aligned survey covers four pillars: governance, strategy, risk management, and metrics and targets – including, critically, climate scenario analysis across a three-year requirement (2024, 2025, and 2026 year-ends).
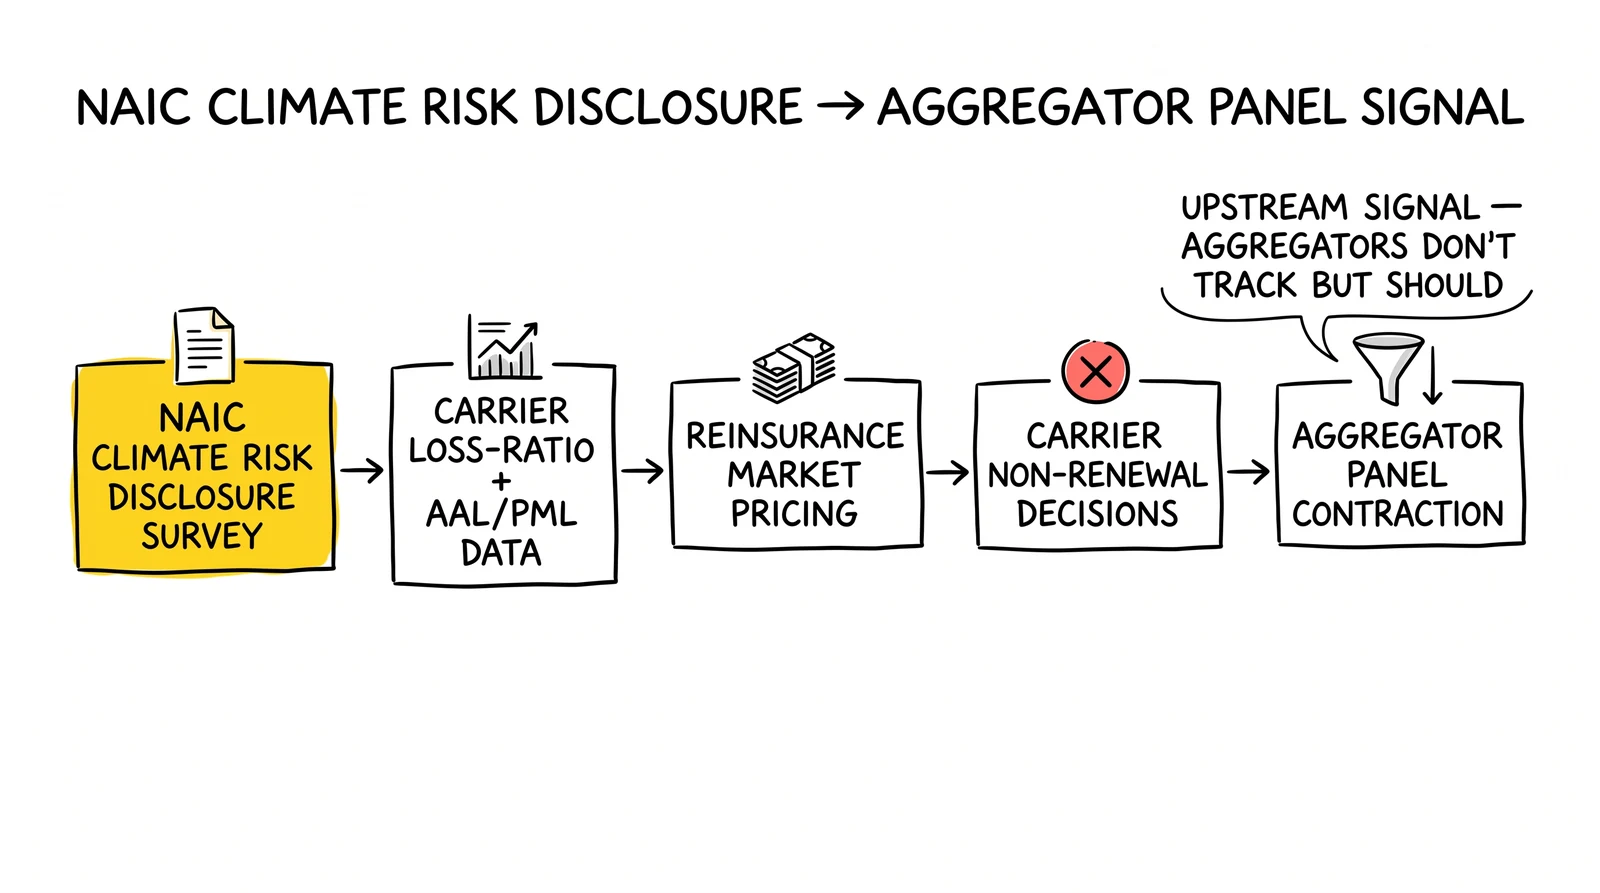
Aggregators do not file the survey. But the disclosures it produces feed AM Best, Moody’s, S&P, and state regulator decisions, and those decisions feed back into carrier appetite – which is what aggregators see as panel changes. In 2026 AM Best lifted the US homeowners market segment outlook from negative to stable (December 2025), citing moderating premium growth, improving catastrophe risk management, and softening reinsurance – but the Florida and California state-segment outlooks remain materially weaker than the national average.
What the disclosures will likely show
The 2025 reporting year (filed August 31, 2026) will be the first to incorporate the January 2025 Los Angeles fire losses fully. Three-year-trended climate scenario disclosures from California-exposed carriers should show:
- AAL increases in fire-exposed ZIPs as forward-looking models price the post-Palisades-Eaton baseline.
- PML stress increases as the 1-in-100 and 1-in-250 wildfire scenarios are recalibrated against the actual 2025 event.
- Reinsurance dependency disclosures that highlight the carrier-level exposure to reinsurance market conditions – which is precisely what softened 15% to 30% in the June 2026 Florida renewals.
- Secondary perils framing – wildfire in California, severe convective storm and inland flood in Florida – getting elevated status alongside hurricane and earthquake in carrier disclosures.
Each disclosure pillar maps to an aggregator-visible second-order effect. Carriers reporting elevated AAL in California fire-exposed ZIPs will tighten new-business filters in those ZIPs over the next 4 to 8 quarters. Carriers reporting reinsurance pass-through pricing under SIS or post-SB 2-A Florida will be the carriers willing to bind in stressed ZIPs at premium-loaded but commercially-viable prices. The aggregator who reads the August 31, 2026 disclosure cycle within 30 days of filing has a 60- to 90-day informational lead on the next round of panel changes.
The aggregator-side math: panel depth, auction depth, rejection rates
The standard lead-aggregator P&L math in home insurance assumes a stable panel: roughly 5 to 10 binding-eligible carriers per ZIP for shared-lead inventory, roughly 1 to 3 carriers per ZIP for exclusive-lead inventory, with auction prices set by the competitive bidding among those carriers. When the panel shrinks, three things happen at once:
- Auction depth falls, which lowers winning-bid clearing prices because there are fewer competing bidders.
- Rejection rates rise, because each lead has to match a narrower set of carrier underwriting filters (and any single carrier’s tightened roof-age, wind-mitigation, or fire-score filter rejects more inventory).
- Time-to-sale lengthens for non-binding-eligible leads, which forces aggregators into either deeper discounting on shared inventory or higher rejection-reverse rates on the buyer side – both of which compress unit economics.
In Florida 2026 the panel depth is recovering (more new carriers, softer reinsurance, depopulation success), but the recovery is concentrated in interior counties and lower-roof-age housing stock. Coastal ZIPs with 20-plus-year roof stock remain on a thinned panel with Citizens as the residual buyer.
In California 2026 the panel depth in fire-exposed ZIPs is structurally thin – the SB 824 moratorium expiry restarted the non-renewal counter, the FAIR Plan absorbs the residual, and SIS-participating admitted carriers are slowly fulfilling 85% commitments. Coastal and inland-fire ZIPs operate on a near-monoline residual posture for now. SIS-driven panel expansion should show up in the back half of 2026 and into 2027.
What an operator panel-tracking dashboard should include
Beyond the standard CPL, EPC, sell-through, and net-revenue metrics, home-insurance aggregators operating in Florida and California in 2026 should track:
- Binding-eligible carriers per ZIP, refreshed monthly from carrier-rate-filing and appetite-letter data.
- FAIR Plan / Citizens share of bound policies per ZIP, refreshed quarterly from CDI or OIR data.
- Reinsurance rate-on-line for major carrier counterparties on a trailing-12-month basis, refreshed at June 1 and January 1 renewal cycles.
- NAIC Climate Risk Disclosure Survey filings for the top 20 panel carriers, refreshed annually after the August 31 deadline.
- Non-renewal rate by state, refreshed annually from NAIC MCAS data (with a 12-month lag).
The aggregators that build this dashboard in 2026 will see panel changes 3 to 6 months before they show up in win rates and clearing prices. The aggregators who don’t will see panel changes in the form of margin compression they cannot diagnose in time to reprice.
What the lead-buyer side is doing
Carrier-direct lead programs are the other half of the panel story. Progressive’s direct-acquisition arms race (covered in the Q1 2026 earnings breakdown and the State Farm overtake analysis) demonstrated that carriers are willing to spend at unprecedented levels on direct customer acquisition when rate adequacy returns. The same dynamic is now playing out in home insurance – but with a Florida and California twist.
EverQuote’s Q1 2026 print signaled the inflection: home and renters insurance revenue rose 33% year-over-year to $18.5 million, and approximately 80% of the top-25 EverQuote carriers were below peak quarterly spend, suggesting the carrier-comeback runway remains long. EverQuote partners with seven of the top 10 P&C carriers and more than 5,000 local agents. The structural read: once rate adequacy returns and the reinsurance market softens (both of which are happening in mid-2026), carriers move from “price hikes only” to “growth via digital acquisition” – which is the cycle that funds aggregator panel expansion.
MediaAlpha’s Q1 2026 print made a similar point. Open marketplace shift is real. Non-top-5 carriers historically allocated 2% to 3% of advertising budget to the MediaAlpha exchange versus a benchmark 10% to 20% – the gap represents the panel expansion runway for the next 12 to 24 months. The new entrants in Florida and the SIS-participating carriers in California are precisely the cohort moving from “non-allocator” to “active allocator” in the aggregator panel.
For aggregators monetizing Florida and California home inventory, the operating posture should be:
- Sell into the recovery, not the panic. New Florida carriers and SIS-participating California carriers are scaling acquisition spend. Get on their panels early.
- Reprice for ZIP-level panel depth, not state-level averages. A Tampa lead at June 2026 panel depth prices differently than a Cape Coral lead, even though both are “Florida home.”
- Segment by roof age, wind mitigation, and fire score. Carrier filters are now tight enough that pre-filtering inventory to match carrier underwriting boxes raises sell-through dramatically.
- Build a residual-market routing path. Citizens-eligible and FAIR Plan-eligible consumers are not monetizable in standard shared-lead inventory, but they are valuable for licensed-broker referral programs and surplus-lines E&S routing.
What happens next: 12-month outlook
The 12-month panel-shrinkage outlook for home insurance lead aggregators in Florida and California breaks roughly as follows.
Florida – Panel depth expands modestly through Q3 and Q4 2026 as new carriers (Slide, Frontline reciprocal, Wingsail, Builder Reciprocal, plus the broader 20 new approved P&C insurers) ramp underwriting capacity, reinsurance pass-through pricing supports tighter combined ratios, and the SB 2-A litigation reform continues to suppress AOB-related loss costs. Citizens depopulation should continue, with the policy count likely falling to 300,000 to 350,000 by end-2026. Coastal high-roof-age ZIPs remain a thinned panel, but interior and newer-construction ZIPs improve materially. Aggregator panel-depth metric (binding-eligible carriers per ZIP) likely rises 10% to 20% year-over-year across the state, with much wider geographic variance.
California – Panel depth in fire-exposed ZIPs remains thin through 2026, with structural recovery starting late-2026 and accelerating into 2027 as SIS-participating carriers fulfill 85% writing commitments and forward-looking catastrophe models stabilize after the 2025 fire-loss recalibration. The expired SB 824 moratorium means 2026 non-renewal counts will jump in the previously-moratoriumed Palisades and Eaton ZIPs (reportable in 2027 MCAS data). FAIR Plan growth slows as SIS bites; new-policy adds likely fall to 8,000 to 12,000 per quarter in 2026. Aggregator panel-depth metric likely flat-to-down in fire-exposed ZIPs through Q3, then improving Q4 2026 and into 2027.
The two-state convergence point: by mid-2027 the Florida market should look broadly healthier than the 2023 baseline, while the California market should look structurally repaired but cyclically still recovering from the 2025 fire-loss cohort working through carrier balance sheets. The aggregators who get repricing and panel-tracking right through the 2026 transition will exit 2027 with materially better unit economics than the operators who continue running 2023-vintage panel assumptions.
Key Takeaways
- Florida non-renewed 3.35% of homeowners policies in 2024, the highest rate in the nation and 1.7x the 2018 rate. California non-renewed 3.18%, which is 3.9x its 2018 rate. The data lags 12 months and the California number understates 2025 reality because of the SB 824 moratorium suppression.
- Panel availability – not consumer search demand – is the binding constraint on home-insurance aggregator monetization in Florida and California in 2026. Aggregators should track binding-eligible-carriers-per-ZIP as the leading metric, not national panel count.
- Florida is in a recovery phase: Citizens fell from 1.42M to ~395K policies, the 8.7% June 2026 rate cut took effect, reinsurance softened 15% to 30% at June renewals, and 20 new property insurers have entered since reforms. Coastal high-roof-age ZIPs remain thin-panel; interior ZIPs expand.
- California is in a structural-repair phase: the FAIR Plan peaked at ~668,600 policies in late 2025 and reached 684,388 in March 2026 with $750B exposure. The $1B FAIR Plan assessment (the first in 30+ years) cleared losses from the Palisades-Eaton fires. SB 824’s January 2026 expiry restarted the non-renewal counter.
- The Sustainable Insurance Strategy (SIS) is the California recovery lever: SIS-participating carriers must write 85% of statewide share in CDI-designated undermarketed ZIPs in exchange for forward-looking catastrophe models and reinsurance pass-through. The carrier-commitment math drives panel expansion in fire-exposed ZIPs through 2026 to 2027.
- NAIC Climate Risk Disclosure Survey responses are due August 31, 2026 for 2025 reporting year. The TCFD-aligned disclosures from 15 states cover ~80% of US insurance market and feed AM Best, Moody’s, and regulator decisions that flow back into carrier appetite signals aggregators see in their panel.
- Progressive’s 56,000-policy Florida home non-renewal for roof age was a panel-shrinkage canary, and the new entrants (Slide, Frontline reciprocal, Wingsail, Builder Reciprocal, plus ~20 new approved insurers) are the recovery counterweight – but they buy in narrower ZIP slices than the nationals they replaced.
- EverQuote Q1 2026 home insurance revenue grew 33% YoY to $18.5M with ~80% of top-25 carriers below peak spend, signaling a long carrier-comeback runway. MediaAlpha non-top-5 carriers at 2%-3% MAX allocation vs benchmark 10%-20% represents the panel-expansion runway for the next 12 to 24 months.
- Operators should reprice by ZIP-level panel depth, not state-level averages, segment by roof age and wind mitigation, build residual-market routing for Citizens/FAIR Plan-eligible consumers, and refresh panel dashboards monthly. The aggregators who get panel-tracking right through 2026 exit 2027 with materially better unit economics.
Sources
- Weiss Ratings – Homeowners in Florida and California Dropped by Their Insurance Companies at Highest Rate in Nation (2024 NAIC MCAS analysis)
- National Mortgage News – Home insurers drop California, Florida policies at high rate (2026)
- Citizens Property Insurance Corporation – 2026 Recommended Rate Filing Executive Summary (December 2025)
- Citizens Property Insurance Corporation – Recommends Rate Cuts for Most Policyholders (December 10, 2025)
- Insurance Journal – Three New HO Carriers and an Improving Condo Market in Florida (May 21, 2026)
- Insurance Business – Progressive dropping coverage for 56,000 Florida homes (2024)
- The Insurer – Florida reinsurance rates down 15% to 20% at June renewals: Guy Carpenter (May 28, 2026)
- Insurance Business – Florida reinsurance rates fall 30% for Citizens as capital floods the market (2026)
- California Department of Insurance – Mandatory One-Year Moratorium on Non-Renewals (SB 824)
- California Department of Insurance – Bulletin 2025-1 Zip Codes Covered by Mandatory One-Year Moratorium
- California Department of Insurance – Sustainable Insurance Strategy
- California FAIR Plan – Key Statistics & Data
- California FAIR Plan – One Year Later: FAIR Plan Response to the Eaton and Palisades Wildfires
- California Department of Insurance – Bulletin 2025-4 Guidance Regarding Insurer Recoupment Procedures in Response to FAIR Plan Assessment
- NAIC – Climate Risk and Resiliency Resource Center
- NAIC – Climate Risk Disclosure Survey (CDI California portal – TCFD-aligned framework)
- Insurance Information Institute – Florida Premiums Drop Amid Post-Reform Stability (March 31, 2026)
- EverQuote – First Quarter 2026 Financial Results (Q1 2026 home insurance revenue $18.5M, +33% YoY)
- Insurance Journal – Reinsurers Bring Strong Risk Appetite to Florida’s June Renewals: Guy Carpenter (June 22, 2026)
- Calmatters – California’s FAIR Plan is under pressure. Will these bills help? (2025)