Four lead aggregators reported Q1 2026 inside a six-day window. The growth rates are loud. The business-mix divergence is louder.
The Six-Day Scoreboard
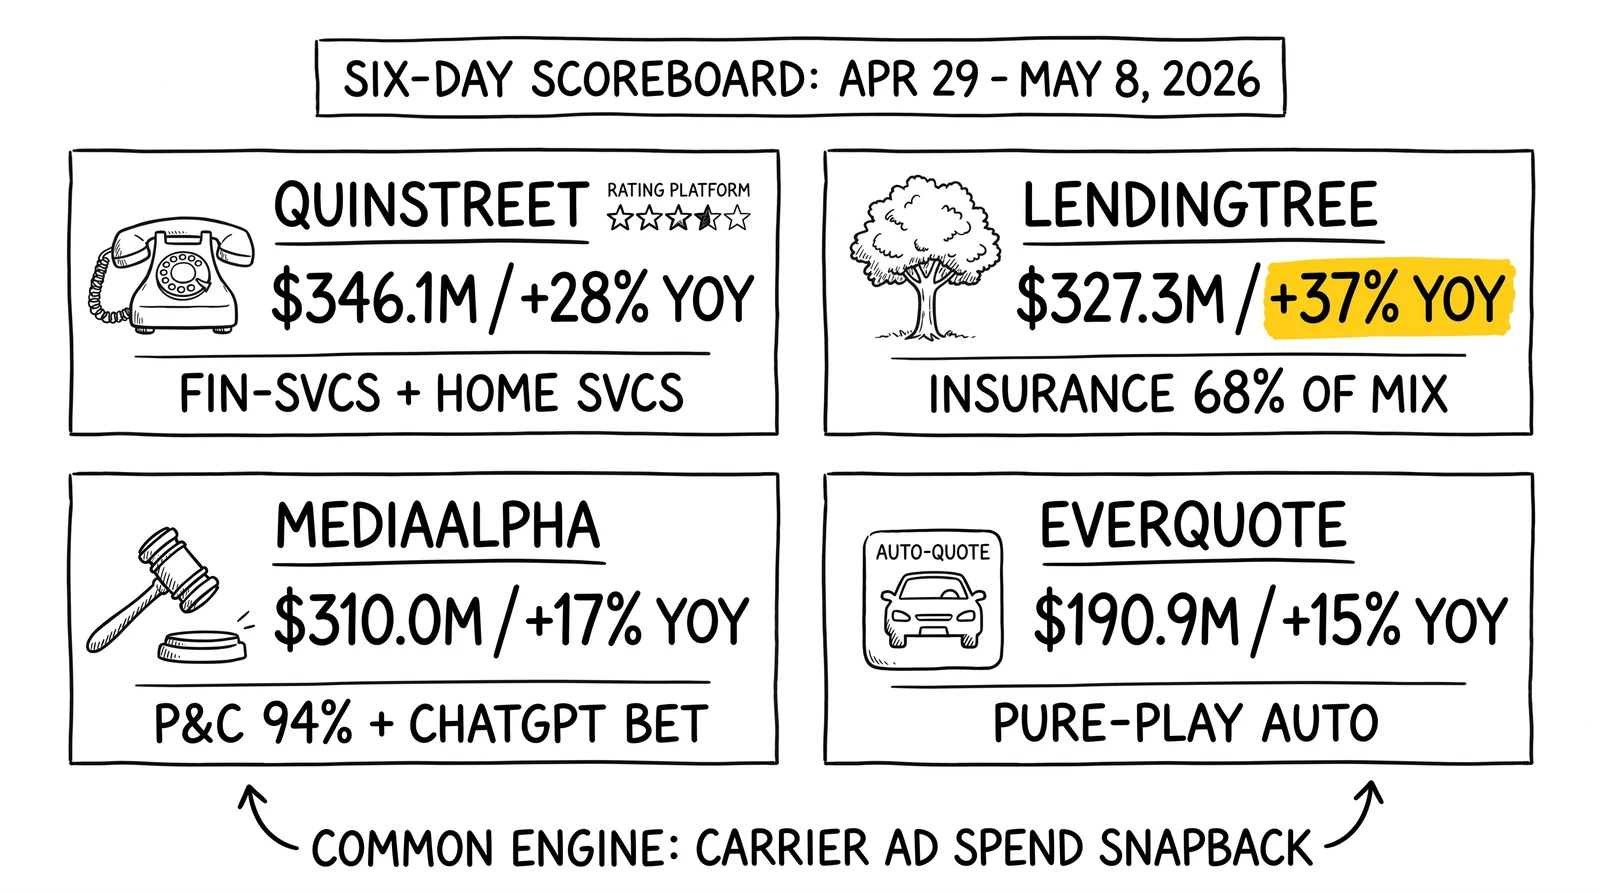
Between April 29 and May 8, 2026, the four largest publicly traded U.S. lead aggregators printed quarterly results. The headline numbers, in order of revenue:
| Company | Q1 2026 Revenue | YoY Growth | Adj. EBITDA | Adj. EBITDA YoY | Primary Vertical |
|---|---|---|---|---|---|
| QuinStreet | $346.1M | +28% | $29.6M | +53% | Financial services + home services |
| LendingTree | $327.3M | +37% | $42.0M | +71% | Insurance, consumer credit, mortgage |
| MediaAlpha | $310.0M | +17% | $31.4M | +7% | P&C insurance marketplace |
| EverQuote | $190.9M | +15% | $29.3M | +30% | Auto + home insurance |
Every one of the four beat its top-line guidance. Three of the four set quarterly records on either revenue or adjusted EBITDA or both. None of the four issued a soft Q2 guide – all four guided up.
A simple framing for operators reading these prints: every public lead aggregator is now growing faster than at any point since the 2022 hard-market freeze. The question is no longer “is the cycle on?” – the question is “which business model is best positioned for the next four quarters, and which is closest to the ceiling?”
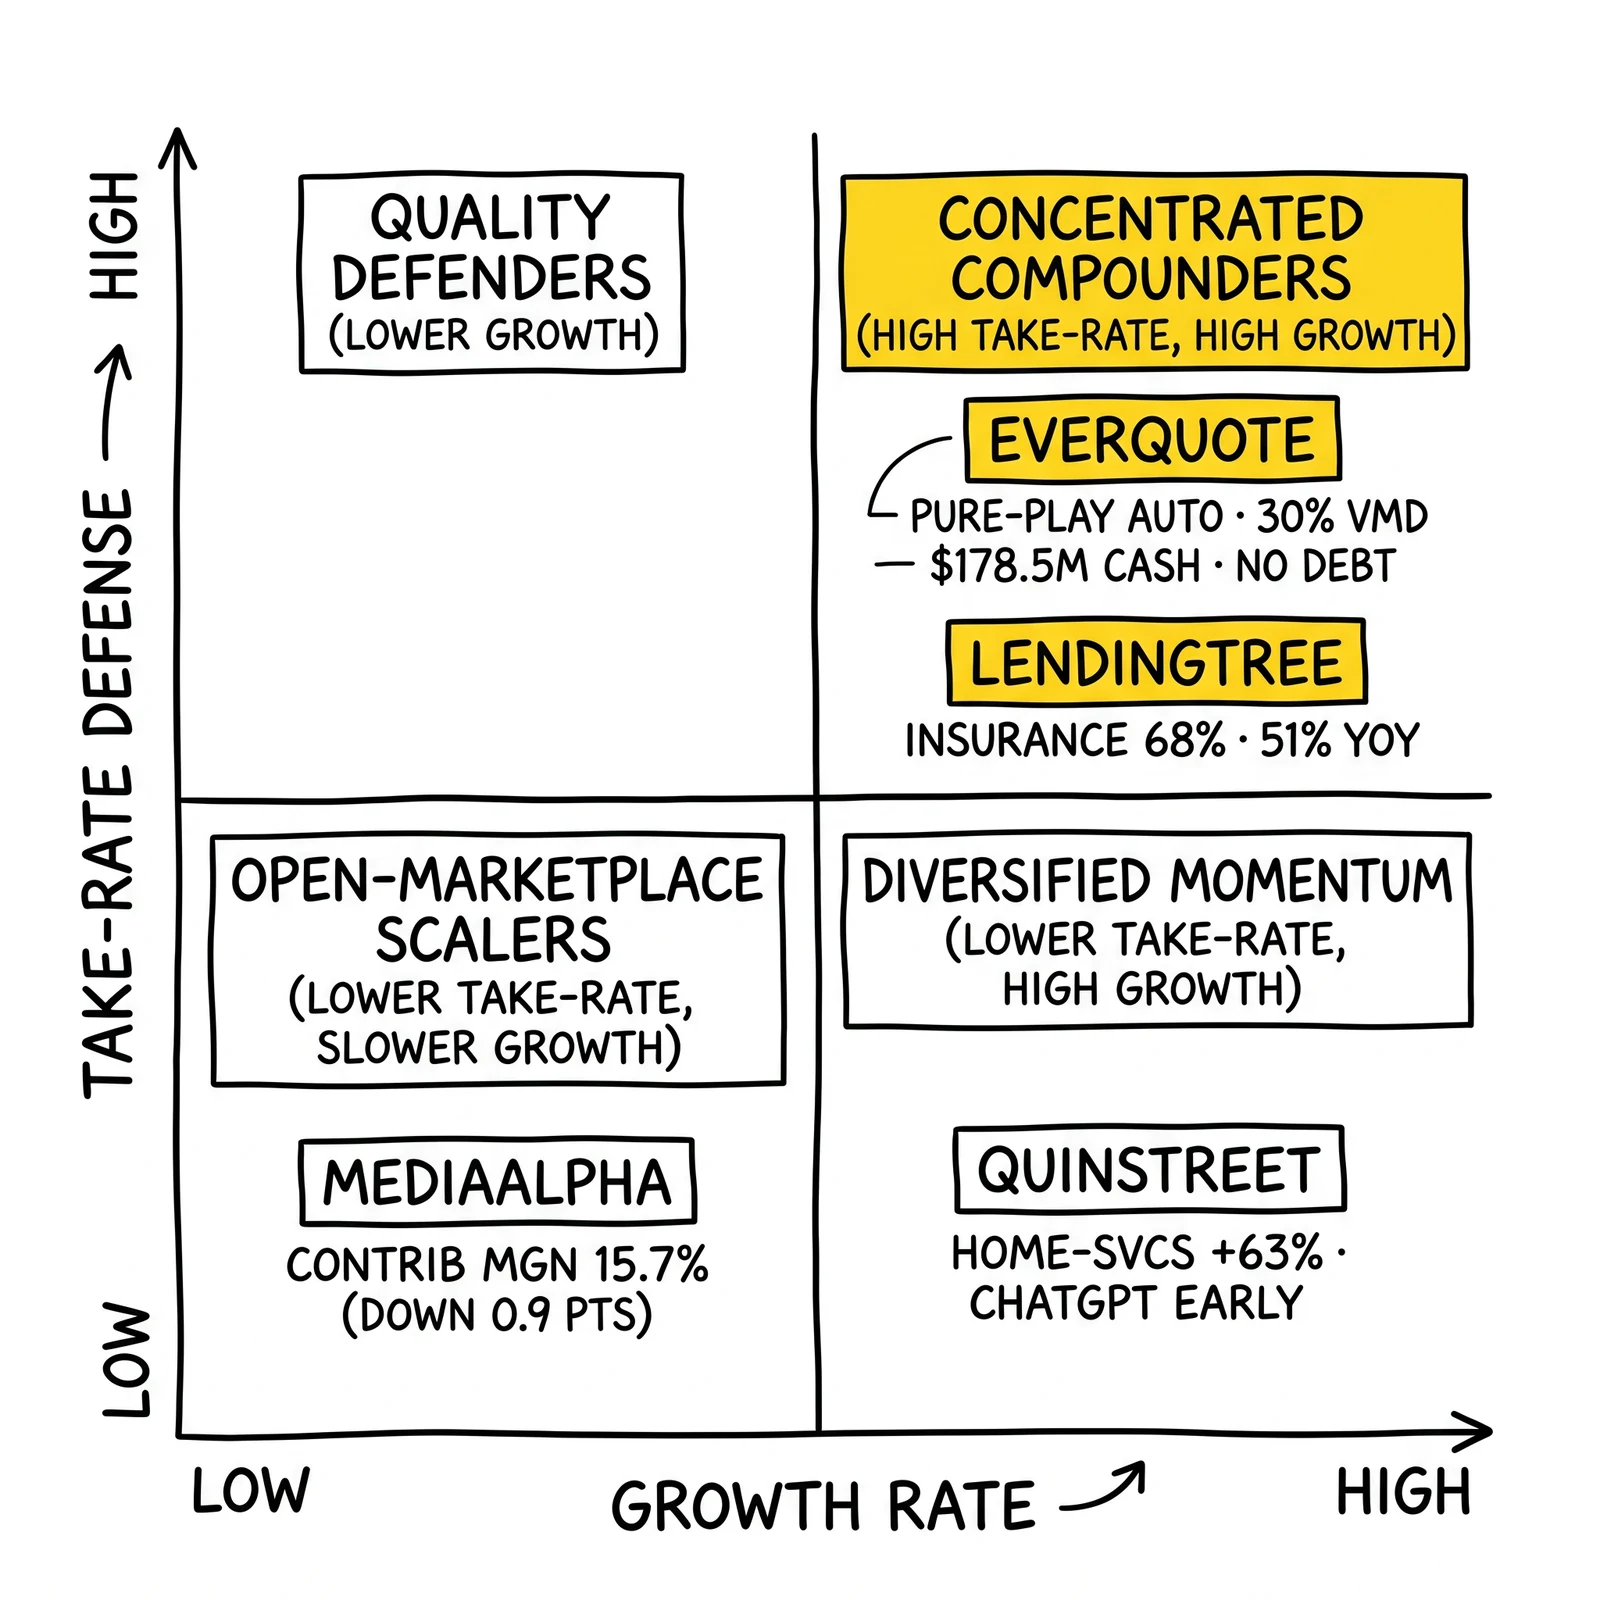
The four companies answer that question very differently. LendingTree is a mortgage marketplace pivoting hard into insurance. QuinStreet is a consumer fintech and home services performance shop. EverQuote is a pure-play auto insurance marketplace running an AI-heavy traffic engine. MediaAlpha is a transparent open marketplace betting that a ChatGPT-routed shopping experience is the next distribution rail.
The carrier ad spend tailwind is the same. The bets on what comes after are not.
What’s Powering the Tailwind
Personal-lines auto and home insurance carriers spent 2022 and most of 2023 in defensive posture. Combined ratios were above 100 across the major direct writers. Loss costs from used-car-value inflation, severity per claim, and weather events made it cheaper to lose customers than to acquire them at any meaningful per-policy unit cost. Carrier ad spend fell. Aggregator revenue fell. EverQuote’s 2022 results, MediaAlpha’s transaction value collapse, QuinStreet’s auto vertical reset – all of those were the same story.
That cycle reversed in mid-2024 and accelerated through 2025. By Q3 2025, the largest carriers were running underwriting margins north of 13 points. Progressive alone spent approximately $1.3 billion on advertising in Q3 2025, roughly 10% above the same quarter in 2024, per Insurance Journal’s reading of Q3 statutory filings. GEICO’s full-year 2025 ad spend approached $1.9 billion – roughly 35% above 2024, with policy acquisition costs continuing to surge per S&P Global Market Intelligence research. Analyst consensus had GEICO’s expense ratio rising to 14.5% by Q4 2026, an indication that the spend rebuild is multi-quarter, not a single-quarter pulse.
When carriers spend on direct acquisition, they are bidding in the same auctions that absorb aggregator inventory. Carrier-direct demand raises the auction floor. Aggregators sitting in those auctions – every one of the four reporting here – see panel revenue rise without changing their own sales motion. That’s the dominant signal in the Q1 2026 prints.
The carrier-side question for the back half of 2026 is whether loss ratios from a heavier fire and hurricane season will pull marketing budgets back to renewals and away from new acquisition. That risk has not yet shown up in the Q1 commentary. Every aggregator described carrier participation as broadening, not narrowing.
LendingTree: The Mortgage Shop That Became an Insurance Shop
LendingTree’s Q1 2026 print is the cleanest example of vertical-mix transformation in the lead-aggregator group. Consolidated revenue hit $327.3 million, up 37% YoY. GAAP net income was $17.3 million, or $1.22 per diluted share, against a year-ago loss. Adjusted EBITDA grew 71% YoY to $42.0 million – the company’s highest level in several years.
Segment breakdown:
- Insurance: $221.9M revenue (+51% YoY), $57.9M segment profit (+50%)
- Consumer: $66.3M revenue (+18% YoY), $32.9M segment profit (+21%)
- Home: $39.1M revenue (+6% YoY), $10.0M segment profit (-24%)
Insurance is now 68% of LendingTree’s revenue. The Home segment – historically the mortgage lead marketplace that defined LendingTree as a company through the 2000s and 2010s – is now 12% of the top line and printed declining segment profit. The Consumer segment, which includes credit cards and personal loans, grew solidly but is now smaller than what insurance grew by in a single quarter.
The insurance growth math is worth unpacking. Per the company’s earnings transcript, the $74.5 million of insurance revenue growth split into a 28% volume increase (about $48.9 million) and an 18% revenue-earned-per-consumer increase (about $26.3 million). That mix is the cleanest signal in the entire four-way scoreboard: roughly two-thirds of the insurance growth came from selling more leads, one-third came from selling each lead for more money. The per-unit price compression that defined 2022-23 is fully reversed.
Insurance Variable Marketing Dollars set a new quarterly record, surpassing the previous $48 million by approximately $10 million – about 20% above peak. CEO Scott Peyree’s framing on the earnings call was that LendingTree now operates “the largest marketplace for consumers to shop for Insurance products.” That positioning is more defensible than the marketing-language version of it might suggest. LendingTree’s insurance segment is now larger than EverQuote’s total revenue and is closing fast on MediaAlpha’s P&C segment.
Peyree’s appointment in October 2025 is part of the story. He founded QuoteWizard, the auto insurance lead marketplace LendingTree acquired in 2018, and spent the intervening years running insurance inside LendingTree. The October 2025 CEO move was effectively an insurance-domain operator taking the top job at a company whose insurance segment was already the growth engine. Q1 2026 is the first full quarter under that posture, and the company raised full-year 2026 guidance to $1.30-1.35 billion in revenue and $152-162 million in adjusted EBITDA. Net leverage improved to 2.1x at quarter-end.
The structural read on LendingTree: this is not a mortgage company anymore. It is an insurance marketplace with mortgage and consumer credit attached. The mortgage attach has option value if rates fall meaningfully in 2026 H2. The base case is that insurance carries the company.
For the carrier-direct lead programs context, LendingTree’s insurance scale now puts it in the same auction tier as MediaAlpha and EverQuote for top-15 P&C carrier bids. Carriers can no longer treat LendingTree as a primarily-mortgage panel partner.
QuinStreet: Financial Services Plus a Home Services Engine That Won’t Slow Down
QuinStreet’s fiscal calendar runs July-to-June, so its Q3 FY2026 print covers calendar Q1 2026 – directly comparable to the other three reporters. Revenue was $346.1 million, up 28% YoY, a company quarterly record. Adjusted net income was $17.8 million, or $0.31 per diluted share. Adjusted EBITDA reached $29.6 million, up 53% YoY, also a record.
The segment story:
- Financial Services: $231.8M revenue (67% of total, +16% YoY). Auto insurance inside this vertical grew 27% YoY to a quarterly record.
- Home Services: $114.3M revenue (33% of total, +63% YoY), with run-rate now approaching half a billion dollars annually per management commentary.
QuinStreet ended the quarter with $102 million in cash and $54 million of net debt. The Q4 FY2026 guide is $350-370 million in revenue (+34% YoY at midpoint) and $37-43 million in adjusted EBITDA (+67% YoY at midpoint), with management calling out continued margin expansion. The FY2027 early outlook is “strong double-digit revenue and EBITDA growth expected across all verticals.”
Two distinct narratives sit inside this single print. The financial services side – anchored by auto insurance – is participating in the same carrier-ad-budget cycle as LendingTree, EverQuote, and MediaAlpha. Auto insurance growing 27% YoY inside the segment is roughly in line with what the other three reported on a like-for-like comp.
The home services side is a separate story. HomeBuddy’s integration is running ahead of schedule per CEO Doug Valenti, and home services is now compounding at a rate that’s outpacing every other lead vertical inside any public-company comp. Solar’s collapse (post-25D-credit) is real and is dragging some home services panel partners, but QuinStreet’s exposure mix and execution have outpaced that drag. The 63% YoY growth rate in a vertical that should be facing some macroeconomic headwinds (high rates, soft housing turnover) is the standout disclosure in the four-way scoreboard.
Valenti’s AI commentary is also distinctive. Per the Q3 FY2026 transcript, QuinStreet is using AI to integrate “new and updated carrier rates faster and at greater scale into QRP” – the company’s rating platform – at roughly 50% productivity gains. Ad creative production has improved approximately 400% via AI tooling. Most consequentially: QuinStreet is an “early participant in OpenAI’s advertising platform, already generating initial revenues across insurance and home services segments.”
That last disclosure deserves operator attention. ChatGPT advertising inventory is not yet a meaningful revenue channel for QuinStreet on an absolute-dollar basis, but the company is one of the first lead aggregators on record monetizing through it. Combined with MediaAlpha’s Autoinsurance.net launch (covered below), the read is that the four-way scoreboard implicitly includes a ChatGPT distribution channel as a 2026-2027 growth vector for at least two of the four.
Structurally, QuinStreet is the most diversified of the four. Financial services revenue alone matches LendingTree’s insurance segment. Home services is on its own growth trajectory. The risk is that the home services growth rate moderates and the company has to defend the multiple on a financial-services book that grows at LendingTree-insurance velocity. Q4 FY2026 will test that.
EverQuote: Pure-Play Auto Insurance, Cleanest Profitability
EverQuote’s Q1 2026 print is the most narrowly scoped of the four. Total revenue was $190.9 million, up 15% YoY. Automotive insurance revenue was $172.4 million (+13% YoY), home and renters revenue was $18.5 million (+33% YoY). GAAP net income was $18.7 million. Adjusted EBITDA hit $29.3 million, up 30% YoY – a quarterly record. Variable Marketing Dollars came in at $55.9 million. The balance sheet shows $178.5 million in cash and no debt.
The Q2 2026 guide is $185-195 million in revenue (+21% YoY at midpoint), $55-57 million in VMD (+23% at midpoint), and $28-30 million in adjusted EBITDA (+32% at midpoint).
EverQuote is the simplest comparison in the group: auto insurance is roughly 90% of the business, home and renters is the rest. The growth rate is the slowest of the four reporters, but the profitability quality is the highest. No debt, $178.5 million in cash, expanding margins, and record absolute EBITDA on the smallest revenue base.
CEO Jayme Mendal’s commentary on the earnings call was the most carrier-direct of the four. Per multiple analyst recaps, Mendal said “all the major carriers now [are] live and participating in the auction” – a statement consistent with Progressive’s Q1 2026 direct-acquisition arms race reading. CFO Joseph Sanborn flagged that one key carrier “more than doubled its expected spend late in the quarter,” supporting broad-based revenue upside. Most consequentially: “80% of EverQuote’s top 25 carriers have not reached historical peak levels of spend.”
That last data point is the cleanest forward signal in the entire four-way scoreboard. If 20 of the top 25 P&C carriers buying EverQuote inventory are still below their own historical advertising spend peaks, the carrier-side budget cycle has multiple quarters of upside left. The Q3 2025 ad spend numbers for Progressive and GEICO confirm the same conclusion from the carrier filings.
The AI angle at EverQuote is also distinctive. Mendal and Sanborn repeatedly framed AI as a productivity lever and a product advantage. Mendal pointed to an AI-powered traffic engine that aligns ad spend with carriers’ underwriting preferences and growth goals, and Smart Campaigns that productize AI-driven bidding capabilities. The company is “significantly ramping the build, deployment, and usage of agentic AI tools” across employees.
CFO Sanborn reiterated EverQuote’s previously stated goal of $1 billion in annual revenues in 2-3 years with ongoing strong cash flow generation. At a Q1 2026 run rate of roughly $760 million annualized and Q2 guidance pointing to ~21% YoY growth, the path to $1 billion is mechanically visible if the carrier spend cycle holds.
The structural read on EverQuote: this is the highest-quality book among the four. The lowest growth rate is a function of being the most concentrated in a single sub-vertical (auto), but that concentration is the entire reason the profitability is the cleanest. Operators reading the four-way scoreboard for the most defensive comp should anchor on EverQuote’s print, not LendingTree’s.
MediaAlpha: The Transparent Marketplace and the ChatGPT Bet
MediaAlpha’s Q1 2026 print is the largest in absolute scale on a single-vertical basis but the slowest on adjusted EBITDA growth. Revenue was $310.0 million, up 17% YoY. Net income swung positive to $14.0 million from a $2.3 million loss a year ago. Adjusted EBITDA was $31.4 million, up 7% YoY. Contribution was $48.7 million (+11% YoY). Contribution margin compressed to 15.7% from 16.6%. Gross margin compressed to 15.1% from 15.8%.
The segment breakdown is more dramatic than the consolidated numbers suggest:
| Segment | Q1 2026 | % of Total | YoY |
|---|---|---|---|
| Property & Casualty Insurance | $292.8M | 94.4% | +31% |
| Health Insurance | $11.2M | 3.6% | -67% |
| Life Insurance | $5.8M | 1.9% | +4% |
P&C insurance growing 31% YoY is the headline. Health insurance collapsing 67% YoY is the asterisk. MediaAlpha is now effectively a P&C insurance marketplace with a small residual health and life book – health was a meaningful contributor as recently as 2023 and is now a rounding error.
The contribution margin compression is the operator-relevant signal. MediaAlpha’s open marketplace model means that as carrier participation broadens – non-leading carriers (top-15 or top-20) increasing their MAX participation from 2-3% of their total ad budget toward a benchmark closer to 10-20% – the implied take-rate compresses. The marketplace is processing more transaction value but earning slightly less per dollar transacted. That math is consistent with the Q1 print: revenue +17%, contribution +11%, contribution margin down 0.9 points.
MediaAlpha also discontinued reporting Transaction Value as a non-GAAP metric effective Q1 2026, citing simplification. That removes one of the cleanest historical signals operators used to track the broader auto insurance shopping environment. Going forward, revenue, contribution, contribution margin, and adjusted EBITDA are the disclosed numbers.
Three capital structure moves complete the Q1 2026 picture:
- Debt refinancing. MediaAlpha refinanced into a $150 million senior secured term loan plus a $60 million revolver, both maturing March 2031. Total debt ended Q1 at ~$163.5 million.
- Share repurchases. $25 million YTD 2026, approximately 2.6 million shares. Over the trailing three quarters: $73 million, ~3.7 million shares, ~10% of shares outstanding. $60 million remains under the $100 million program.
- Autoinsurance.net launch (April 2, 2026). A ChatGPT-powered conversational auto insurance shopping app, described by the company as the insurance industry’s first carrier-approved conversational AI application. Existing carrier partners participate through the same workflows they already use – no new integration required. MediaAlpha has over 1,150 active partners and generated over 141 million consumer referrals in 2025.
The Autoinsurance.net launch is the most strategically loaded disclosure in the entire four-way scoreboard. The product positioning is straightforward: MediaAlpha is staking a claim on the lead-handoff layer for ChatGPT-routed auto insurance shopping. If ChatGPT meaningfully captures consumer shopping intent over the next 12-24 months, MediaAlpha intends to be the carrier-side distribution rail.
The Q2 2026 guide reinforces the directional read: revenue of $290-310 million (+19% YoY at midpoint), contribution of $45.5-48.5 million (+18%), adjusted EBITDA of $28.0-30.5 million (+19%). Excluding the under-65 health collapse, mid-to-high twenties growth is projected. The core P&C marketplace is healthy.
The structural read on MediaAlpha: this is the most asymmetric bet in the four-way group. The base case is a transparent marketplace harvesting the carrier ad spend cycle. The upside case is ChatGPT-routed shopping becoming a meaningful consumer behavior – in which case MediaAlpha’s carrier-approved app is positioned to be the dominant lead-handoff layer. The downside case is take-rate compression continuing into Q3-Q4 as more non-top-5 carriers join and the platform monetizes them at lower margin.
Operators thinking about insurance lead exchanges and the open marketplace vs. closed marketplace question should read the MediaAlpha contribution margin compression as the structural cost of the open model – and price it accordingly when running their own marketplace economics.
CPL, EPL, and Take-Rate Signals Across the Four
None of the four companies discloses cost-per-lead, earnings-per-lead, or marketplace take-rate directly. But the Q1 2026 prints contain enough decomposition to infer trajectory across all three.
Earnings per consumer (LendingTree proxy for EPL). LendingTree’s 18% YoY increase in revenue earned per consumer in insurance is the most direct read on EPL in the entire group. Aggregators selling auto insurance leads should expect roughly that magnitude of YoY price uplift in their own panel revenue, assuming similar carrier participation mix. Operators with mid-tier (top-15 to top-30) carrier panels may see less; operators with concentrated top-5 carrier panels may see more, because the largest carriers are also bidding most aggressively.
Variable Marketing Dollars trajectory (EverQuote proxy for net margin per lead). EverQuote’s $55.9 million in Q1 2026 VMD against $190.9 million in revenue implies a roughly 29% VMD margin. Q2 guidance points to that holding or expanding slightly. For private lead aggregators, this is the public-company anchor for “how much margin can a pure-play insurance marketplace defend in a carrier-friendly cycle.” Operators printing materially below 25% VMD margin in their own books are either competing on lower-tier inventory or paying too much for traffic.
Contribution margin (MediaAlpha proxy for take-rate). MediaAlpha’s contribution margin compression from 16.6% to 15.7% is the cleanest read on what happens to take-rate as carrier participation broadens. Transparent marketplaces – those that publish bid prices and let carriers participate without curation – face structural take-rate pressure as the carrier base widens. Operators running transparent vs. opaque marketplace models on Boberdoo, LeadsPedia, or Phonexa should expect similar take-rate compression as their panels broaden.
Volume vs. price decomposition. LendingTree’s insurance segment growth split – 28% volume, 18% rate – is the cleanest macro read. Roughly two-thirds of the cycle’s lift is coming from selling more leads, one-third from selling them for more money. Operators planning headcount and infrastructure for the back half of 2026 should plan for the volume side to keep growing faster than the price side, which means call center capacity, lead-scoring infrastructure, and routing capacity are the binding constraints. Not pricing.
Carrier participation depth. EverQuote’s “80% of top 25 carriers below historical peak spend” is the cleanest forward indicator. If that ratio is broadly representative across the four marketplaces, the carrier-side spend cycle has 4-6 quarters of upside before any meaningful saturation. Operators pricing 2026 H2 contracts should anchor to that timeline.
What This Means for Operators Outside the Four
Private lead aggregators, lead-distribution platforms, and direct-traffic operators not riding the same Q1 2026 wave should diagnose carefully before assuming the macro is against them. Three diagnostic questions:
1. Is your panel concentrated in insurance, or in legal, solar, mortgage refi, or B2B SaaS? If insurance is less than 40% of your revenue mix, you’re not exposed to the carrier-ad-budget cycle that’s powering the public-company prints. Your macro is different. Solar in particular is still working through the post-25D-credit collapse. Legal is facing the Colorado SB 26-174 effective-August-12 disruption for any operator selling into Colorado attorneys. Mortgage refi remains rate-suppressed.
2. Is your panel concentrated in top-5 carriers, or does it skew mid-tier? Top-5 carrier panels are seeing the most aggressive bidding. Mid-tier (top-15 to top-30) panels are seeing carriers participate but at lower budget allocation. EverQuote’s auction depth signal and MediaAlpha’s carrier-participation broadening both point to mid-tier carriers ramping spend over the next 12-24 months. The mid-tier cycle is real but later.
3. Are you running a transparent or curated marketplace? Transparent marketplaces will see take-rate compress as participation broadens. Curated marketplaces with quality controls and buyer-side selection can defend take-rate longer but at the cost of slower revenue growth. MediaAlpha vs. QuinStreet’s QRP rating platform is the public-company analogue of this tradeoff – and the contribution margin gap between the two is roughly the cost of the model choice.
For operators thinking about exits or strategic capital, the Q1 2026 prints reset the comp set. LendingTree trades at one earnings multiple, EverQuote at another, MediaAlpha at a third. Private companies running an insurance vertical play should index to EverQuote for profitability quality and to MediaAlpha for transaction value scale. Public-comp multiple expansion in this segment is the single largest near-term equity tailwind.
The Q4 2026 Read
The 2026 H2 question is whether the carrier ad spend cycle survives a heavier loss-event quarter. Three risks to watch:
Hurricane season. Personal-lines insurance combined ratios are most exposed to weather events from August through October. If a major hurricane lands and pulls 2026 combined ratios above 95 at one or more top-10 carriers, marketing budgets re-prioritize to renewals and away from new acquisition. The aggregator panel revenue effect is roughly one-quarter lagged – meaning a September event hits aggregator Q4 prints and into Q1 2027.
California and Florida non-renewal continuation. Both states had multi-year-high non-renewal rates in 2025 (CA at 3.18%, FL at 3.35%). If non-renewal pace continues into 2026 H2, the carrier base willing to bind in those geographies shrinks, which mechanically reduces aggregator panel revenue in those states. The Florida home insurance market is the most exposed.
ChatGPT shopping traction. MediaAlpha’s Autoinsurance.net and QuinStreet’s OpenAI advertising platform participation are early bets on consumer shopping behavior shifting to ChatGPT. If that shift accelerates faster than carriers can configure direct integrations, MediaAlpha and QuinStreet capture incremental share. If carriers build direct ChatGPT integrations through plug-in protocols or platform partnerships, the marketplace layer gets disintermediated. The 12-24 month read on this question is now part of every aggregator’s strategic math.
The base case heading into Q3 2026 is that all four reporters continue to print double-digit growth, with QuinStreet and LendingTree most likely to outperform their respective guides. The bear case is a hurricane-induced reversal that hits Q4 prints. The bull case is that mid-tier carrier participation accelerates faster than expected and lifts EverQuote and MediaAlpha to the top of the growth-rate leaderboard.
The four-way scoreboard will get a second read when Q2 2026 results land in late July and early August. Operators should hold their seat.
Key Takeaways
- LendingTree (+37%), QuinStreet (+28%), MediaAlpha (+17%), and EverQuote (+15%) all beat Q1 2026 top-line guidance, with insurance carrier ad budgets driving the bulk of the growth across all four.
- LendingTree’s insurance segment is now 68% of revenue and grew 51% YoY to $221.9M, with EPL up 18% – the cleanest cycle read in the four-way scoreboard.
- QuinStreet’s home services grew 63% YoY to $114.3M, with HomeBuddy integration running ahead of schedule and run-rate approaching $500M annually.
- EverQuote delivered the cleanest profitability story: record $29.3M adjusted EBITDA, $178.5M cash, no debt, and a $1B annual revenue target in 2-3 years.
- MediaAlpha launched ChatGPT-powered Autoinsurance.net on April 2, 2026 – the first carrier-approved conversational AI shopping app in the vertical.
- MediaAlpha’s contribution margin compressed to 15.7% (from 16.6%) – the structural cost of transparent open-marketplace participation broadening.
- EverQuote disclosed that 80% of its top-25 carriers remain below historical peak ad spend levels, suggesting 4-6 quarters of upside in the carrier budget cycle.
- LendingTree’s insurance growth split – 28% volume, 18% rate – points to volume capacity (call centers, routing, scoring) being the binding constraint for the back half of 2026, not pricing.
- Operators outside insurance verticals (legal, solar, mortgage refi, B2B) should not anchor pricing or expansion plans to these prints – the macro driver is insurance-carrier-specific.
- Q4 2026 risks: hurricane-season loss events pulling carrier budgets back, continued FL/CA non-renewal pace, and ChatGPT shopping traction disintermediating the marketplace layer.
- Private aggregators not seeing 20-50% YoY panel revenue lift in insurance are losing share, not facing a soft market. The auction floor is up.
- The Q2 2026 prints in late July and early August will confirm or reverse the cycle read – and offer the first read on whether MediaAlpha’s Autoinsurance.net traction is material.
Sources
- LendingTree Reports First Quarter 2026 Results (PR Newswire, April 2026)
- LendingTree (TREE) Q1 2026 Earnings Transcript (The Motley Fool, April 30, 2026)
- QuinStreet, Inc. Form 8-K Q3 FY2026 (SEC EDGAR, May 2026)
- QuinStreet (QNST) Q3 2026 Earnings Transcript (The Motley Fool, May 8, 2026)
- EverQuote Announces First Quarter 2026 Financial Results (EverQuote Investor Relations, April 2026)
- MediaAlpha Q1 2026 8-K Filing Summary (StockTitan)
- MediaAlpha Launches the Insurance Industry’s First Carrier-Approved Conversational AI Application (GlobeNewswire, April 2, 2026)
- Policy acquisition costs surge at GEICO as premium growth continues to lag (S&P Global Market Intelligence, November 2025)
- What Progressive and GEICO Q3 Results Reveal About Auto Insurance Profit, Growth (Insurance Journal, November 2025)